Bathymetric maps from multi-temporal analysis of Sentinel-2 data: the case study of Limassol, Cyprus
←
→
Page content transcription
If your browser does not render page correctly, please read the page content below
Adv. Geosci., 45, 397–407, 2019
https://doi.org/10.5194/adgeo-45-397-2019
© Author(s) 2019. This work is distributed under
the Creative Commons Attribution 4.0 License.

Bathymetric maps from multi-temporal analysis of Sentinel-2 data:
the case study of Limassol, Cyprus
Evagoras Evagorou, Christodoulos Mettas, Athos Agapiou, Kyriacos Themistocleous, and Diofantos Hadjimitsis
Department of Civil Engineering and Geomatics, School of Engineering and Technology, Cyprus University of Technology,
30 Arch. Kyprianos Str., 3036 Limassol, Cyprus

Correspondence: Evagoras Evagorou (evagoras.evagorou@cut.ac.cy)

Received: 2 August 2018 – Revised: 15 December 2018 – Accepted: 23 December 2018 – Published: 9 January 2019

Abstract. During the last years, various methods and tech-       and Breman, 2010). Beyond the fact that these methods are
niques have been used to estimate the seafloor topography        very accurate, they are also very time consuming and costly
with high accuracy. The topography is considered an im-          (McCaffrey, 1981; Sánchez-Carnero et al., 2012). Airborne
portant component for marine applications since several ac-      LIDAR is another method that has been implemented for es-
tivities and infrastructures are being carried out at the bot-   timating the bathymetry which revealed to be cost effective
tom, column and surface of the sea. In this, study, freely and   compared onboard the vessels providing high area coverage
open distributed optical satellite images were used to obtain    faster (Irish and Lillycrop, 1999; Muirhead and Cracknell,
bathymetric data for shallow waters, (until 30 m below sea       1986; Ogawa et al., 2017).
level) based on timeseries analysis of multispectral Sentinel-      During the last years new studies related to Satellite-
2 datasets. The ratio transform algorithm was implemented        Derived Bathymetry (SDB) emphasize the potential use
for twelve (12) monthly images covering thus a whole year.       of optical satellite remote sensing sensors for bathymet-
The different generated Digital Terrain Models (DTMs) were       ric purposes. Indeed, analytical, semi-analytical and empir-
compared with high resolution LIDAR measurements. The            ical approaches may be implemented for the estimation of
results showed that bathymetry can be obtained from satel-       bathymetry of up to 30 m depth. The analytical and semi-
lite data within a Root Mean Square Error (RMSE) ranging         analytical approaches are based on the physics of light’s
from 1.39 up to 2.56 m while more accurate results were gen-     transmission in water using different parameters of the at-
erated during the summer period.                                 mosphere, water column and bottom material. By compar-
                                                                 ing the three methods, the analytical and semi-analytical
                                                                 methods seem to be more complicated than the empirical
                                                                 one, with more parameters in order to extract bathymetrical
1   Introduction                                                 data (Gao, 2009). Towards the end of 1970s, it was demon-
                                                                 strated that bathymetry could be estimated over clear shal-
Bathymetrical data are a crucial component of the marine         low water using remote sensing with a multi-band log lin-
area since several activities and infrastructures are being      ear algorithm (Lyzenga, 1978, 1980). Afterwards, this an-
carried out at bottom, column of the sea and sea surface.        alytical approach has been determined in various ways or
The importance of bathymetry is quite high in areas where        with small modifications to derive bathymetry (Conger et al.,
there are shallow waters, such as harbors. Nowadays, var-        2006; Lyzenga et al., 2006; Maritorena et al., 1994; Philpot,
ious remote sensing datasets are used to determine the to-       1989). An algorithm for determining the depth of pene-
pography of the seafloor with high accuracy, including ac-       tration (DOP) zones for every band and calibrating depths
tive sensors. Traditionally, the active sensors used for esti-   presented by Jupp (1988). Also, semi-analytical approaches
mating bathymetry are the echo sounders (Multi-Beam Echo         were implemented, using models and methods for retrieving
Sounders, Single-Beam Echo Sounders) or LIDAR devices            bathymetry data (Adler-Golden et al., 2005; Lee et al., 1999).
installed on vessels following a course along specially de-      Systematic errors are experienced by using the analytical and
signed sailing lines that have a specific geometry (Kearns

Published by Copernicus Publications on behalf of the European Geosciences Union.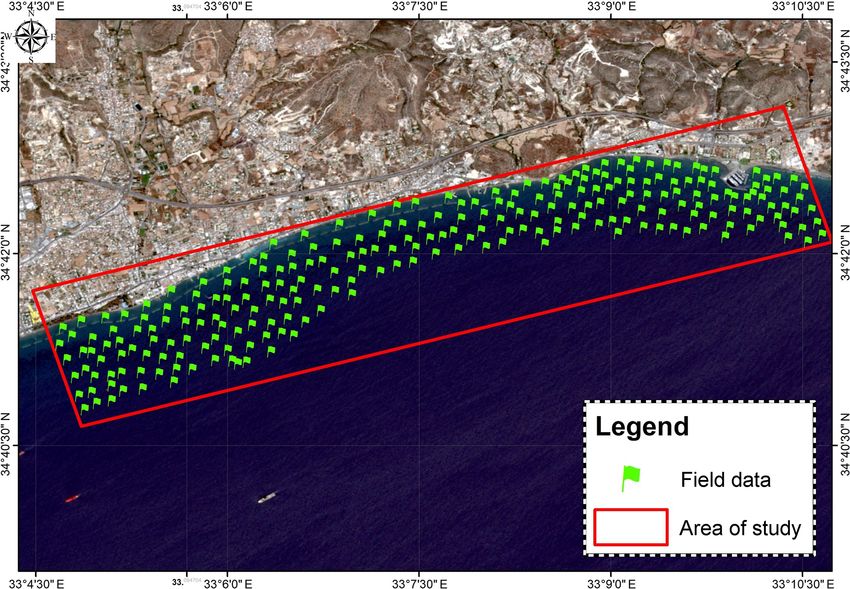
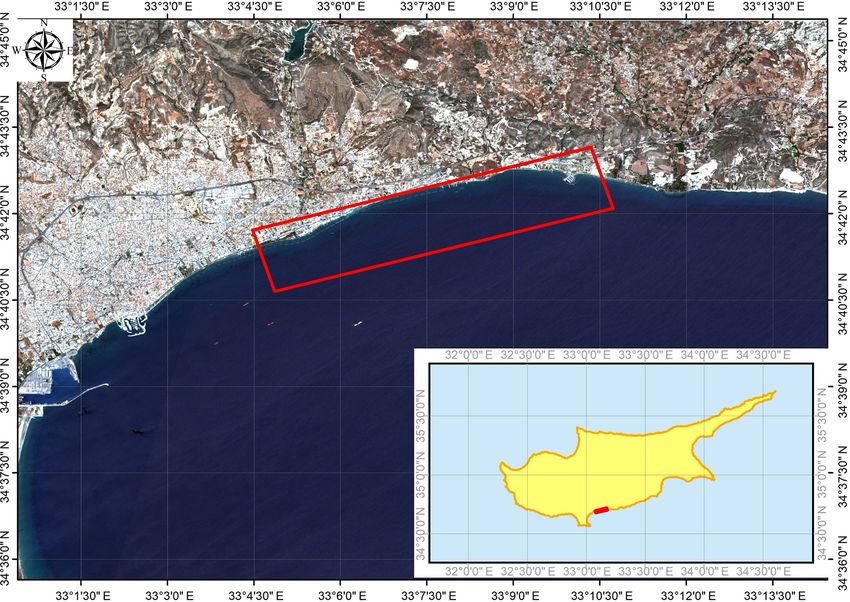
398                                  E. Evagorou et al.: Bathymetric maps from multi-temporal analysis of Sentinel-2 data

semi-analytical approaches on the coastal areas containing          accuracy was estimated to 1.89 and 2.04 m for months Febru-
seagrass because of the reflectance which is lower on the           ary and March respectively, using the ratio transform algo-
neighboring deep waters. This issue derives most probably           rithm.
from the shading which occurs within the canopy (Dekker                More, recently the benefits of the Sentinel-2 imageries us-
et al., 2007). Another method was implemented, named ra-            ing big data cloud platforms were presented by Traganos et
tio method, for the extraction of bathymetric data over clear       al. (2018). The Google Earth Engine, a cloud-based geospa-
shallow water (Stumpf et al., 2003), in which the authors ar-       tial computing platform, was used to acquire Sentinel-2 im-
gue that the ratio for two bands at the constant depth will be      ageries for the period between 1 August and 31 Decem-
the same, independently of the difference of bottom albedo,         ber 2016, in four different locations at the eastern Mediter-
and can be scaled with actual depths.                               ranean basin. Analytical and empirical methods were imple-
   Over the years, many researches used several optical             mented, including the pseudo-invariant features for normal-
satellite imageries to extract bathymetrical data. As, remote       isation and the median 3 × 3 filter to smooth the remaining
sensing technologies are continuously upgrading, they are           noise, hence increasing SDB accuracies. The best accuracy
also expanding the horizons of researchers in the field of          spotted using the analytical method had a R 2 of 0.90 and
bathymetry using high resolution satellite images (Said et          RMSE = 1.67 m.
al., 2017; Setiawan et al., 2013). These multispectral sensors,        Though these studies have shown the great potentials of
provide a wide range of wavelength bands which can be ap-           estimating bathymetry using freely and open source satellite
plied to these models, especially green and blue bands which        data such as Sentinel-2 images, there is still a research to
can penetrate up to 20 m underneath the sea surface in a clear      be performed regarding the identification of the best period
water condition (Sutanto, 1992).                                    throughout the year where bathymetric errors are minimized.
   Despite the medium spatial resolution, open and freely dis-      In addition, bathymetric studies based on optical sensors are
tributed data have also attracted the interest of researchers.      rare in the wider Eastern Mediterranean region and therefore
Indeed, during the years, different studies carried out to          extensive research will benefit in the future. Even though
estimate bathymetry using freely distributed medium res-            satellite remote sensing in this area was used in coastal
olution (30 m pixel size) Landsat-7 ETM+ and Landsat-               areas for several purposes such as in marine spatial plan-
8 LDCM satellites. The most common algorithms used in               ning, monitoring archaeological sites, quality of coastal wa-
these studies where the log linear (Lyzenga, 1978, 1980)            ter etc. (Agapiou et al., 2011; Hadjimitsis et al., 2010, 2013;
and the non-linear models (Stumpf et al., 2003). For in-            Papoutsa et al., 2011) no bathymetrical studies have been
stance the non-linear algorithm was applied to Landsat im-          made. Currently through an existing funded project named
ages in the area of the Dutch Wadden Sea (Ameland Inlet,            as “THAL-CHOR 2” (“2A3-XP 2” in Greek), bathymet-
Misra et al., 2018) with a coefficient of determination (R 2 ) of   ric maps are being developed through the use of the remote
0.85 and Root-Mean-Square Error (RMSE) 3.12 m; on Thou-             sensing which will be used for the implementation of marine
sand island (Pushparaj and Hegde, 2017) with R 2 = 0.90 and         spatial planning in Cyprus.
RMSE = 0.86 m for depths up to 10 m and at the coastal re-             For the framework of this study, optical Sentinel-2 satellite
gion of Dakshina Kanada in India, Kastela bay in the middle         data were used to extract bathymetric information in Cyprus.
Adriatic with R 2 of 0.90 (Setiawan et al., 2017).                  The present study is comprised of five parts. Further to the in-
   The exploitation of freely and open distributed datasets for     troduction, the datasets and methodology part follows, men-
bathymetric purposes has been supported by the new capabil-         tioning the field data of Multi-Beam Echo Sounders and
ities of the Sentinel-2 sensors, having a 10 m resolution. Re-      LIDAR instruments. Then, the empirical approach and the
cently, the log linear and non-linear methods were used for         methodology used in this study is described. The next part
mapping the bathymetry, on the South Baltic Sea (Chybicki,          concentrates the results of the applied methodology provid-
2017). In that study, satellite imageries from the Sentinel-2A      ing the correlation between observed depths and SDB depths,
sensor and soundings data were obtained by a single-beam            twelve bathymetric maps. Finally, the paper ends with a dis-
echo sounder and were used to estimate SDB. Afterwards,             cussion and the conclusions.
error distribution and quality coefficient were calculated to
describe the quality of the retrieved SDB. Further, the re-
trieved SDB was calibrated with the indicator of quality co-        2     Case study and datasets
efficient. In this way, more accurate results were retrieved
from SDB, proposing the implementation of this indicator            2.1    Study site
on mapping bathymetry using remote sensing. The best accu-
racy reported using the ratio transform algorithm method was        The study site is located south west of the city of Li-
with an R 2 = 0.91 and RMSE = 1.08 m. At the same time,             massol in Cyprus and it covers 19 km2 with a coast-
Kabiri (2017) used linear, non-linear methods for bathymet-         line that is about 9.6 km in length (Fig. 1). The site is
ric purposes on the Nayband bay, in Iran, using two Sentinel-       located between 34◦ 410 38.400 –34◦ 420 7.200 S and 33◦ 40 3000 –
2 satellite imageries of February and March 2017. The best          33◦ 100 44.400 E (WGS 84, 36N). On the coastlines of the study

Adv. Geosci., 45, 397–407, 2019                                                                www.adv-geosci.net/45/397/2019/
E. Evagorou et al.: Bathymetric maps from multi-temporal analysis of Sentinel-2 data                                        399

Figure 1. Location of study site in Cyprus.                     Figure 2. Field data acquired by the Department of Land Survey in
                                                                Cyprus.

area, the soft substrate with sandy beaches from shallow
                                                                2.3    LIDAR in-situ data
waters to a depth of twenty meters is gradually becoming
muddy (DoF, 2012). Also, breakwaters can be found on the        The in-situ data were collected and analyzed by the Depart-
coasts of Limassol at a distance of 120 m from the shore-       ment of Land Surveyors of Cyprus (DLS, 2014) – the offi-
line. Cyprus has an intense Mediterranean climate with hot      cial chartographic provider of the country – covering water
dry summers, rainy, rather changeable, winters and in au-       depths up to 50 m for an area of approximately 508 km2 . The
tumn and spring season the weather conditions are changing      data were acquired in two phases; the first phase was con-
rapidly. The winds usually are light to moderate and rarely     ducted in 2012 when the DLS launched process mapping of
unstable.                                                       the sea with multi-beam echo sounders using a conventional
                                                                vessel covering 238 km2 ; the second phase was conducted in
2.2   Sentinel-2 optical satellite data
                                                                2014 using the airborne LIDAR method covering 270 km2 .
In this study, Sentinel-2 imagery and field data were used to   The vertical accuracy as estimated by the DLS is ±0.5 m for
analyse and estimate bathymetry. Sentinel-2 mission is part     depths 0 to 20 m and ±1 m for up to 50 m. Consequently, for
of the European Space Agency (ESA) with high-resolution         this research, the DLS provided a set of 244 random control
with multi-spectral imagery. The current research aims to       points of 0 to 22 m depth which have been used for: (a) cal-
compare the estimated results of bathymetry for each month      ibrating the bathymetric results obtain from the multispec-
separately. Therefore twelve processed satellite images (one    tral imageries to absolute depths and (b) for training the ratio
for each month) were acquired through the Copernicus mi-        transform algorithm. Figure 2, shows the overall geographi-
nor site (ESA, 2013), covering a period from April 2017 to      cal distribution of the control points within the area of inter-
March 2018. Table 1 shows the details of acquired satel-        est.
lite image that were used. The acquired packages are of
Level 2A i.e. orthoimages and bottom of atmosphere cor-         3     Methodology
rected reflectance product. At this stage, the product was
processed on radiometric, geometric, cloud screening and        Several methods have been implemented for the estimation
atmospheric corrections. These multispectral images have        of the bathymetry using remote sensing. This research, gives
12 bands of spectral range at three different resolutions       emphasis in one of the most commonly used methods (ratio
(bands/resolution: b1 – Coastal aerosol/60 m , b2 – Blue/10     transform algorithm) for deriving depths using satellite im-
m, b3 – Green/10 m, b4 – Red/10 m, b5 – Vegetation Red          agery, (Stumpf et al., 2003). In this method, the approach of
Edge/20 m, b6 – Vegetation Red Edge/20 m, b7 – Vegeta-          Beer’s Law was accepted which considers that light attenu-
tion Red Edge/20 m, b8 – NIR/10 m, b8A – Vegetation Red         ation in the water column increases exponentially as depth
Edge/20 m, b9 – Water vapour/60 m, b10 – SWIR/60 m, b11         increases (Gao, 2009). The log transformation algorithm is
– SWIR/60 m, b12 – SWIR/60 m).                                  related to the natural logarithm for reflectance of two bands
                                                                and actual depths.
                                                                   Therefore, the bands used for estimating the bathymetry
                                                                are the blue (440–540 nm), green (500–600 nm), red (600–
                                                                700 nm) and near infrared (700–800 nm) bands. The pene-

www.adv-geosci.net/45/397/2019/                                                              Adv. Geosci., 45, 397–407, 2019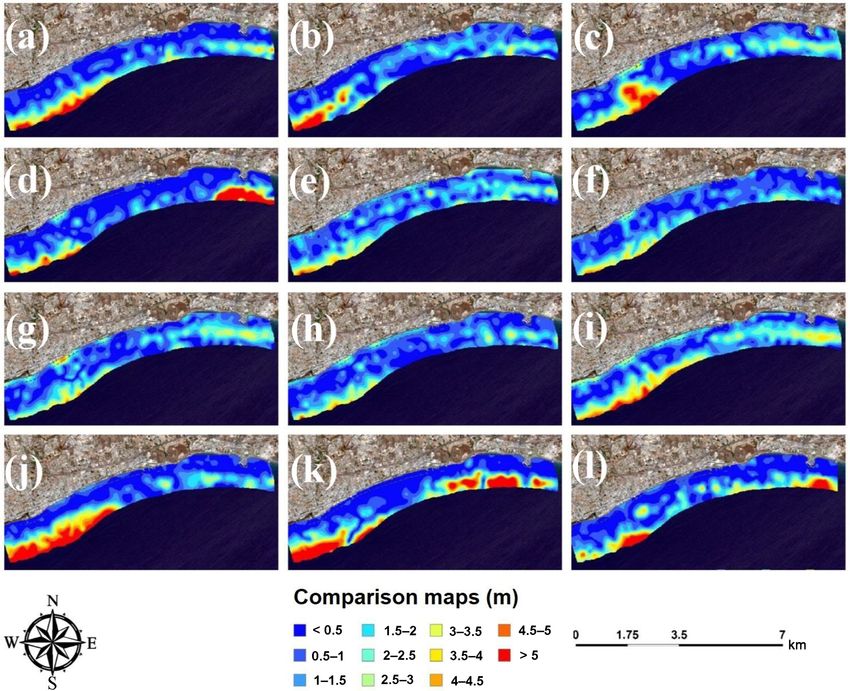
400 E. Evagorou et al.: Bathymetric maps from multi-temporal analysis of Sentinel-2 data
Table 1. Details for the processed Sentinel-2 imageries.
A/A Name Date Sensing Sun Zenith Sun Azimuth Cloud
Acquisition Time Angle (◦ ) Angle (◦ ) Coverage (%)
1 S2A_MSIL2A_20180119T083251_N0206_R021_T36SWD_20180119T121735 19/01/2018 08:32 57.93 158.93 3.98
2 S2A_MSIL2A_20180218T083011_N0206_R021_T36SWD_20180218T121430 18/02/2018 08:30 49.99 154.39 0.93
3 S2A_MSIL2A_20180320T082641_N0206_R021_T36SWD_20180320T103231 20/03/2018 08:26 38.78 150.17 56.91
4 S2A_MSIL2A_20170404T082601_N0204_R021_T36SWD_20170404T083829 04/04/2017 08:26 32.92 147.61 16.06
5 S2A_MSIL2A_20170504T083011_N0205_R021_T36SWD_20170504T083011 04/05/2017 08:30 23.25 139.60 4.18
6 S2A_MSIL2A_20170613T083011_N0205_R021_T36SWD_20170613T083147 13/06/2017 08:30 18.27 124.77 2.34
7 S2A_MSIL2A_20170713T082601_N0205_R021_T36SWD_20170713T083829 13/07/2017 08:26 20.22 125.24 0.97
8 S2A_MSIL2A_20170802T082601_N0205_R021_T36SWD_20170802T083801 02/08/2017 08:26 23.32 132.55 1.37
9 S2A_MSIL2A_20170901T083011_N0205_R021_T36SWD_20170901T083009 01/09/2017 08:30 30.49 146.91 2.49
10 S2A_MSIL2A_20171001T082741_N0205_R021_T36SWD_20171001T083943 01/10/2017 08:27 40.18 158.53 4.35
11 S2A_MSIL2A_20171110T083151_N0206_R021_T36SWD_20171110T121309 10/11/2017 08:32 53.27 165.36 2.18
12 S2A_MSIL2A_20171230T083341_N0206_R021_T36SWD_20171230T105851 30/12/2017 08:34 60.08 162.01 38.12
tration in the blue and green part of the spectrum is higher 4 Results
while the absorption of the electromagnetic radiation is in-
creasing as we move to the red part of the spectrum. The
Following the above methodology, twelve bathymetry maps,
ratio transform algorithm can be apply with bands having
one for each month, were estimated. The median filter has
different water absorption and can be applied in appropriate
been implemented to eliminate parameters of deterioration
wavelengths of any sensor. Since blue and green bands have
in estimating bathymetry such as turbidity, waves, sun glint
lower absorption, their ratio should remain the same despite
and sky glint. Following a time series regression analyses,
the different bottom albedos at a constant depth. The values
the RMSE and Mean Absolute Errors (MAE) have been cal-
of these bands were implemented on the following Eq. (1) to
culated.
estimate bathymetry.
ln R(λb)
Z = m1 − m0 (1) 4.1 Time series regression analyses of Bathymetrical
ln R(λg) data
where Z is the satellite derived bathymetry depth, m0 is the
offset for a depth of 0 m, m1 is a coefficient to tune the model In order to estimate the correspondence of the satellite bathy-
to the actual depth, and R(λb) and R(λj ) are the remote metric model with the Lidar datasets a regression analysis
sensing radiances for optical bands λb (blue band) and λg has been performed for each monthly DTM using the lin-
(green). For this model, the bottom depth is estimated on the ear model. The overall results are found in Fig. 4. Twelve
basis of light attenuation phenomena, as the attenuation of scatterplots have been designed with the x-axis representing
the incoming shortwave radiation varies spectrally. the LIDAR points, while the y-axis represented the estimated
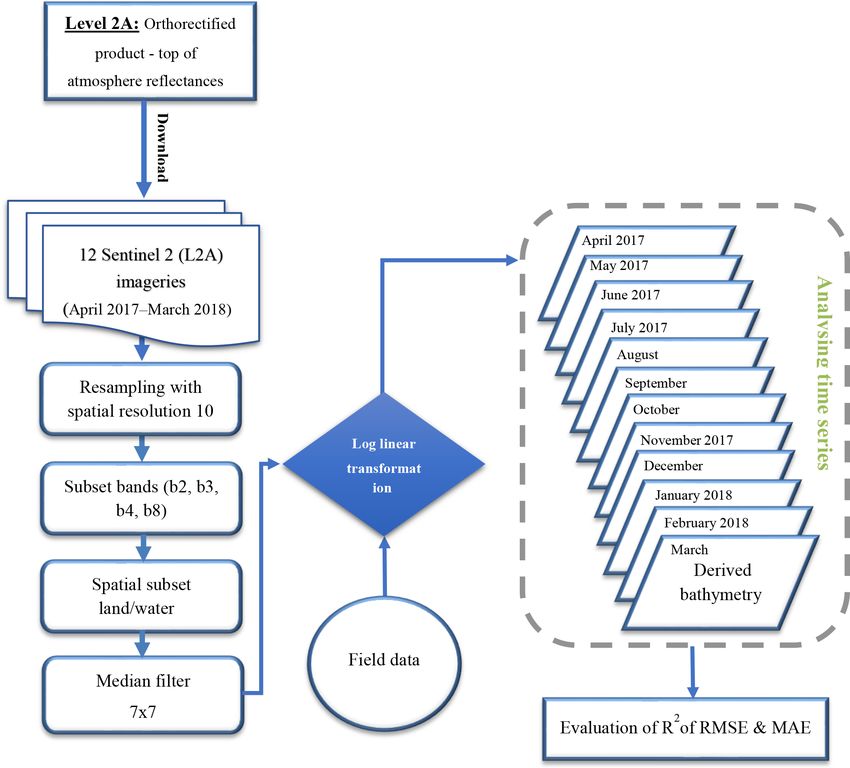
The ratio transform algorithm was implemented to the bathymetry points derived from the Sentinel-2 images. Based
multispectral imageries listed in Table 1. Initially the mul- on the linear regression analysis the R 2 coefficient was also
tispectral images were resampled by a referenced band with estimated for each case. According to the results, strong cor-
a 10 m spatial resolution, using the SNAP software. Upon relation is observed in shallow waters (less than 12 m) com-
the selection of the area of interest, the ArcGIS software was pared to deeper areas (more than 12 m) . Scatterplots of Jan-
used where the shapefile was created and uploaded on the uary and February show that R 2 is relatively high up to 0.90
SNAP software to mask satellite imageries. Following, each while R 2 for the next couple of months is estimated to be
one of the masked imageries classified the blue, green, red between 0.85 and 0.88. During summer season R 2 value is
and near infrared band and then separated land and water. increased while June provides the best linear fit with a value
After the pre-processing of satellite data, the processed prod- of 0.95. Lastly, the R 2 value for autumn, seems to have a
uct was uploaded on the ENVI 5.3 software for estimating downward trend and is the same with winter’s one. The scat-
the bathymetry using the log transformation algorithm. The tering starts from 12 m depth, as also clearly showed for the
median filter, a nonlinear digital filtering technique, used for analysis during November. This is reflected to the R 2 value
removing the noise from images, was applied to this study. which is equal to the 0.81 and it is the less precise value from
A median filter of 7 × 7 was used to succeed the reduction the results.
of the noise of high frequency. The following figure (Fig. 3), In order to compare the accuracy of the time series ex-
shows the processing steps for deriving bathymetry on the tracted results, two statistical parameters were taken into
study area. consideration along with correlation coefficient R 2 , RMSE
and MAE. The equations for the estimation are given in the
Adv. Geosci., 45, 397–407, 2019 www.adv-geosci.net/45/397/2019/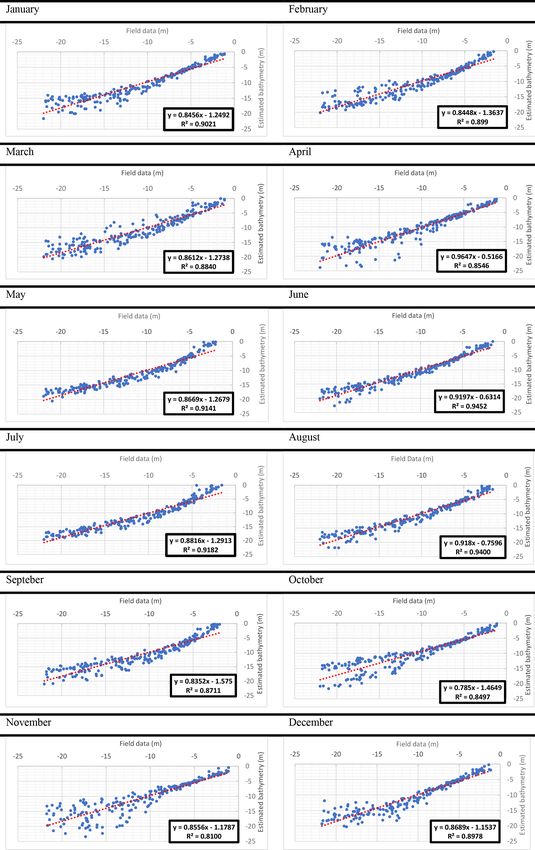
E. Evagorou et al.: Bathymetric maps from multi-temporal analysis of Sentinel-2 data                                                401

Figure 3. Workflow processing steps detecting bathymetry from Sentinel-2 (L2A) satellites images.

following equations:                                                  Table 2. R 2 , RMSE and MAE of the estimated depths.
           1
       1X                                                                 Period         R2    Root-mean-square     Mean absolute
RMSE =        |ZSDB − ZFB |                                   (2)
       n J =1                                                                                   error (RMSE) m     error (MAE) m
      v
      u 1
      u1 X                                                                January       0.90                1.91             1.30
MAE = t        (ZSDB − ZFB )2                                 (3)         February      0.90                1.90             1.33
        n J =1                                                            March         0.88                2.01             1.33
                                                                          April         0.85                2.35             1.37
where n is the number the field points, ZSDB is the satellite             May           0.91                1.70             1.37
derived bathymetry depth and ZFB is the field points depth.               June          0.95                1.39             1.05
   The overall results regarding the RMSE and MAE errors                  July          0.92                1.64             1.32
are shown on Table 2. As resulted from the table below,                   August        0.94                1.43             1.09
the best results were the ones derived for month June where               September     0.87                2.07             1.66
the bathymetry resulted with RMSE to be 1.39 m and MAE                    October       0.85                2.46             1.61
1.05 m. On the other hand, the less precise results having a              November      0.81                2.56             1.64
                                                                          December      0.90                1.86             1.19
RMSE of 2.56 m and a MAE of 1.64 m seem to be for month
November.

4.2   Results of bathymetrical data
                                                                      period November December encountered error in the South-
This section demonstrates and compares the various SDB                East. These errors are probably related to cloud coverage of
maps produced from the Sentinel-2 images with the LIDAR               the satellite images.
datasets. Figure 5 below, shows the bathymetrical results of             As it can be seen from the presentation of the results, the
the study area for each month. Overall, the best accuracy is          period used for estimating bathymetry effects the overall per-
evident during the summer period with RMSE of 1.39 m and              formance of the results. The records provided by the DLS
MAE of 1.05 m while the autumn period gives the lowest                have a 5-year difference from the downloading of the satellite
precision with RMSE of 2.56 m and MAE of 1.64 m. The lat-             images which is considered to be a very long timeframe, thus
est may be due to bad weather conditions and the sea state.           data have limitations on the accuracy. In order to compare the
It is worth noted that bathymetric maps obtained during the           estimated bathymetry with the in situ data, comparison maps

www.adv-geosci.net/45/397/2019/                                                                     Adv. Geosci., 45, 397–407, 2019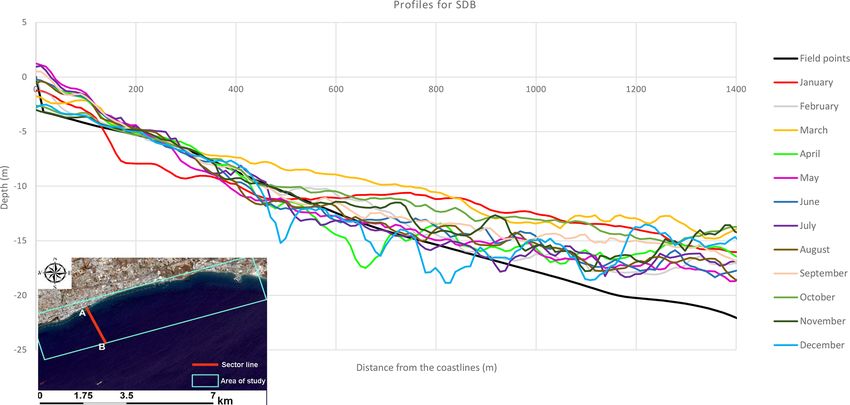
402                                 E. Evagorou et al.: Bathymetric maps from multi-temporal analysis of Sentinel-2 data

Figure 4. Correlation between observed depths and SDB depths obtained for each month.

Adv. Geosci., 45, 397–407, 2019                                                         www.adv-geosci.net/45/397/2019/
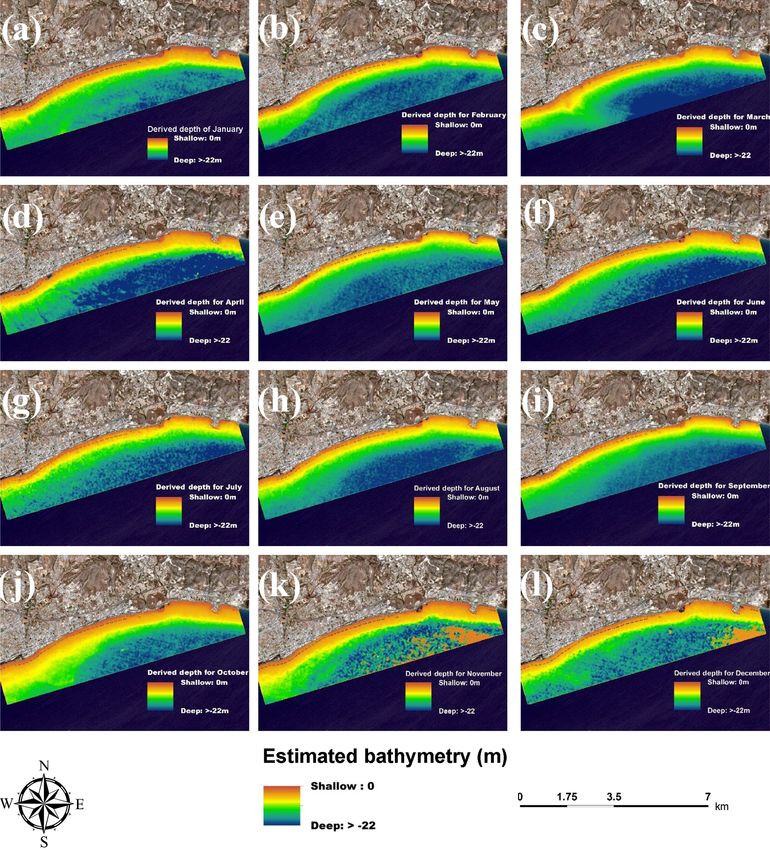
E. Evagorou et al.: Bathymetric maps from multi-temporal analysis of Sentinel-2 data                                                  403

Figure 5. Predicting and mapping SDB with ranges 0 to −22 m depth, for the months (a) January, (b) February, (c) March, (d) April, (e) May,
(f) June, (g) July, (h) August, (i) September, (j) October, (k) November , (l) December.

between the bathymetric satellite DTMs and LIDAR DTMs                   area. Bathymetrical profile lines of each month were used
were created and can been seen on Fig. 6.                               in order to interpolate the bathymetrical data. Besides, an-
   Based on these findings it is evident that during winter and         other profile was created, which is based on the LIDAR con-
autumn periods errors can be more than 5 m. Higher errors               trol points in order to be compared with those of SDB. The
of more than 4 m are reported in deeper waters for all sea-             above described method was followed with the use of Ar-
sons with the exception of the summer season. In shallow                cGIS v10.2 Software for the analysis of the diagrams which
waters the same performance despite the period selected was             have been exported by the software, the user has resulted to
observed. In addition, in sea areas with breakwaters the dif-           the diagram depicted in Fig. 7
ferences range from 1 up to 2.5 m.                                         A very good correlation between the profiles is percep-
   Bathymetrical profiles were also created in areas that               tible to Fig. 7. For a horizontal distance from the coastline
showed frequently encountered errors. Optically observing               up to 200 m with depths of 5 m, a noise was observed be-
the maps with the errors’ allocation, it can be pointed out that        tween SDB and the interpolated bathymetry from the field
there are more frequent errors in the southwest of the study            points. This might be due to the wave collapse on the shore-

www.adv-geosci.net/45/397/2019/                                                                       Adv. Geosci., 45, 397–407, 2019
404                                  E. Evagorou et al.: Bathymetric maps from multi-temporal analysis of Sentinel-2 data

Figure 6. Comparison maps of the estimated bathymetry and in situ data for the months: (a) January, (b) February, (c) March, (d) April,
(e) May, (f) June, (g) July, (h) August, (i) September, (j) October, (k) November , (l) December.

Figure 7. Sector profiles of SDB.

line and the breakwaters which are located 120 m from the             800 m seems to be good except from the months of March,
shoreline. On the other hand, on the coastal distance of 200 to       April and December. Lastly, the distance ranging from 800–
400 m in the area with depth of 5–10 m seems to be well cor-          1200 m with 20 m depth has a gradual upward shift of from
related except the month of January. Moreover, the correla-           the fields’ points’ surface. This might be due to the attenua-
tion of the bathymetric data with distance ranging from 400–          tion of the light as it passes through the water column and the

Adv. Geosci., 45, 397–407, 2019                                                                  www.adv-geosci.net/45/397/2019/
E. Evagorou et al.: Bathymetric maps from multi-temporal analysis of Sentinel-2 data                                             405

deterioration of solar radiation at various depths in the water.   teristics. It is therefore important to analyse an optical satel-
Another reason could be the time difference between satellite      lite image with the best possible conditions (cloud coverage,
images and field points.                                           waves, turbidity etc.). For this reason, the study was focused
                                                                   to the identification of the best period for the estimation of
                                                                   the bathymetry following a multi-temporal approach.
5   Discussion                                                        Therefore, the study was focused on the analysis of the
                                                                   multi-temporal Sentinel-2 satellite imageries in different pe-
On the current study, twelve images, one for each month,
                                                                   riods using the empirical method ratio transform algorithm.
have been used for estimating the bathymetry in the south
                                                                   The bathymetrical data were extracted using SDB and statis-
area of Cyprus. During the analysis, the overall results indi-
                                                                   tically analyzed for one year. The overall results show that
cate an error ranging from 1.39 up to 2.56 m. Comparing the
                                                                   the bathymetry accuracy tends to fluctuate from period to pe-
bathymetric data, it is evident, summer months provide the
                                                                   riod significantly and therefore this should be taken into con-
best results. Indeed, the best accuracy of bathymetry data is
                                                                   sideration in combination with the weather conditions. The
found in Sentinel image acquired on June with a R 2 = 0.94,
                                                                   latest is due to the fact that turbidity and waves affect the at-
RMSE = 1.39 m and MAE = 1.05 m. Also, a good correla-
                                                                   tenuation of the light observed during bad weather conditions
tion between the bathymetric maps of May’s to Augusts’
                                                                   and strong winds.
(Fig. 5) with accuracies of the RMSE ranging from 1.39 to
                                                                      For the purpose of improving the current study, a compar-
1.70 m was observed. In contrast errors of more than 5 m dur-
                                                                   ison timeseries analysis exploiting ESA’s Sentinel Scientific
ing the autumn and winter months, especially in October and
                                                                   Data hub will be performed in the near future. Based on the
November have been reported in deeper waters. The accu-
                                                                   given high temporal resolution of Sentinel-L2A-B sensors, a
racy of the study is considered acceptable, compared to other
                                                                   multitemporal analysis during the summer season (optimum
studies using the same method and satellite imageries such
                                                                   period for bathymetric purposes as evidence in this paper)
as those of Chybicki (2017), Kabiri (2017) and Traganos and
                                                                   will be investigated by authors in the near future. The pur-
Reinartz (2017). The correlation between situ data and pre-
                                                                   pose of that study is to identify fluctuations within a specific
dicted depths, is not the ideal and this may be due the limita-
                                                                   season (i.e. summer), following other methods as well, aim-
tions of accuracy that have LIDAR data. Also, a gradual in-
                                                                   ing to minimize even more the errors and produce more accu-
crease in the accuracy of the results was noted in the months
                                                                   rate bathymetric maps. In addition, this will allow isolate the
of June and December, months of the winter and summer
                                                                   optimum window for exploiting the free and open satellite
solstice.
                                                                   data.
   An overall analysis indicates high accuracy of the esti-
mated depths in shallow waters which then reduces in deeper
waters. Studying the bathymetrical profiles shows a good           Data availability. The original field data presented in the paper
correlation between the observed and extracted depths from 5       are available by contacting the Department of Land Surveyors of
to 12 m while there were deviations in deep waters. The cor-       Cyprus. The original data underlying the satellite imageries are
relation between the in situ data and results can be found in      available in the Copernicus minor site.
other studies that show better results in shallow waters (Ehses
and Rooney, 2015; Pushparaj and Hegde, 2017).
   Further to this study, comparison maps were created. The        Author contributions. EE, designed the entire project, wrote the
outcome of the maps shows the difference between the es-           main content and analyzed the data. CM, AA, KT and DH worked
timated bathymetry with the in-situ data. These comparison         for the structure, proofreading and commenting of this paper.
maps show good correlation to the shallow waters, with the
differences ranging from 0.5 to 1.5 m. It is also worth to no-
tice that breakwaters in the study area might have deterio-        Competing interests. The authors declare that they have no conflict
rated the results as shown in the comparison maps.                 of interest.

6   Conclusions                                                    Special issue statement. This article is part of the special issue
                                                                   “Earth surveillance and space-based monitoring of the environment:
Bathymetry is an important factor for several applications         integrated approaches”. It is a result of the EGU General Assembly
such as navigation, marine environmental protection, coastal       2018, Vienna, Austria, 8–13 April 2018.
engineering etc. During the last years many studies imple-
mented SDB using empirical, analytical and semi-analytical
approaches, aiming to investigate the potential use of opti-       Acknowledgements. This research was supported by project enti-
cal satellite datasets. A critical aspect highlighted on most of   tled: “Cross-Border Cooperation for Implementation of Maritime
these studies refers to the atmospheric and sea conditions of      Spatial Planning” referred as “THAL-CHOR 2” (“2A3-XP 2”
                                                                   in Greek) and is co-funded by the European Regional Development
the area including water column and bottom material charac-

www.adv-geosci.net/45/397/2019/                                                                  Adv. Geosci., 45, 397–407, 2019
406 E. Evagorou et al.: Bathymetric maps from multi-temporal analysis of Sentinel-2 data
Fund (ERDF), under the Cross-Border Cooperation Programme and monitoring of inland water bodies, Phys. Chem. Earth, 35,
“INTERREG V-A Greece-Cyprus 2014–2020”. Thanks, are given 115–120, https://doi.org/10.1016/J.PCE.2010.03.033, 2010.
to the Remote Sensing and Geo-Environment Lab, of the Cyprus Irish, J. L. and Lillycrop, W. J.: Scanning laser mapping of the
University of Technology. Also, acknowledgements are given to coastal zone: the SHOALS system, ISPRS J. Photogramm.
Department of the Land Survey of Cyprus, for providing soundings Remote Sens., 54, 123–129, https://doi.org/10.1016/S0924-
of bathymetry. Sentinel-2A imagery was acquired for the ESA’s 2716(99)00003-9, 1999.
Sentinel Scientific Data hub. Jupp, D.: Background and Extensions to Depth of Penetration
(DOP) Mapping in Shallow Coastal Waters, Proceeding Symp.
Edited by: Silas Michaelides Remote Sens. Coast. Zo. Queensl., available at: https://ci.nii.ac.
Reviewed by: three anonymous referees jp/naid/10003995403/ (last access: 5 December 2018), 1988.
Kabiri, K.: Discovering optimum method to extract depth
information for nearshore coastal waters from sentinel-
2a imagery-case study: nayband bay, iran, ISPRS – Int.
References Arch. Photogramm. Remote Sens. Spat. Inf. Sci., XLII-
4/W4, 105–110, https://doi.org/10.5194/isprs-archives-XLII-4-
Adler-Golden, S. M., Acharya, P. K., Berk, A., Matthew, M. W., W4-105-2017, 2017.
and Gorodetzky, D.: Remote bathymetry of the littoral zone from Kearns, T. A. and Breman, J.: Bathymetry-the art and science of
AVIRIS, LASH, and QuickBird imagery, Trans. Geosci. Remote seafloor modeling for modern applications, in: Ocean globe, 1–
Sens., 43, 337–347, https://doi.org/10.1109/TGRS.2004.841246, 37, available at: http://visualsoundings.org/wp-content/uploads/
2005. 2017/02/ocean_globe.pdf (last access: 6 December 2018), 2010.
Agapiou, A., Hadjimitsis, D. G., Papoutsa, C., Alexakis, D. D., and Lee, Z., Carder, K. L., Mobley, C. D., Steward, R. G., and Patch,
Papadavid, G.: The Importance of Accounting for Atmospheric J. S.: Hyperspectral remote sensing for shallow waters: 2. De-
Effects in the Application of NDVI and Interpretation of Satellite riving bottom depths and water properties by optimization,
Imagery Supporting Archaeological Research: The Case Studies available at: https://www.osapublishing.org/ao/abstract.cfm?uri=
of Palaepaphos and Nea Paphos Sites in Cyprus, Remote Sens., ao-38-18-3831 (last access: 4 December 2018), 1999.
3, 2605–2629, https://doi.org/10.3390/rs3122605, 2011. Lyzenga, D.: Remote sensing of bottom reflectance and water at-
Chybicki, A.: Mapping South Baltic Near-Shore Bathymetry Us- tenuation parameters in shallow water using aircraft and Landsat
ing Sentinel-2 Observations, Polish Marit. Res., 24, 15–25, data Remote sensing of bottom reflectance and water attenuation
https://doi.org/10.1515/pomr-2017-0086, 2017. parameters in shallow water using air, Int. J. Remote Sens., 2,
Conger, C. L., Hochberg, E. J., Fletcher, C. H., and Atkinson, M. 71–82, https://doi.org/10.1080/01431168108948342, 1980.
J.: Decorrelating remote sensing color bands from bathymetry Lyzenga, D. R.: Passive remote sensing techniques for mapping
in optically shallow waters, IEEE T. Geosci. Remote, 44, 1655– water depth and bottom features, Appl. Opt., 17, 379–383,
1660, https://doi.org/10.1109/TGRS.2006.870405, 2006. https://doi.org/10.1364/AO.17.000379, 1978.
Dekker, A., Brando, V., Anstee, J., Fyfe, S., Malthus, T., and Kar- Lyzenga, D. R., Malinas, N. P., and Tanis, F. J.: Mul-
pouzli, E.: Remote Sensing of Seagrass Ecosystems: Use of tispectral bathymetry using a simple physically based
Spaceborne and Airborne Sensors, in Seagrasses: Biology, Ecol- algorithm, IEEE T. Geosci. Remote, 44, 2251–2259,
ogy and Conservation, pp. 347–359, Springer Netherlands, Dor- https://doi.org/10.1109/TGRS.2006.872909, 2006.
drecht, 2007. Maritorena, S., Morel, A., and Gentili, B.: Diffuse reflectance
DLS: Data from Department of Land Surveyors, Dep. L. of oceanic shallow waters: Influence of water depth
Surv., available at: http://portal.dls.moi.gov.cy/en-us/Pages/ and bottom albedo, Limnol. Oceanogr., 39, 1689–1703,
The-Department-of-Lands-and-Surveys-Web-Portal.aspx (last https://doi.org/10.4319/lo.1994.39.7.1689, 1994.
access: 17 May 2018), 2014. McCaffrey, E.: A review of the bathymetric swath survey sys-
DoF: Department of Fisheries and Marine Research: Initial Assess- tem, International Hydrographic Bureau, available at: https://
ment of the Marine Environment of Cyprus, Part I – Characteris- journals.lib.unb.ca/index.php/ihr/article/view/23587/27360 (last
tics Nicosia, Nicosia, 2012. access: 24 July 2018), 1981.
Ehses, J. S. and Rooney, J. J.: Depth Derivation Using Multispectral Misra, A., Vojinovic, Z., Ramakrishnan, B., Luijendijk, A.,
WorldView-2 Satellite Imagery, NOAA Tech. Memo. NMFS- and Ranasinghe, R.: Shallow water bathymetry mapping us-
PIFSC-46, (June), 24, https://doi.org/10.7289/V5668B40, 2015. ing Support Vector Machine (SVM) technique and mul-
ESA: SENTINEL-2 User Handbook, 1st Edm., available at: tispectral imagery, Int. J. Remote Sens., 39, 4431–4450,
https://earth.esa.int/documents/247904/685211/Sentinel-2_ https://doi.org/10.1080/01431161.2017.1421796, 2018.
User_Handbook (last access: 24 July 2018), 2013. Muirhead, K. and Cracknell, A. P.: Airborne li-
Gao, J.: Bathymetric mapping by means of remote sensing: meth- dar bathymetry, Int. J. Remote Sens., 7, 597–614,
ods, accuracy and limitations, Prog. Phys. Geogr., 33, 103–116, https://doi.org/10.1080/01431168608954714, 1986.
https://doi.org/10.1177/0309133309105657, 2009. Ogawa, H., Oyakawa, K., Kawai, K., Ozawa, H., Yajima,
Hadjimitsis, D., Agapiou, A., Alexakis, D., and Sarris, A.: Explor- H., Shirane, H., Yamano, H., Hirata, N., Iwamoto, N.,
ing natural and anthropogenic risk for cultural heritage in Cyprus Ono, T., Tomizawa, S., Matsumoto, Y. and Yamakawa,
using remote sensing and GIS, Int. J. Digit. Earth, 6, 115–142, S.: Airborne lidar bathymetry, International Hydrographic
https://doi.org/10.1080/17538947.2011.602119, 2013. Bureau, available at: https://journals.lib.unb.ca/index.php/ihr/
Hadjimitsis, D. G., Hadjimitsis, M. G., Toulios, L., and Clayton, C.:
Use of space technology for assisting water quality assessment
Adv. Geosci., 45, 397–407, 2019 www.adv-geosci.net/45/397/2019/E. Evagorou et al.: Bathymetric maps from multi-temporal analysis of Sentinel-2 data 407 article/view/26300/1882519053 (last access: 24 July 2018), Setiawan, I. E., Yuwono, D. M., Siregar, V. P., and Pra- 2017. mono, G. H.: The Study of Sea Bottom Morphol- Papoutsa, C., Hadjimitsis, D. G., and Alexakis, D. D.: Coastal wa- ogy and Bathymetric Mapping Using Worldview-2 Im- ter quality near to desalination project in Cyprus using Earth ob- agery, in: Seminar Proceeding, 143–149, available at: servation, International Society for Optics and Photonics 8181, https://repository.ipb.ac.id/jspui/bitstream/123456789/65453/1/ Earth Resources and Environmental Remote Sensing/GIS Appli- Iwan E. Setiawan %2C vincentius siregar.pdf, 2013. cations II, p. 81810T, https://doi.org/10.1117/12.898361, 2011. Setiawan, K. T., Adawiah, S. W., Marini, Y., and Winarso, Philpot, W. D.: Bathymetric mapping with passive G.: Bathymetry Data Extraction Analysis Using Landsat multispectral imagery, Appl. Opt., 28, 1569–1578, 8 Data, Int. J. Remote Sens. Earth Sci., 13, 79–86, https://doi.org/10.1364/AO.28.001569, 1989. https://doi.org/10.30536/j.ijreses.2016.v13.a2448, 2017. Pushparaj, J. and Hegde, A. V.: Estimation of bathymetry along the Stumpf, R. P., Holderied, K., and Sinclair, M.: Determina- coast of Mangaluru using Landsat-8 imagery, Int. J. Ocean Clim. tion of water depth with high-resolution satellite imagery Syst., 8, 71–83, https://doi.org/10.1177/1759313116679672, over variable bottom types, Limnol. Oceanogr., 48, 547–556, 2017. https://doi.org/10.4319/lo.2003.48.1_part_2.0547, 2003. Said, N. M., Mahmud, R., and Hasan, R. C.: Satellite-derived Sutanto: Penginderaan Jauh Jilid 2, Gadjah Mada Press, Yo- bathymetry: accuracy assessment on depths derivation al- gyakarta, 1992. gorithm for shallow water area, ISPRS – Int. Arch. Pho- Traganos, D. and Reinartz, P.: Mapping Mediterranean seagrasses togramm. Remote Sens. Spat. Inf. Sci., XLII-4/W5, 159–164, with Sentinel-2 imagery, Mar. Pollut. Bull., 134, 197–209, https://doi.org/10.5194/isprs-archives-XLII-4-W5-159-2017, https://doi.org/10.1016/j.marpolbul.2017.06.075, 2017. 2017. Traganos, D., Poursanidis, D., Aggarwal, B., Chrysoulakis, N., Sánchez-Carnero, N., Aceña, S., Rodríguez-Pérez, D., Couñago, and Reinartz, P.: Estimating Satellite-Derived Bathymetry (SDB) E., Fraile, P., and Freire, J.: Fast and low-cost method for VBES with the Google Earth Engine and Sentinel-2, Remote Sens., 10, bathymetry generation in coastal areas, Estuar. Coast. Shelf Sci., 859, https://doi.org/10.3390/rs10060859, 2018. 114, 175–182, https://doi.org/10.1016/J.ECSS.2012.08.018, 2012. www.adv-geosci.net/45/397/2019/ Adv. Geosci., 45, 397–407, 2019
You can also read