Tectonic evolution in the Wadi Araba Segment of the Dead Sea Rift, South-West Jordan
←
→
Page content transcription
If your browser does not render page correctly, please read the page content below
EGU Stephan Mueller Special Publication Series, 2, 63–81, 2002
c European Geosciences Union 2002

Tectonic evolution in the Wadi Araba Segment of the Dead Sea Rift,
South-West Jordan
U. Zain Eldeen1 , D. Delvaux2 , and P. Jacobs3
1 Department   of Geology, Al Azhar University of Gaza, P.O. Box 1277, Gaza, Palestine
2 Department   of Geology and Mineralogy, Royal Museum for Central Africa, Leuvensesteenweg 13, B-3080 Tervuren,
Belgium
3 Department of Geology and Soil Science, Ghent University, Krijgslaan 281/S8, B-9000 Gent, Belgium

Received: 27 November 2000 – Revised: 29 January 2002 – Accepted: 1 February 2002

Abstract. This work presents the first palaeostress results      the Taurus – Zagros mountains (Fig. 1). In terms of plate
obtained from fault-slip data along the eastern margins of       tectonics it is considered to be a plate boundary between the
the Dead Sea Rift (also named Dead Sea Transform) in             Arabian plate in the east and the Israel-Sinai sub-plate (part
South-western Jordan. Stress inversion of the fault-slip data    of the African plate) in the west.
was performed using an improved Right-Dieder method, fol-           The Dead Sea Rift is the major tectonic feature controlling
lowed by rotational optimisation. Fault-slip data (totalling     the stratigraphic and structural evolution of the region since
2773) include fault planes, striations and sense of move-        the Miocene. The structure and the deformation of the region
ments, obtained from outcrops ranging in age from Neopro-        have been the focus of many discussions and interpretations.
terozoic crystalline basement to Holocene sediments. The         Although the tectonic deformation of the region has been at-
data were inverted to determine 88 different palaeostress ten-   tributed to N-S relative motion along the Dead Sea Rift (e.g.
sors. Eight palaeostress tensor groups (stages) have been        Quennel, 1959; Freund, 1965), there are three schools of
identified, ranging from the Late Neoproterozoic to the          thought on the nature of movement along the Dead Sea Rift.
Holocene period, and have been correlated with the tectonic      Von Buch (1841) interpreted the Dead Sea Rift as a result of
evolution of the Dead Sea Rift.                                  normal faulting. Picard (1943, 1965 and 1987), Bentor and
   The new palaeostress data evidence a general clockwise        Vorman (1954), Bender (1970 and 1975) and Michelson et
rotation with time of the SHmax axis from an E-W trend in        al. (1987) supported this interpretation. Lartet (1869) inter-
the Cretaceous to a N-S trend in the Pleistocene. Two stages     preted the movement along the Dead Sea Rift to be strike-slip
can be distinguished in this rotation. The older one marks       as the major movement and normal as a minor one. This in-
the change of the SHmax axis from E-W to NW- SE (about           terpretation was subsequently supported by Quennel (1956
50◦ rotation), and took place in the Miocene. The second         and 1959), Freund (1965), Zak and Freund (1966 and 1981),
one illustrates the changes of the SHmax axis from NW-SE         Freund et al. (1968 and 1970), Neev (1975), Bartov et al.
to NNW-SSE to N-S (38◦ rotation), taking place during the        (1980), Garfunkel (1981) and Garfunkel et al. (1981). Others
Pleistocene (the last 6 Ma). The data also show the appear-      (Vorman, 1961; Michelson, 1982; Bahat and Rabinovitch,
ance of E-W extension in the Late Pleistocene, superimposed      1983) claim that the rift evolved as a combination of vertical
on the Dead Sea Stress Field. We therefore suggest that the      (dip-slip) and horizontal (left-lateral) movement.
Dead Sea Rift system formed in a combination of strike-slip         Because of its key position in the geology of the region, the
and dip-slip movements.                                          Dead Sea Rift region and its margins have been the subject of
                                                                 many detailed mapping and regional structural studies (e.g.
                                                                 Picard, 1943; Bentor and Vorman, 1954; Quennel, 1959; De
1 Introduction                                                   Sitter, 1962; Freund, 1965, 1970; Bender, 1968; Garfunkel,
                                                                 1970, 1981; Bartov, 1974; Garfunkel and Bartov, 1977; Eyal
The Dead Sea Rift, also named Dead Sea Transform, is a           et al., 1981; Reches et al., 1981). Comprehensive structural
1100 km long sinistral fault system that connects the Gulf       studies were based on small-scale structures (e.g. Letouzey
of Suez – Red Sea spreading system to convergence zone in        and Tremolières, 1980; Reches et al., 1981; Eyal and Reches,
                                                                 1983; Ron and Eyal, 1985) and on focal plane solutions of
Correspondence to: U. Zain Eldeen                                earthquakes (e.g. Ben Menahem et al., 1976; Badawy and
(http://usama zaineldeen@hotmail.com)                            Horvath, 1999).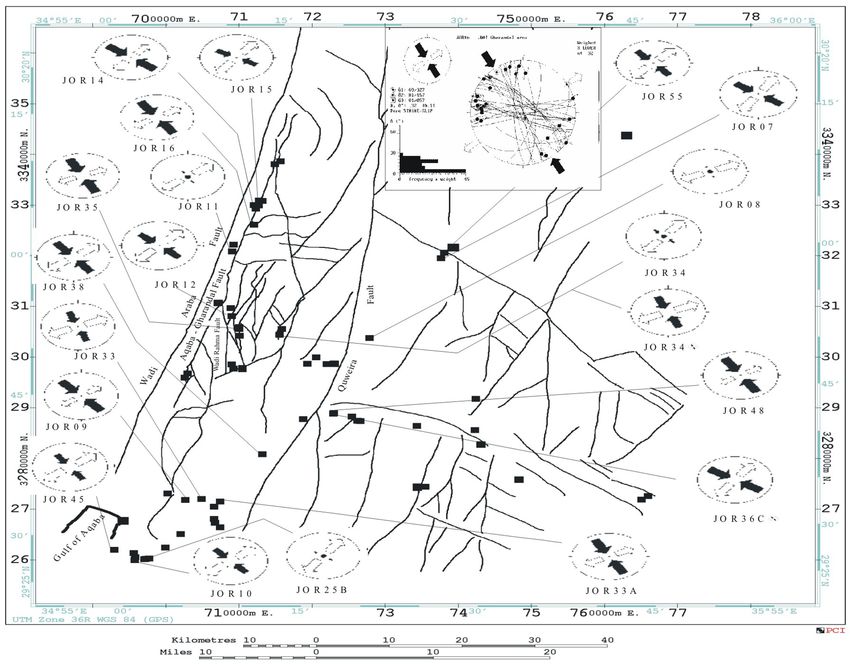
64 U. Zain Eldeen et al.: Tectonic evolution in the Wadi Araba Segment of the Dead Sea Rift
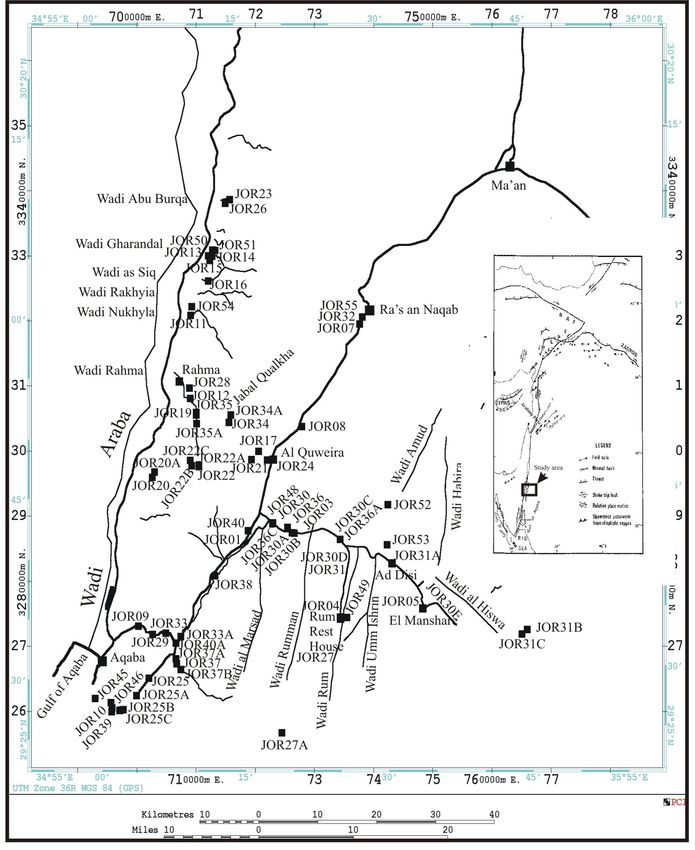
Fig. 1. Location of the established stations in the study area. Inset: location map of the study area.
2 Aim of the study the Dead Sea Rift;
The controversy on the mechanics and origin of the Dead Sea 3. compare the palaeostress results of the study area with
Rift led us to conduct research in the southern segment of the those of the western margin of the rift;
Dead Sea Rift, on the eastern flank of southern Wadi Araba
Fault in South-west Jordan. The aims of the study were to:
4. determine the structural effects of the rift formation in
1. measure and analyse the structural data from the field to the study area;
obtain the palaeostress tensors;
5. discuss the implication of our results on the origin of the
2. construct the kinematics and palaeostress evolution of Dead Sea Rift.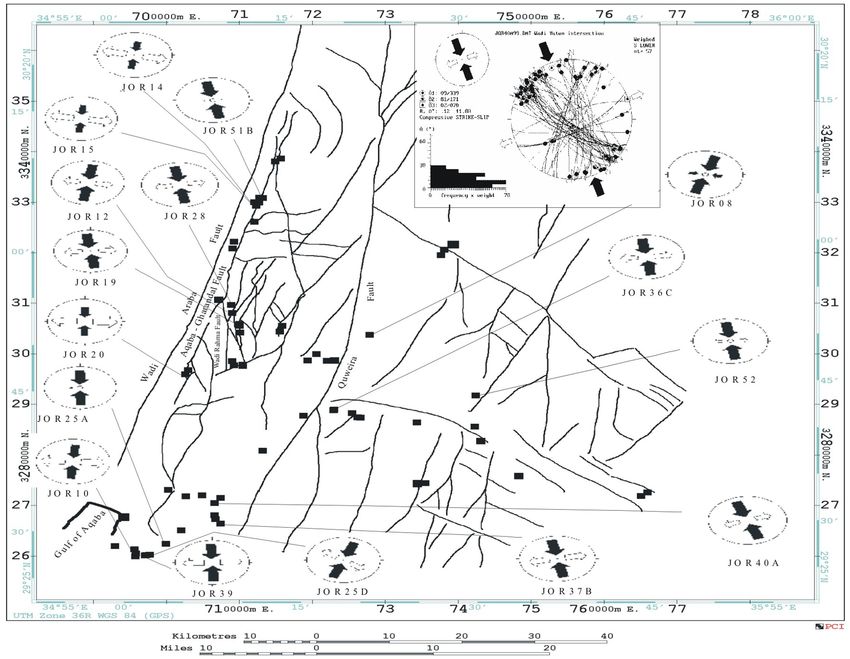
U. Zain Eldeen et al.: Tectonic evolution in the Wadi Araba Segment of the Dead Sea Rift                                           65

3   Stress fields for the Dead Sea Rift region                      4.1    Quality ranking

                                                                    A statistical method designed by Delvaux et al. (1997) is
Determination of the orientation of a palaeostress field is
                                                                    used to determine the reliability of the final stress tensor. The
often based on the analysis of structures such as fold axes,
                                                                    quality ranking is defined as:
faults with known sense of movement, tabular magmatic in-
trusions (mostly dykes), volcanic lineaments, veins, joints

                                                                    Q = n n/nt /α
and tectonic stylolites. A reconstruction of the palaeostress
field is crucial for understanding the tectonic processes that         The quality rank Q combines the total number of fault data
lead to the development of these structures. The determina-         measured (nt ), the number of fault data used for the stress
tion of recent to sub-recent stress fields is based on geophys-     tensor determination (n) and the mean slip deviation (α). It
ical data including focal plane solution of earthquakes, hy-        ranges from A (good) to D (unreliable), with a tensor rank
draulic fracturing, and borehole breakouts. Several attempts        ranging from >1.5 to a tensor rank smaller than 0.3.
were carried out to map palaeostress fields in the Dead Sea
region. All these studies have concentrated on the western          4.2    Stress regime
side of the Dead Sea Fault System in Israel and the Sinai.
For this area, an extensive set of stress data derived from fault   The stress regime is determined by the nature of the verti-
striations, tectonic stylolites, veins with secondary mineral-      cal stress axes: extensional (σ 2 SHmax ) when σ 1 is vertical,
ization, small folds and dykes has been published (e.g. Eyal        strike-slip (σ 1 SHmax ) when σ 2 is vertical and compressional
and Reches, 1983; Hatzor and Reches, 1990; Eyal, 1996;              (σ 1 SHmax ) when σ 3 is vertical (Delvaux et al., 1997). The
Badawy and Horvath, 1999). The present study however is             type of stress regime can be expressed numerically as defined
directed to the eastern side of the fault system, especially        by Delvaux et al. (1997) by using the stress regime index R’
in South-western Jordan, for which no data on palaeostress          ranging from 0.0 to 3.0.
evolution exists. Therefore our results will be the first to be        The stress regime index R’ defines the stress regime com-
introduced for the eastern side of the rift.                        pletely and is convenient for computing the mean regional
                                                                    stress regime from a series of individual stress tensors in a
                                                                    given area.

4   Method of investigation                                         4.3    Age constraints of stress tensors

                                                                    The relative age of a stress tensor is estimated from cross-
The combined stress tensor determination and fault sepa-
                                                                    cutting relationships of striations and fault planes (fault-slip
ration introduced here make use of the TENSOR program
                                                                    data) and from the age of particular rock units by constrain-
(Delvaux, 1993), specially designed for providing great in-
                                                                    ing these tensors. Also, an age can be indirectly inferred
teractivity and allowing to control all used parameters. The
                                                                    from faulting depth as indicated by mineralization on the
program should be considered as a tool for helping the op-
                                                                    fault plane and its consolidation state. Epidote-chlorite min-
erator to separate possible groups in the fault population and
                                                                    erals can be indicators for deep brittle faulting. Haematite
determine their stress tensors. It is up to the operator to make
                                                                    can be formed at less deep levels. Consolidated breccia and
himself the final decision, taking into account the qualitative
                                                                    fault gauges on the fault surface are used as indicators for
information from the field.
                                                                    older faulting, while non- consolidated breccia and gauge in-
   The inversion is based on Bott’s (1959) assumption that          dicate very superficial faulting.
slip on a plane occurs in the direction of the maximum re-
solved shear stress. The slip direction on the fault plane
is inferred from frictional grooves or striations. The data
                                                                    5     Palaeostress analysis
used for the inversion are the strike and dip of the fault
plane, the orientation of the slip line and the sense of move-      The orientation of the stress field was determined by select-
ment on the fault plane. They are collectively referred to          ing those measurements of mesostructures with a clear sense
as fault-slip data. The fault-slip data are inverted to obtain      of movement. Many exposures have been examined but a
the four parameters of the reduced stress tensor according          station was only established at sites with suitable mesostruc-
to Angelier (1994): the principal stress axes σ 1 (maximum          tures. About 89 measurement sites or stations are distributed
compression), σ 2 (intermediate compression) and σ 3 (min-          over the study area. Sites are located on exposures ranging
imum compression) and the ratio of principal stress differ-         from Neoproterozoic crystalline basement rocks to Miocene
ences R = (σ 2 − σ 3)/(σ 1 − σ 3).                                  sediments. A total of 2773 fault-slip data were measured in
   The four parameters are determined by using successively         different sites.
an improved version of the Right Dihedral method of An-                Three types of mesostructures were commonly measured:
gelier and Mechler (1977), and a four-dimensional numeric           minor faults with slip lines (striations), joints and dykes. Stri-
rotational optimisation method (Delvaux, 1993).                     ations, mineral steps, stratigraphic separation and displace-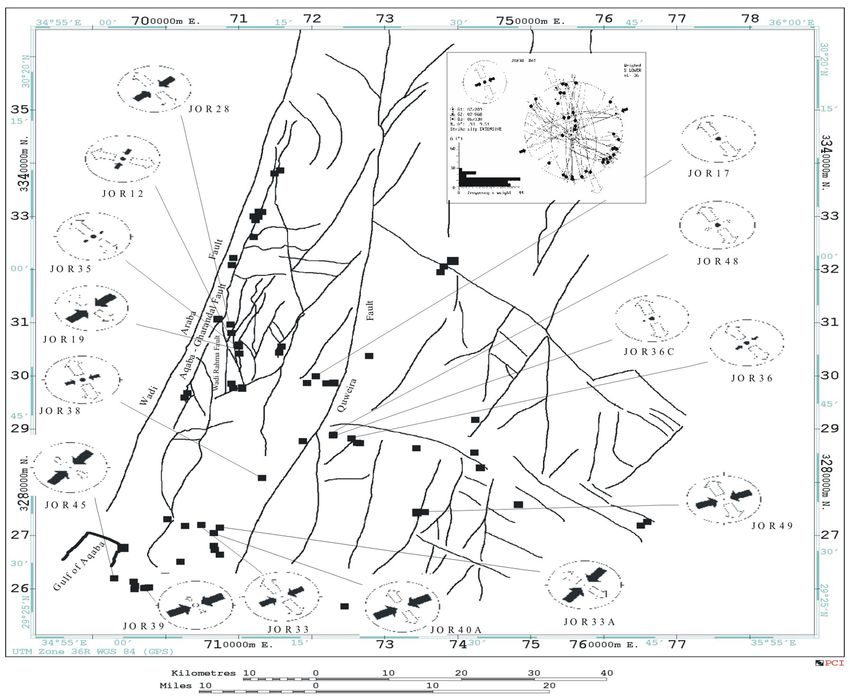
66                                   U. Zain Eldeen et al.: Tectonic evolution in the Wadi Araba Segment of the Dead Sea Rift

                              JOR37                                                       JOR42

     Fig.
Fig. 2.     2-inversion
        Stress  Stressresults
                        inversion      results
                              for the NE-SW    for the
                                            trending     NE-SW
                                                     dykes.       trending dykes.

ment of dykes were used to determine the sense of move-           5.1   Palaeostress directions
ment. Some outcrops show very clear indicators, especially
the fresh ones like new road-cuts and quarries.                   The palaeostress directions are the following:
   The data yielded 2245 useful values (81%) in 88 different       T1a: NE-SW SHmax , defined from NE-SW Late
tensors, which is a good score. Table 1 shows the number of                Neoproterozoic dykes;
fault data (n) used for the stress tensor determination; total     T1b: NE-SW SHmax transtensional stress regime;
number of fault data measured in the field (nt ); plunge and       T2a: N-S SHmax , defined from N-S Late
azimuth of the principal stress axes (σ 1, σ 2 and σ 3); stress            Neoproterozoic dykes;
ratio (R); mean slip deviation (α); quality ranking (Q); stress    T2b: N-S SHmax transpressional stress regime
index (R’) and the tensor type. Some tensors give no reliable              (only in Neoproterozoic basement);
quality (rank D) because of either a large slip deviation (α)      T3:     E-W SHmax strike-slip stress regime;
or too few faults present to constrain a tensor (n).               T4:     NW-SE SHmax strike-slip stress regime;
                                                                   T5:     N-S SHmax transpressional stress regime;
   The stress inversion results and their correlation allow
                                                                   T6:     N-S SHmax extensional stress regime;
the definition of seven palaeostress groups (corresponding
                                                                   T7:     N-S Shmin extensional stress regime;
to stress stages T1–T7). The tensors are grouped according
                                                                   T8:     NW-SE SHmax
to their similarities as a function of stress axes orientation
                                                                           strike-slip stress regime (present-day stress field).
(SHmax ), stress regime index, stratigraphic relation and fault
gauge composition. All obtained stress tensors are listed in         SHmax for each group were determined according to the
Table 1 and displayed on structural maps for each of the          World Stress Map data base definition.
palaeostress stage. Some sites exhibit more than one tensor,         The palaeostress evolution from T1–T7 corresponds to the
indicating that more than one movement (stage) occurred.          formation and reactivation of faults. With each stress field,
The relative chronology of the palaeostress stages is estab-      a generation of new faults was accompanied by reactivated
lished where possible crosscutting relationships between the      slip on pre-existing planes. Some pre-existing faults are re-
several generations of striations exist.                          peatedly reactivated during subsequent deformation.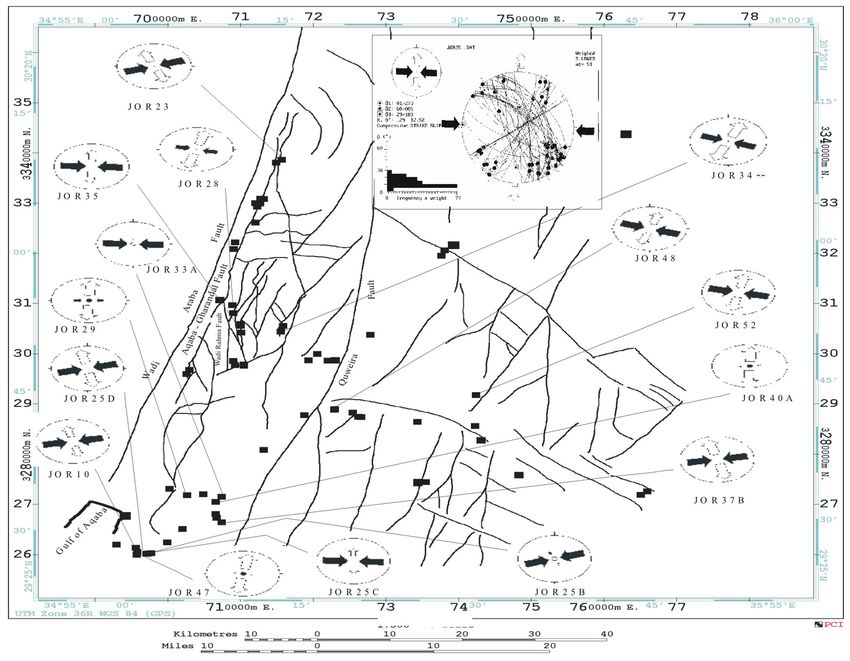
U. Zain Eldeen et al.: Tectonic evolution in the Wadi Araba Segment of the Dead Sea Rift                                                67

Table 1. Palaeostress tensors from fault-slip data (... continues)
 n               = number of fault data used for stress tensor determination;
 nt              = total number of fault data measured;
 σ 1, σ 2, σ 3   = plunge and azimuth of principal stress axes;
 R               = stress ratio (σ 2 − σ 3)/(σ 1 − σ 3);
 α               = mean slip deviation;
 Q               = quantity ranking (n×(n/nt)/α);
 R’              = tensor type index;
 ∗               = Alternative solution

                 Site          n       nt     σ1         σ2          σ3         R    α      Q   R’     Type of Tensor

                 T1a: NE-SW Late Neoproterozoic dykes
                 JOR25        12      16    82/116     04/236    07/326     1.0     9.5     B    1.0   Strike-slip extensive
                 JOR37        49      60    63/052     26/247    06/154    0.98     12.9    A   0.98   Strike-slip extensive
                 JOR37         8      10    66/017     16/246    17/151     1.0     9.6     B    1.0   Strike-slip extensive
                 JOR42       100     122    62/249     28/060    04/152    0.97     13.7    A   0.97   Strike-slip extensive
                 Mean:4      169     208    83/017     05/242    05/152    0.99                 0.99   Strike-slip extensive

                 T2a: N-S Late Neoproterozoic dykes
                 JOR42        19      26    70/014     20/193    00/283     1.0      9.4    A   1.0    Strike-slip extensive

                 T1b: NE-SW SHmax (Late Neoproterozoic)
                 JOR12     12    111 62/357 26/203               11/107    0.87      8.49   D   0.87   Strike-slip extensive
                 JOR17     14     50 58/341 06/241               31/148    0.49      8.58   B   0.49   Pure extensive
                 JOR19     13     86 05/227 68/330               21/134    0.39      9.68   D   1.61   Pure strike-slip
                 JOR28     13     68 26/047 61/257               13/143    0.71      6.58   C   1.29   Extensive strike-slip
                 JOR33     23     65 37/060 53/228               06/325    0.78     11.14   B   1.22   Extensive strike-slip
                 JOR33A    16     86 39/037 50/227               06/131    0.34     10.51   D   1.66   Pure strike-slip
                 JOR35     16    106 54/226 36/049               01/318    0.69     13.54   D   0.69   Pure extensive
                 JOR36     23     35 61/276 20/047               20/144    0.79       9.2   A   0.79   Strike-slip extensive
                 JOR36C    14     68 52/258 37/065               06/160    0.59     10.03   D   0.59   Pure extensive
                 JOR38     36     98 82/209 07/068               06/338    0.93      9.51   B   0.93   Strike-slip extensive
                 JOR39     10     35 10/062 30/326               58/168    0.19     11.93   D   2.19   Strike-slip compressive
                 JOR40A    33    136 15/242 75/069               02/332    0.29      8.45   B   1.71   Compressive strike-slip
                 JOR45     25     46 19/220 70/043               02/310    0.09     10.07   B   1.91   Compressive strike-slip
                 JOR48     14     74 68/258 21/059               06/152    0.37       4.0   B   0.37   Pure extensive
                 JOR49     23     46 38/248 51/057               06/154    0.57     12.66   B   1.43   Pure strike-slip
                 Mean:15 285 1110 09/053 80/262                  05/144    0.82                 1.18   Extensive strike-slip

                 T2b: N-S SHmax (Late Neoproterozoic)
                 JOR12∗       38      96    01/342     86/238    03/072    0.42      8.46   A   1.58   Pure strike-slip
                 JOR17        30      50    03/171     24/079    66/267    0.38      8.73   A   2.38   Pure compressive
                 JOR19∗       34      86    09/003     62/256    26/097    0.24     10.33   B   1.76   Compressive strike-slip
                 Mean:3      102     232    02/352     72/256    18/083    0.09                 1.91   Compressive strike-slip

5.1.1   T1a: NE-SW Late Neoproterozoic dykes                               of the principal stress axes are σ 1 at 83/017, σ 2 at 05/242
                                                                           and σ 3 at 05/152. The stress ratio R is 0.99 indicating a
The NE-SW trending dykes in the Neoproterozoic crystalline                 strike-slip extensive regime (transtensive).
basement rocks represent the oldest intrusion phase in the
study area. They have a minimum age of 570 Ma. These                          Figure 2 shows plots for some examples of the stress ten-
dykes have been used to calculate the stress tensor.                       sors and illustrates the subset of the data together with the
   The calculated results are listed in Table 1. Four stress               orientation of the calculated principal stress axes. The re-
tensors have been obtained with 169 measured data using the                sults indicate a clear extensional regime (σ 1 is vertical while
assumption that dykes are parallel to σ 1 and σ 2 and perpen-              σ 2 and σ 3 are horizontal) with a NE-SW maximum princi-
dicular to σ 3. All the stress tensors have sub-vertical σ 1-axes          pal stress axis SHmax (σ 2) and a NW-SE minimum principal
and sub-horizontal σ 2- and σ 3-axes. The mean orientations                axis Shmin (σ 3).
68                                     U. Zain Eldeen et al.: Tectonic evolution in the Wadi Araba Segment of the Dead Sea Rift

Table 1. ... continued

              Site         n      nt      σ1       σ2        σ3       R      α      Q     R’    Type of Tensor

              T3: E-W SHmax (affects Neoproterozoic, Cambrian, Ordovician and Cretaceous but not younger rocks)
              [Syrian Arc Stress Field, SAS]
              JOR10       14     116    09/259   69/012    19/166   0.22    7.86    D    1.78   Compressive strike-slip
              JOR23       12      35    11/252   64/006    23/157   0.32    8.77    C    1.68   Pure strike-slip
              JOR25B      35      58    25/073   23/332    55/205   0.58    8.28    A    2.58   Pure compressive
              JOR25C      29      43    09/273   63/021    25/179    0.0   13.31    B     2.0   Pure strike-slip
              JOR25D       9      34    11/256   77/108    07/347   0.44    9.02    D    1.56   Pure strike-slip
              JOR28       12      68    07/283   61/181    28/017   0.92    5.98    C    1.08   Extensive strike-slip
              JOR29       23      37    68/299   20/091    10/184   0.77    5.92    A    0.77   Strike-slip extensive
              JOR33A       9      86    26/273   13/177    61/062   0.51   10.83    D    2.51   Pure compressive
              JOR34       19     251    14/289   67/162    17/024   0.66   16.75    D    1.34   Pure strike-slip
              JOR35       51     106    01/273   60/005    29/183   0.29   12.52    A    1.71   Compressive strike-slip
              JOR37B      18      67    18/260   63/030    19/164   0.52   11.53    C    1.48   Pure strike-slip
              JOR40A      15     136    52/139   22/261    29/003   0.44   12.59    D    0.44   Pure extensive
              JOR47       37      44    84/261   06/101    02/011   0.47   14.78    A    0.47   Pure extensive
              JOR48       24      74    00/108   64/018    26/199   0.32   11.66    B    1.68   Pure strike-slip
              JOR52       17     106    01/103   76/197    14/012   0.44   13.42    D    1.56   Pure-strike-slip
              Mean:15    324    1261    05/271   84/060    03/181   0.49                 1.51   Pure strike-slip
              T4: NW-SE SHmax (affected Neoproterozoic, Cambrian, Ordovician, Cretaceous and Palaeocene/Eocene
              but not younger rocks) [Dead Sea Stress Field, DSS]
              JOR17       11      11    09/307   57/050    32/211   0.64    4.34    A    1.36   Pure strike-slip
              JOR08       43      71    74/097   08/337    13/245    0.6    7.42    A     0.6   Pure extensive
              JOR09       33      49    09/319   67/207    21/053   0.17   13.21    A    1.83   Compressive strike-slip
              JOR10       48     116    04/319   80/203    10/049    0.8    8.89    A     1.2   Extensive strike-slip
              JOR11       19      54    51/128   37/329    10/231   0.64    6.02    B    0.64   Pure extensive
              JOR12       15     111    06/133   83/319    01/223   0.69    8.75    D    1.31   Pure strike-slip
              JOR14       11      48    01/129   67/221    23/039   0.27    5.66    C    1.73   Compressive strike-slip
              JOR15       21      35    15/300   63/180    22/037   0.83    11.4    B    1.17   Extensive strike-slip
              JOR16       32      45    09/327   81/157    01/057   0.32   10.11    A    1.68   Pure extensive
              JOR25B       8      58    70/046   04/307    19/215   0.64    2.97    C    0.64   Pure extensive
              JOR33       26      65    14/158   72/296    12/065   0.77   12.31    B    1.23   Extensive strike-slip
              JOR33A      40      86    05/332   84/181    02/062   0.27    8.74    A    1.73   Compressive strike-slip
              JOR34       23     251    52/289   34/137    14/037   0.78   11.48    D    0.78   Strike-slip extensive
              JOR34       56     251    05/336   72/081    17/245   0.67   11.79    B    1.33   Pure strike-slip
              JOR35       24     106    04/334   63/237    27/066   0.25   12.58    C    1.75   Compressive strike-slip
              JOR36C      11      68    07/304   82/095    04/214   0.45    7.28    D    1.55   Pure strike-slip
              JOR38       41      98    05/143   80/260    08/052   0.55   10.71    A    1.45   Pure strike-slip
              JOR45       19      46    11/326   62/078    26/231   0.84   16.24    C    1.16   Extensive strike-slip
              JOR48       22      74    02/149   81/246    09/058   0.14    4.66    B    1.86   Compressive strike-slip
              JOR55       26      37    28/321   56/103    18/221   0.72   11.09    A    1.28   Extensive strike-slip
              Mean:20    529    1429    05/321   85/151    01/051   0.69                 1.31   Pure strike-slip

5.1.2   T1b: NE-SW SHmax (Late Neoproterozoic)                      axes are in different order (in this case the σ 1-, σ 2- and σ 3-
                                                                    axes are swapped).
The oldest structures recorded in the Neoproterozoic crys-             All tensors of this group were observed only in the Neo-
talline basement rocks point to NE-SW directed compres-             proterozoic crystalline basement rocks. Faults were gener-
sion. The palaeostress of this stage represents 15 tensors with     ally associated with chlorite-epidote mineralizations.
285 fault-slip data. The results of these tensors obtained from        The mean orientations of the principal stress axes are σ 1
different sites that constrain this stage are given in Table 1.     at 09/053, σ 2 at 80/262 and σ 3 at 05/144. The stress regime
   The palaeostress tensors define a strike-slip regime with        index for the mean weighed tensor is 1.18, which indicates
a well-constrained σ 1-orientation (SHmax ) to the NE. Some         an extensive strike-slip regime (transtensive). Fig. 3 shows
tensors indicate compressive and extensive regimes. This            example of this group which indicate that the sinistral dis-
means that, although the same orientations for the three prin-      placement along E-W to ENE-WSW directed faults and the
cipal stress axes are present, the relative magnitudes of the       dextral displacement along N-S to NNE-SSW directed faults,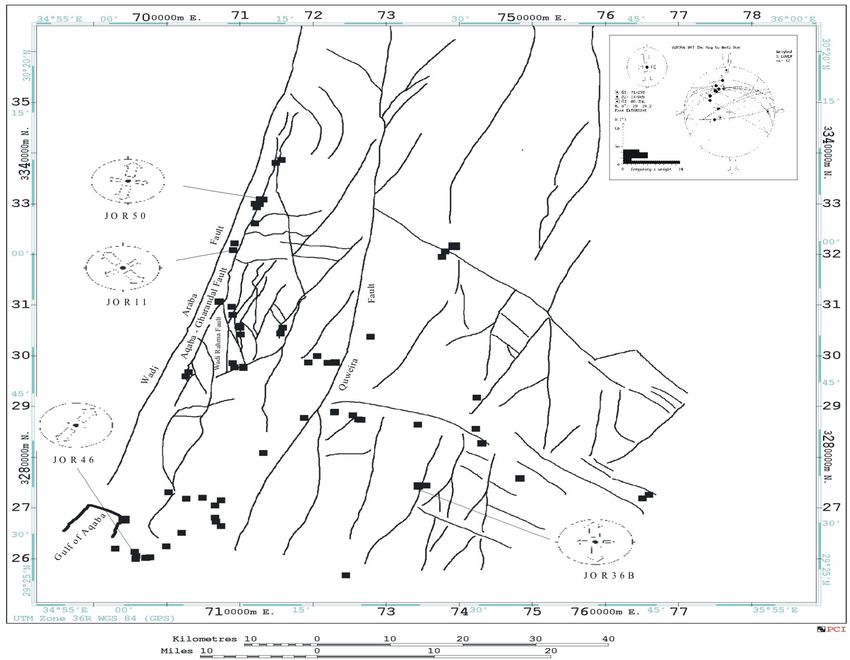
U. Zain Eldeen et al.: Tectonic evolution in the Wadi Araba Segment of the Dead Sea Rift                                            69

Table 1. ... continued

              Site          n       nt      σ1        σ2         σ3       R        α      Q     R’     Type of Tensor
              T5: N-S SHmax strike-slip to compressional stress regime (affects Neoproterozoic, Cambrian, Ordovician,
              Cretaceous, Palaeocene/Eocene and Miocene (Dana Conglomerates)) [Dead Sea Stress Field, DSS]
              JOR08        24     71 31/020 16/280 54/166 0.68                  9.92   B 2.68 Pure compression
              JOR10        35    116 05/185 80/304 08/094 0.64                  6.62   A 1.36 Pure strike-slip
              JOR12        74    111 07/009 80/236 08/100 0.21                  10.7   A 1.79 Compressive strike-slip
              JOR14        34     48 18/008 66/229 14/103 0.86                  6.94   A 1.14 Extensive strike-slip
              JOR15         7     35 33/185 56/023 08/280 0.84 14.18 D 1.16 Extensive strike-slip
              JOR19        48     86 05/352 65/253 25/085 0.25                  9.66   A 1.75 Compressive strike-slip
              JOR20        22     39 07/001 76/242 12/093               0.8     2.58   A     1.2   Extensive strike-slip
              JOR25A       23     39 11/359 01/268 79/174 0.38 12.72 B 2.38 Pure compressive
              JOR25D       19     34 26/201 50/077 29/307 0.22                  6.02   A 1.78 Compressive strike-slip
              JOR28        38     68 04/170 65/269 25/079 0.17 15.74 B 1.83 Compressive strike-slip
              JOR36C       30     68 06/352 74/241 14/083 0.21 12.95 B 1.79 Compressive strike-slip
              JOR37B       32     67 06/169 83/312 05/078 0.34 10.41 B 1.66 Pure strike-slip
              JOR39        16     35 00/357 67/088 23/267 0.38 12.51 B 1.62 Pure strike-slip
              JOR40A       57    136 09/339 81/171 02/070 0.12 11.88 A 1.88 Compressive strike-slip
              JOR51B        7     22 21/167 12/262 65/020 0.52                  7.35   C 2.52 Pure compressive
              JOR52        20    106 32/171 05/264 58/002 0.13 13.48 D 2.13 Strike-slip compressive
              Mean:16 486 1081 02/179 88/334 01/089 0.21                                    1.79 Compressive strike-slip
              T6: N-S SHmax extensional stress regime (affects all rocks units in the study area)
              JOR23      15      35 76/112 04/006 14/276 0.76                    8.98     B 0.76       Strike-slip extensive
              JOR34      18     251 79/288 03/186 11/095 0.53 12.63 D 0.53                             Pure extensive
              JOR34      75     251 66/061 16/191 18/286 0.16 11.47 A 0.16                             Radial extensive
              JOR50      47      94 87/241 01/352 03/082 0.83                    9.32     A 0.83       Strike-slip extensive
              JOR50      11      94 57/018 22/145 24/246 0.28                    8.37     D 0.28       Pure extensive
              Mean:5    166     725 78/050 07/177 09/268 0.51                                  0.51    Pure extensive
              T7: N-S Shmin extensional stress regime (affects all rocks units in the study area)
              JOR11      20       54 58/320 03/053 32/145 0.21 10.36 B 0.21                            Radial extensive
              JOR36B     12       17 71/239 17/089 08/356 0.28                    10.3     C 0.28      Pure extensive
              JOR46        6      37 56/191 11/296 32/033 0.59                     0.5     A 0.59      Pure extensive
              JOR50      31       94 84/163 03/281 05/012 0.25                    7.59     B 0.25      Pure extensive
              Mean:4     69      202 86/207 02/090 04/360 0.33                                  0.33   Pure extensive
              Alternativ solution for JOR10, JOR12 and JOR19
              JOR10        41     116 19/043 71/229 02/133               0.28    11.02    B    1.72    Compressive strike-slip
              JOR10        20     116 61/322 23/103 16/200               0.44    10.81    C    0.44    Pure extensive
              JOR10        46     116 06/323 79/205 10/054               0.81    10.72    A    1.19    Extensive strike-slip
              JOR12        38      96 01/342 86/238 03/072               0.42     8.46    A    1.58    Pure strike-slip
              JOR12        33      96 15/015 65/250 20/110               0.27     7.18    A    1.73    Compressive strike-slip
              JOR12        17      96 05/021 78/268 11/112               0.97     6.98    C    1.03    Extensive strike-slip
              JOR19        34      86 09/003 62/256 26/097               0.24    10.33    B    1.76    Compressive strike-slip
              JOR19         9      86 20/271 15/175 65/052               0.28    12.32    D    2.28    Pure compressive
              JOR19        26      86 18/148 72/343 05/240               0.87    10.58    B    1.13    Extensive strike-slip

are the major components for the expression of this regime                  Due to the limited amount of measurements, only one ten-
in the study area.                                                       sor has been obtained with 19 measured data. The results
                                                                         are listed in Table 1. This tensor has a sub-vertical σ 1-axis
5.1.3   T2a: NNE-SSW to N-S Late Neoproterozoic dykes                    at 70/014 and sub-horizontal σ 2- and σ 3-axes at 20/193 and
                                                                         00/283 respectively (Fig. 4). The data indicate a transtensive
                                                                         stress regime with a N-S maximum principal stress axis (σ 2)
In addition to the NE-SW trending dykes, NNE-SSW to N-                   and an E-W minimum principal stress axis (σ 3).
S trending dykes were also observed in the Neoproterozoic
crystalline basement rocks. Field evidence shows that these
are younger than the previous set. The N-S trending dykes
have a maximum age of 560 Ma.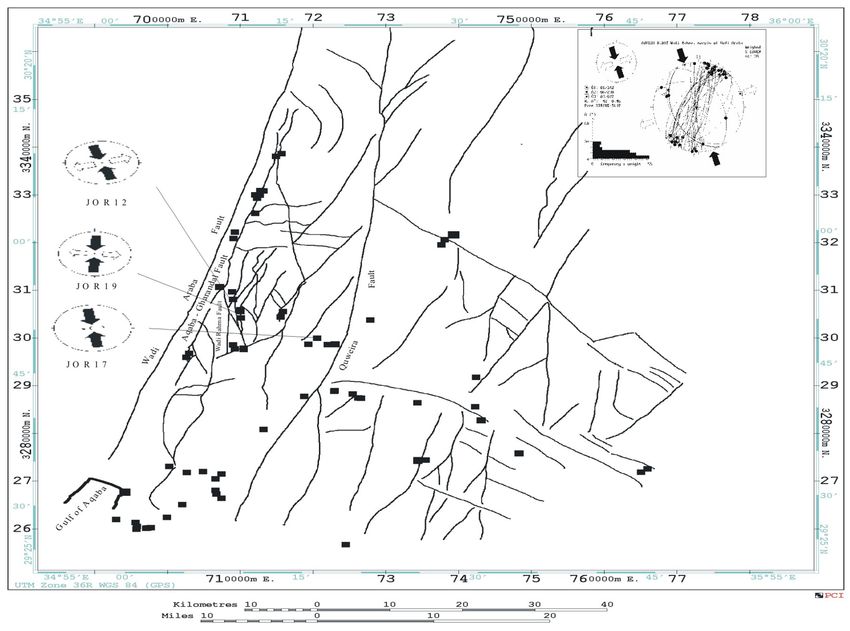
70                                      U. Zain Eldeen et al.: Tectonic evolution in the Wadi Araba Segment of the Dead Sea Rift

            Fig. 3. Structural map with palaeostress tensor group T1b. Inset: one example of stress inversion results for this group.

                                                                                      in the Neoproterozoic crystalline basement rocks. The calcu-
                                                                                      lated results of these tensors are listed in Table 1. This stage
                                                                                      is characterised by a transpressive stress regime with a well
                                                                                      constrained σ 1 at 02/352 and σ 3 at 18/083. The three tensors
                                                                                      are shown in Fig. 5.
                                                                                         One of the tensors indicates a compressive regime and the
                                                                                      other two tensors indicate a strike-slip regime. This means
                                                                                      that the relative magnitudes of the stress axes are in different
                                                                                      order (in this case the σ 2- and σ 3-axes are swapped). The
                                                                                      stress regime created mainly a sinistral strike-slip movement
                                                                                      along NE-SW faults and reverse (thrust) movement along E-
                                                                                      W faults. The Dead Sea Stress field (DSS) will reactivate
                                                                                      these faults during Late Cainozoic times.

                                                                                      5.1.5   T3: E-W SHmax
ress inversion  method
           Fig. 4.          for themethod
                   Stress inversion NNE-SSW       to N-S trending
                                          for the NNE-SSW            dykes.
                                                           to N-S trending
            dykes.
                                                                                      The tensors for this direction were obtained from the fault-
                                                                                      slip data observed in the Neoproterozoic crystalline base-
            5.1.4    T2b: N-S SHmax (Late Neoproterozoic)                             ment rocks and in Cambrian, Ordovician and Cretaceous
                                                                                      rocks (but not in younger ones). The calculated results show
            The second tensor group defines N-S SHmax and represents                  15 tensors obtained on 324 fault-slip data and are listed in Ta-
            three tensors with 102 fault-slip data. This group was con-               ble 1. The example given in Fig. 6 shows that sinistral move-
            structed from the chlorite/epidote rich fault planes observed             ment along NW-SE trending faults and dextral movements
U. Zain Eldeen et al.: Tectonic evolution in the Wadi Araba Segment of the Dead Sea Rift 71 Fig. 5. Structural map with paleostress tensor group T2b. Inset: one example of stress inversion results for this group. Fig. 6. Structural map with paleostress tensor group T3. Inset: one example of stress inversion results for this group.
72                                      U. Zain Eldeen et al.: Tectonic evolution in the Wadi Araba Segment of the Dead Sea Rift

Fig. 7. Structural map with paleostress tensor group T4. Inset: one example for this group.

Fig. 8. Structural map with paleostress tensor group T5. Inset: one example for this group.
U. Zain Eldeen et al.: Tectonic evolution in the Wadi Araba Segment of the Dead Sea Rift                                            73

Fig. 9. Structural map with paleostress tensor group T6. Inset: one example for this group.

along NE-SW trending faults are the major components for                 The tensors of this stage indicate a strike-slip regime. An
this stage.                                                              example for this stage is shown in Fig. 7.
   This stage is characterised mainly by a strike-slip regime               Four tensors out of twenty indicate extensive regimes (Ta-
and by alternation between compressive and extensive                     ble 1). This means that, although the same orientations for
regimes with the same orientation of the three principal stress          the principal stress axes are present, the relative magnitudes
axes but in different order. Evidence of strike-slip faulting            of the axes vary (in this case the σ 1 and σ 2 are swapped).
of flower structures has been observed south-east of Aqaba.              The distributions of the extension axes Shmin (σ 3) of this
The principal compression axis (σ 1) is horizontal with an               stage are homogeneous and the axes are sub-horizontal. The
E-W orientation (05/271), and the principal extension axis               exchange of the stress axes σ 1 and σ 2 was related to the ex-
(σ 3) is also horizontal with a N-S orientation (03/181). The            tensional tectonics.
stress regime created NW-SE sinistral faults and reactivated                The direction of this group was computed from NW-SE
NE-SW dextral faults.                                                    dykes associated with tension joints and normal faulting.
                                                                         Similar dykes have been dated at 20 Ma in Sinai and Negev
5.1.6   T4: NW-SE SHmax                                                  (Eyal et al., 1981) The trend of the dykes is parallel to and
                                                                         compatible with the maximum compressive axis of this ten-
                                                                         sor group. Hence, the age of this stage is referred to 20 Ma.
This direction was obtained from data observed in the Neo-               These dykes are associated with the opening of the Red Sea.
proterozoic crystalline basement and the Cambrian, Ordovi-
                                                                            The stress regime of this stage created conjugated sinis-
cian, Cretaceous and Palaeocene/Eocene rocks. The tensors
                                                                         tral and dextral strike-slip faults (sinistral movement along
of this stage were not observed in rocks younger than the
                                                                         NNW-SSE trending faults and dextral movement along
Palaeocene/Eocene rocks in the study area. Twenty tensors
                                                                         WNW-ESE trending faults).
with 529 fault-slip data were obtained in different sites dis-
tributed in the study area and shown in Table 1. The cal-
culated results indicate that σ 1 (SHmax ) and σ 3 (Shmin ) are          5.1.7   T5: NNW-SSE to N-S SHmax
generally sub-horizontal and σ 2 is sub-vertical. The main
orientations of the principal stress axes are σ 1 at 05/321, σ 2         The fault-slip data obtained for this direction of stress
at 85/151 and σ 3 at 01/051 while the stress index is 1.31.              regime were observed in the Neoproterozoic crystalline
74 U. Zain Eldeen et al.: Tectonic evolution in the Wadi Araba Segment of the Dead Sea Rift
Fig. 10. Structural map with paleostress tensor group T7. Inset: one example of for this group.
basement and the Cambrian, Ordovician, Cretaceous, was identified in the Dana Conglomerates (Holocene in age;
Palaeocene/Eocene and Miocene rocks. Ibrahim, 1993) or older units suggesting a Holocene age for
The principal stress axes of the tensors representing this this deformation. Kinematic indicators include only faults
stage have similar orientation, but with some differences. and striations.
The results (Table 1) indicate that the mean horizontal stress The calculated results are listed in Table 1. These indicate
axes σ 1 (SHmax ) and σ 3 (Shmin ) are sub-horizontal, while that the distribution of the maximum stress axes SHmax (σ 2)
σ 2 is sub-vertical. The orientations of these axes are σ 1 at and the minimum stress axes Shmin (σ 3) of this stage are ho-
02/179, σ 2 at 88/334 and σ 3 at 01/089 while the stress index mogeneous and sub-horizontal. Examples of tensors for this
of 1.79 is indicating a compressive strike-slip regime (trans- stage are shown in Fig. 9.
pressive). The mean orientations of the three principal stress axes
Four tensors (Table 1) out of sixteen yield a compressive are σ 1 at 78/050, σ 2 at 07/177 and σ 3 at 09/268. The results
regime. This means that σ 2 and σ 3 are swapped and σ 1 re- indicate a typical extensive stress regime with a N-S SHmax
mains constant. Figure 8 shows examples of tensors obtained (σ 2) and an E-W Shmin (σ 3). This created NNE-SSW normal
in different sites. faults and NW-SE dextral strike-slip faults, and reactivated
SHmax for this group is horizontal with N-S orientation NE-SW trending faults as sinistral.
(N179◦ –359◦ E) and Shmin is also horizontal with E-W orien-
tation (N089◦ –269◦ ). This stress regime reactivated sinistral 5.1.9 T7: N-S Shmin (E-W SHmax )
movement along NE-SW trending faults and dextral move-
ment along NW-SE trending faults but in more shallow con- A group of four tensors with N-S Shmin and E-W SHmax was
ditions (poorly consolidated fault gauge and limonitic coat- obtained in the Dana Conglomerates. Hence, this T7 ten-
ing), thus creating thrust along ENE-WSW trending faults. sor group is also Holocene in age but younger than the T6
tensor group. All tensors are characterised by σ 2 and σ 3
5.1.8 T6: N-S SHmax being horizontal and σ 1 vertical. These tensors are shown
in Fig. 10. The results of the palaeostress analysis indicate
This group is characterised by σ 2 and σ 3 being horizontal, an extensional regime. Calculations were based on a total of
σ 1 vertical and a stress regime index R’ of 0.51, indicat- 69 measurements and the results are listed in Table 1. The
ing a typical extensive stress regime. The T6 tensor group mean orientations of the three principal stress axes are σ 1 atU. Zain Eldeen et al.: Tectonic evolution in the Wadi Araba Segment of the Dead Sea Rift 75
100
Extensional regime
Strike-slip regime
80 Compressional stress regime
Numberof fault data
60
40
20
0
0 0.2 0.4 0.6 0.8 1 1.2 1.4 1.6 1.8 2 2.2 2.4 2.6 2.8 3
Stress regime index R'
Fig. 11 Bar diagram showing the stress regime index R’ in function of number of fa
Fig. 11. Bar diagram showing the stress regime index R’ in function of number of fault data.
86/207, σ 2 at 02/090 and σ 3 at 04/360 and the stress index Stress inversion of the fault-slip was obtained from rocks
is 0.33, indicating a typically extensive stress regime. This ranging in age from Neoproterozoic to Holocene. The data
stage created E-W to ESE-WNW normal faults, and reacti- were inverted to determine the palaeostress tensors. A total
vated NNE-SSW normal faults and NW-SE sinistral faults. of 88 different palaeostress tensors have been reconstructed
The tensors of this stage are the youngest ones recorded from various sites distributed in the study area.
in the study area. However, pull-apart basins in Late The fault-slip data used for reconstructing the stress field
Pleistocene-Holocene sediments have been recorded along allow characterising the palaeostress fields and their varia-
the Wadi Araba Fault, the southern segment of the Dead Sea tion in time. They also allow to analyse the kinematics of
Rift. This indicates a strike-slip movement (T8) occurring the movements along the major faults at different geological
along the fault, which is younger than the extensive stress stages. Interpretation of the results of stress inversion and
regime. relative chronology criteria in function of the stratigraphical
Figure 11 represents the histogram of distribution of the constraints lead us to conclude that the study area was sub-
stress regime index R’ in function of the number of fault data jected to several stress states from the Late Neoproterozoic to
used for the stress inversion. The histogram shows clearly the present day. Attention has been drawn to the main stages
that the main stress regimes are extensional (R’ = 0.16–1.0) and characteristics of the deformation of the Dead Sea Rift
and strike-slip (R’ = 1.14–2.0). Few tensors exhibit a com- in order to evaluate the rift’s tectonic history.
pressional stress regime (R’ = 2.13–2.68). The data confirm the seven-stage evolution model pro-
posed on the basis of fault-slip data and dyke observations.
The major palaeostress regimes differ mainly by the orien-
6 Discussion
tation of their principal axis of compression (σ 1), by their
The current study presents the first palaeostress results ob- stress regime index (R’) and by their stratigraphic relation-
tained from the kinematic slip data in the eastern margins of ship. There are also indications for a Pleistocene extensional
the Dead Sea Rift in South-west Jordan. stage. The observation of mesostructures made it possible
to reconstruct a consistent succession of the main stress field
6.1 Palaeostress stages and associated tectonic structures phases. A regional synthesis of palaeostress evolution for the
study area is presented in Fig. 12, based on the computation
The analysis of mesostructure measurements and the struc- of mean stress tensors for each stage.
tural survey in the eastern margins of the Dead Sea Rift en- The palaeostress stages (tensor groups) have been succes-
abled the reconstruction of the palaeostress fields of the study sively grouped as follows: two Late Neoproterozoic (T1 and
area. T2), one Cretaceous (T3) and four Cenozoic (T4, T5, T6 and76 U. Zain Eldeen et al.: Tectonic evolution in the Wadi Araba Segment of the Dead Sea Rift
T1 T2 T3 T4 T5 T6 T7
Holocene
Post-
Pleistocene
Miocene
(DSS)
(DSS)
Cretaceous
Ordovician (SAS)
Cambrian
Fig. 12. Summary of the time con-
straints for the determined palaeostress
directions in Southwest Jordan based on
computation of the mean stress tensors
Late Neo- for each stage. T1: NE-SW SHmax ,
proterozoic
T2: N-S SHmax , T3: E-W SHmax ,
T4: NW-SE SHmax , T5: NNW-SSE to
N-S SHmax , T6: N-S SHmax and T7: E-
W SHmax .
Fig. 12- Summary of the time constraints for the determined palaeostress directions in Southwest
Jordan based on computation of the mean stress tensors for each stage. T1: NE-SW SHmax, T2: N-S SHmax,
T3: E-W SHmax, T4: NW-SE SHmax, T5: NNW-SSE to N-S SHmax, T6: N-S SHmax and T7: E-W SHmax.
T7) stress fields were reconstructed. The succession and the plies that these dykes have been reactivated during later de-
age constraint of these events are demonstrated here. These formation since striations have been found on their surfaces.
events will be compared with those in the western margins of
the Dead Sea Rift in the Sinai sub-plate (part of the African 6.1.1.2 T1b: NE-SW SHmax
plate).
The earliest indications of displacement along the NNE-
6.1.1 T1: NE-SW SHmax SSW and WNW-ESE-trending faults are of Late Neoprotero-
zoic age. The stress regime that caused the dextral (along
This group has been divided into two sub-groups: T1a de-
NNE-SSW-trending faults) and sinistral (along WNW-ESE-
fined from the Late Neoproterozoic dykes, which have a min-
trending faults) activation of these faults has 09/053 of the
imum age of 570 Ma, and T1b defined from fault-slip data
maximum principal stress axis and is well constrained by
observed only in the Neoproterozoic crystalline basement
15 stress sites. This stage is characterised by a transten-
rocks.
sional stress regime with R’ = 1.18. All these faults have
6.1.1.1 T1a: NE-SW trending dykes been observed only in the Neoproterozoic crystalline base-
ment rocks. Therefore, this group is Late Neoproterozoic
Numerous dyke swarms have been observed only in the Neo- in age. Faults are generally associated with chlorite and/or
proterozoic crystalline basement rocks. Therefore, these epidote, which indicate deep brittle deformation. This stress
swarms represent Neoproterozoic activity. Ibrahim and Mc- field with NE-SW SHmax does not seem to have been active
Court (1995) interpreted the age of the dykes in South-west during the Cambrian.
Jordan to be 570–560 Ma. In the current study, the NE-SW- The T1b tensor group has a similar direction to the T1a
trending dykes are interpreted to represent a minimum age of group constructed from the NE-SW-trending faults. Both
570 Ma. show a transtensional stress regime. Therefore, the fault-slip
Four tensors have been constructed from the NE-SW- data of the T1b sub-group are interpreted to be related to the
trending dykes. The results indicate that this sub-group emplacement of the Neoproterozoic NE-trending dykes.
is characterised by a transtensional stress regime with an
N062E direction of the maximum principal stress axis
6.1.2 T2: N-S SHmax
(SHmax ). The direction of the maximum principal axis co-
incides with the trends of the dykes.
This group has also been divided into two sub-groups: T2a
Most of the dykes have sharp linear fault contacts with
and T2b.
the Neoproterozoic crystalline basement rocks, which im-U. Zain Eldeen et al.: Tectonic evolution in the Wadi Araba Segment of the Dead Sea Rift 77
6.1.2.1 T2a: NNE-SSW to N-S trending dykes This stage corresponds to the Syrian Arc Stress Field
(SAS), which has a SHmax oriented E-W to ESE-WNW in
A limited amount of N-S-trending dykes have been observed adjacent regions of Israel. Eyal and Reches (1983) first ob-
in the Neoproterozoic crystalline basement rocks. These tained the Late Cretaceous Syrian Arc Stress Field (SAS)
dykes crosscut the NE-SW-trending dykes and hence are with maximum horizontal compression axis (SHmax ) trending
younger. The N-S-trending dykes have a maximum age of between E-W to ESE-WNW. However, they claimed that the
560 Ma. Due to their limited amount, only one tensor has SAS extended up to the Middle Miocene. Eyal (1996) argued
been constructed with 19 measurements. The results indi- that SAS and DSS are fluctuating since Middle Miocene to
cate that this sub- group is characterised by a transtensional the Resent. Ron and Eyal (1985) explained young mesostruc-
stress regime with 20/193 of the maximum principal stress tures associated with E-W to WNW SHmax by transpression
axis (SHmax ). This direction coincides with the trends of the that resulted from the relative N-S movement between the
dykes. African and Arabian plates along the NNE trending Yam-
muneh segment of the Dead Sea Transform.
6.1.2.2 T2b: N-S SHmax Field relations define the age of the stress regime (T3) as
not younger than Cretaceous. The mesostructures related to
The observed structures resulting from a N-S SHmax , which the Syrian Arc Stress (SAS) in the current study were found
only affects the Neoproterozoic crystalline basement rocks, in rocks as young as Upper Cretaceous.
are N-S to NNE-SSW sinistral strike-slip faults and E-W re-
verse faults. The tensors of this group have been constructed 6.1.4 T4: NW-SE SHmax
from fault planes covered by chlorite or/and epidote, that
Tensors of this group have been obtained from up to
have been observed only in the Neoproterozoic crystalline
Palaeocene/Eocene sediments but not younger. The
basement rocks. The palaeostress results indicate that this
palaeostress results indicate that this stage is characterised
stage is characterised by a transpressional stress regime (R’ =
by a strike-slip regime (R’ = 1.31) with a 05/321 of the
1.91) with a N-S (02/352) orientation of the maximum prin-
maximum principal stress axis (SHmax ). This direction is
cipal stress axis (SHmax ).
well constrained by 20 stress sites. The major consequence
The SHmax of the T2b tensor sub-group has a similar di-
of the NW-SE SHmax stage was the development of conju-
rection to the N-S-trending dykes. Therefore, the fault-slip
gated strike-slip fault sets, oriented NNW-SSE (sinistral) and
data of the T2b sub-group are considered as related to the
WNW-ESE (dextral). The palaeostress results suggest that at
emplacement of these dykes.
about the transition from Cretaceous to Miocene a clockwise
The effects of the NE-SW SHmax and N-S SHmax deforma- rotation of about 50◦ of the stress field took place.
tion were observed in the Neoproterozoic crystalline base- The tensors represented by this stage have been con-
ment rocks only. Therefore, these two groups are Late Neo- structed from fault-slip data and the NW-SE trending do-
proterozoic in age. The NE-SW SHmax (T1) corresponds to leritic dykes. The NW-SE trending dykes (with a probable
the major NE trending dyke swarm, while the N-S SHmax age of 20 Ma) seem to have been emplaced in this stress field.
(T2) corresponds to a minor and younger N-S trending dyke Therefore, a Miocene age for this stage is possible, but this
swarm. Large amounts of Late Neoproterozoic structures NW-SE compression does not seem to have been active dur-
have been reactivated during Tertiary times. Good examples ing the Pleistocene. The extension associated with the em-
are the N-S to NNE-SSW trending faults. On the other hand, placement of these NW-SE trending dykes is normal to this
the formation of the Dead Sea Rift during the Miocene oc- direction. Thus, the dykes in the study area indicate subhor-
curred along the N-S to NNE-SSW trending fault system, izontal extension in NE-SW direction. This extension axis
which were reactivated as sinistral fault. agrees in general with the trend of σ 3 of the Dead Sea Stress
These Late Neoproterozoic stages of the study area have Field (DSS). A system of long NW-SE trending dykes has
not been recognised in earlier work, neither on the eastern been identified in the southern Sinai and dated by K-Ar at
nor on the western side of the Dead Sea Rift. 18–22 Ma (Bartov et al., 1980).
Eyal and Reches (1983) reveal a similar stress regime in
6.1.3 T3: E-W SHmax the western margins of the Dead Sea Rift in the Israel-Sinai
subplate. This implies a regional control of stress regimes
The tensors of this group have been obtained from rocks with rather than some local control. When considering the re-
an age up to the Cretaceous, and no similar palaeostress ten- gional stress field responsible for the formation of tectonic
sors were recorded in rocks younger than the Cretaceous. structures, it is important to conduct large-scale investiga-
The palaeostress analysis indicates that this stage is charac- tions over an area, which is wider than the object to be stud-
terised by a strike-slip stress regime (R’ = 1.51) with a hori- ied. The interaction of the Arabian and the African plates is
zontal 05/271 of the maximum principal stress axis (SHmax ). responsible for the formation of the Dead Sea Rift and the
This direction is well constrained from 15 stress sites. In deformation of its margins. The Sinai- Negev Shear Zone,
the region of investigation, it is expressed mainly by NW-SE which cuts through Early Miocene dykes, is laterally dis-
trending sinistral faults and NE-SW trending dextral faults. placed about 105 km along the Dead Sea Rift (e.g. Quen-78 U. Zain Eldeen et al.: Tectonic evolution in the Wadi Araba Segment of the Dead Sea Rift
nel, 1959). Therefore, the Dead Sea Rift post-dates the Early of the Arabian Plate occurred in the Plio-Pleistocene. Hence,
Miocene (Bartov, 1974). Some investigators suggest that ac- the T4 tensors (NW-SE SHmax ) were active in the Miocene,
cording to local sedimentary and geomorphic evidence and while the T5 tensors (NNW-SSE to N-S SHmax ) are related
magnetic anomalies in the Gulf of Aden, the main phase of to the Plio-Pleistocene.
shear along the rift initiated during the Middle Miocene (e.g.
Garfunkel, 1981). Others have proposed that the Dead Sea 6.1.6 Extensional stress regimes
Rift is not older than the Pliocene or even the Pleistocene
(e.g. Picard, 1943). The results show that the study area was affected by two
The left-lateral motion along the Dead Sea Rift fits into extensional stress regimes (T6 and T7). The stratigraphic
the NW-SE stress regime in which left-lateral shear acts on control is very clear, and a Post-Miocene age (Pliocene-
roughly N-S trending faults. Therefore, the NW-SE SHmax is Pleistocene, covering the last 6 Ma) is proposed. The min-
related to the Dead Sea Stress Field (DSS). imum stress axis (σ 3) trended first E-W, then N-S, while the
σ 1 was mostly vertical. The palaeostress results show that
6.1.5 T5: NNW-SSE to N-S SHmax the N-S Shmin (E-W SHmax ) is younger than the E-W Shmin
(N-S SHmax ). Faults constructed the T7 group are cutting
This stage represents a group of tensors obtained from rocks those of T6 group. These extensional stress regimes have
with an age up to the Miocene. The Late Neoproterozoic been inferred from fault-slip data observed in the Dana Con-
transpressional stress regime resembles the Pleistocene one glomerates.
with the orientation of the maximum horizontal stress axis All tensors representing these two extensional stress
(σ 1) as nearly N-S. A combination of the ages of outcrops regimes are restricted to the margin of the Dead Sea Rift.
and chlorite or/and epidote mineralization on the fault planes Thus, it is considered as a local stress field, which deformed
made it possible to separate these two main phases. The N- the eastern margins of the rift. We propose that these exten-
S SHmax of the Late Neoproterozoic were constrained from sional stress regimes have been superimposed on the Dead
chlorite or/and epidote on fault planes that were found only in Sea Stress Field (DSS).
the basement crystalline rocks. In Wadi Rahma, faults in the
basement with chlorite or/and epidote mineralization seemed 6.1.6.1 T6: N-S SHmax (E-W Shmin )
to be intersected by the base of the Cambrian sandstones.
The palaeostress results show the existence of a Pleistocene
Moreover, some other faults, affecting the basement and the
extensional stage (T6) with a N-S SHmax (E-W Shmin ) stress
Cambrian are filled by calcite veins or coated by haematite.
regime. This stage is characterised by SHmax oriented N177E
The dominant SHmax direction for this stage is NNW-SSE
and is well constrained by 5 stress sites, which represents the
to N-S. The stress regime is transpression (R’ = 1.79). A
T6 tensors group. This stage caused normal faulting along
major change in tectonic regime occurred in the Pleistocene:
a NNE-SSW trend and reactivated NE-SW trending faults
a 38◦ clockwise rotation of the SHmax direction (from NW-
by sinistral movements. A significant normal movement has
SE to NNW-SSE) and a change of the stress regime from
been found, combined with a small left-lateral component.
strike-slip (R = 1.31) to transpressional (R’ = 1.79). This
The observed structures resulting from E-W extension that
change caused sinistral movement along NE-SW trending
affect the Dana Conglomerates demonstrate a Late to Post-
faults, dextral movement along NW-SE trending faults and
Pleistocene age for this stage. The age of the Dana Con-
thrust along ENE-WSW trending faults.
glomerates is not precisely determined. This stage occurred
Eyal and Reches (1983) and Eyal (1996) recognised a re- after the deposition of the Dana Conglomerates.
gional stress field with SHmax trending between NNW-SSE The T6 extensional stress regime is restricted to the margin
and N-S in the Israel-Sinai sub-plate. They attributed this of the Wadi Araba fault. It is therefore considered as a local
stress field to the Miocene to Holocene Dead Sea Stress Field stress field associated with the latest stage of the Dead Sea
(DSS). The present study indicates that stress which had a Rift. This extension occurred after a transpressional stress
trend similar to that of the Dead Sea Stress Field (DSS) was regime (NNW-SSE to N-S SHmax ) during which σ 1 is hori-
active beyond the time span suggested for the DSS by Eyal zontal; then the maximum principal stress axis (σ 1) became
and Reches (1983) and Eyal (1996). vertical. The E-W Shmin stress regime produced the opening
Our results indicate that the Dead Sea Stress Field of the Dead Sea Rift.
(Miocene-Pleistocene) has the main horizontal compres-
sional axis (σ 1) trending NW in the Miocene and NNW to 6.1.6.2 T7: E-W SHmax (N-S Shmin )
N-S in the Pleistocene. If we accept the suggestion of Quen-
nel (1959) that the sinistral movement of 107 km along the The palaeostress results indicate that this stage is charac-
Dead Sea Rift took place in two stages, we propose that the terised by an extensional stress regime with 02/090 of the
tensors T4 and T5 are related to these two stages. Quennel maximum principal stress axis (SHmax ). This direction is
(1959) suggested that the first stage with a 62 km displace- well constrained by 4 stress sites. This stage affected also the
ment took place in the latest Oligocene-Early Miocene with a Dana Conglomerates. It caused E-W to ESE-WNW normal
3◦ anticlockwise rotation of the Arabian Plate, while the sec- faulting and reactivated NNE-SSW normal faults and NW-
ond displacement of 45 km with a 2.5◦ anticlockwise rotation SE sinistral faults.U. Zain Eldeen et al.: Tectonic evolution in the Wadi Araba Segment of the Dead Sea Rift 79
Table 2. Summary of the time constraints for the determined palaeostress directions in the Dead Sea Rift regions
Current Eyal & Ron & Eyal Badawy &
results Reches Eyal Horvath
Series (1983) (1985) (1996) (1999);
(East of (West of (West of (West of Muller et al.
the Rift) the Rift) the Rift) the Rift) (1997)
Holocene NW-SE SAS NW-SE
(Present-day SHmax ESE-WNW SHmax
stress field) SHmax
T7: E-W N-S
Post- SHmax Shmin
Pleistocene T6: N-S
SHmax
Miocene / T5: NNW- NNW-SSE NNW-SSE
Pleistocene SSE to N-S to N-S to N-S
(DSS) SHmax SHmax SHmax
Miocene T4: NW-SE NW-SE
(DSS) SHmax SHmax
Late T3: E-W E-W to ESE- ESE-WNW
Cretaceous SHmax WNW SHmax
(SAS) SHmax
T2: N-S
Late Neo- SHmax (570)
proterozoic T1: NE-SW
SHmax (560)
N-S extension produced E-W normal faults in South- Sea Stress (DSS) was active from the Miocene onwards till
western Jordan. This stress is restricted to the margin of the today.
Dead Sea Rift. Thus it is considered as a local stress field Table 2 represents a summary of the time constraints for
which deformed the eastern margins of the rift. This led to the determined palaeostress directions in the Dead Sea Rift
N-S extension between the African and Arabian plates. region. It shows the palaeostress directions of this study and
This stress regime is compatible with the stress regime ob- the previous regional investigations.
tained in the western side of the Dead Sea Rift by Ron and In summary, the evolution of the Dead Sea Rift shows a
Eyal (1985). They recognised an extensional stress regime general clockwise rotation of the SHmax axis with time. Two
with σ 1 vertical and σ 3 (Shmin ) oriented N-S. They attributed stages can be distinguished in this rotation. The older one
this extension to have been active since post-Middle Pliocene marks the change of the SHmax axis from E-W to NW-SE at
times producing E-W normal faults. 50◦ rotation, taking place in the Miocene. The second one
marks the changes of the SHmax axis from NW-SE to NNW-
6.1.7 T8: Present-day Stress field SSE to N-S at 38◦ rotation, dating from the Pleistocene.
The data provided by World Stress Map (Muller et al., 1997)
indicate that the present-day Stress Field in the Dead Sea 7 Initiation and development of the Dead Sea Rift
Rift area has a NW-SE SHmax (T8). Pull-apart basins were
observed along the Wadi Araba fault indicating a strike-slip Transform faults in continents can be expected to follow pre-
regime with SHmax oriented NW-SE, but it was not possible existing zones of weakness, such as older faults that might
to constrain the orientation of this stress regime. originally have been of a different type. The current study
The evolution of the stress field from a strike-slip regime shows such a zone of weakness along N-S to NNE-SSW
in the Cretaceous to a pure extensional regime in the Pleis- trending faults that have been formed during the Late Neo-
tocene and then back again to a strike-slip regime in the proterozoic. This implies that the Late Neoproterozoic struc-
present days is evidenced for the Dead Sea Rift. This means tures were reactivated during the Cainozoic and controlled
that sinistral movements compatible with the Dead Sea Stress the recent movement along the Dead Sea Rift. The move-
are still active. ment along the Dead Sea Rift began in Tertiary times. The
The palaeostress tensors reconstructed from the fault-slip current study provides indications of a possible initial break-
data in the study area indicate that the Syrian Arc Stress up of the African-Arabian Shield already in the Late Neopro-
(SAS) affected pre-Upper Cretaceous rocks, while the Dead terozoic that was reactivated in the Tertiary.80 U. Zain Eldeen et al.: Tectonic evolution in the Wadi Araba Segment of the Dead Sea Rift
The E-W compression (SAS, our stage T3) is acting at a stress regime direction have been inferred. One took place
high angle with the Dead Sea Rift. It did not reactivate the rift in the Miocene from E-W to NW-SE at about 50◦ rotation
but it created a series of conjugated strike-slip faults, witness- and the second in the Pleistocene from NW-SE to NNW-SSE
ing the crustal weakness in this area before the development at about 38◦ rotation. The palaeostress data also show the
of the rift. appearance of E-W extension in the Late Pleistocene, super-
The current study shows the existence of both strike-slip imposed on the Dead Sea Stress Field (DSS). We therefore
and normal faulting. The strike-slip faults are vertical to sub- suggest that the Dead Sea Rift system has a combination of
vertical with horizontal striations, which can not create the strike-slip and dip-slip movements.
depression. The normal faults are inclined at about 60◦ with
a dip-slip sense that created the rift. Therefore, we propose Acknowledgements. The authors thank the PEACE program and
that the Dead Sea–Wadi Araba–Gulf of Aqaba depression the Al Azhar University of Gaza for the financial support given to
has undergone both strike-slip (pull-apart type) and exten- Usama Zain Eldeen through a Ph.D scholarship during the research
sional (graben type) tectonics, in general a transcurrent plate period. They also thank the Ghent University and the Royal Mu-
boundary between the Arabian and African plates. Extension seum for Central Africa, Belgium, for providing financial support
for the fieldwork.
seems to be subsequent to initial strike-slip reactivation.
8 Conclusions References
This study has pointed out the tectonic evolution of the Wadi Angelier, J.: Fault slip analysis and palaeostress reconstruction, in:
Hancock, P. L. (Ed.): Continental Deformation, Pergamon, Ox-
Araba Segment of the Dead Sea Rift in terms of deformation
ford, 101–120, 1994.
stages and related stress fields. A succession of seven brit- Angelier, J. and Mechler, P.: Sur une méthode graphique de
tle tectonic regimes has been established from microtectonic recherche des contraintes principales également utilisable en tec-
observations and structural studies on faults from Neopro- tonique et en séismologie: 1a méthode des dièdres droits, Bull.
terozoic to Pleistocene times in the eastern margins of the Soc. Géol. France, 7(19), 1309–1318, 1977.
Dead Sea Rift, South-west Jordan. They are characterised by Badawy, A. and Horvath, F.: Recent stress field of the Sinai subplate
the following succession of stress fields. region, Tectonophysics, 304, 385–403, 1999.
The first two tensor groups were obtained from the Late Bahat, D. and Rabinovitch, A.: The initiation of the Dead Sea Rift,
Neoproterozoic (between 570 and 560 Ma old) dyke swarm, Journal of Geology, 5, 591–601, 1983.
and the fault-slip data related to this dyke emplacement. Bartov, J.: A structural and paleographic study of the Central Sinai
faults and domes, Ph.D. thesis, Hebrew University, Jerusalem
The other tensor groups are related to Cretaceous and
(English abstract), 1974.
younger deformation stages. The third stage (T3) has a Bartov, J., Steinitz, G., Eyal, M., and Eyal, Y.: Sinistral movement
strike-slip stress regime with an E-W SHmax that affected along the Gulf of Aqaba – Its age and relation to the opening of
all pre-Tertiary series. This represents the Syrian Arc Stress the Red Sea, Nature, 285, 220–222, 1980.
Field (SAS). Bender, F.: Geological map of Jordan – 1:250 000 sheets Amman
The next stage (T4) is characterised also by a strike-slip and Aqaba-Ma’an, Hannover (Bundesamt für Bodenforschung),
stress regime, but with a NW-SE SHmax . It affected the 1968.
Palaeocene/Eocene rocks but not Miocene rocks, while NW- Bender, F.: The shear along the Dead Sea Rift: Discussion, Royal
SE trending dykes (with a probable age of about 20 Ma) Society of London Philosophical Transaction, series. A, 167,
seem to have been emplaced in this stress field. Therefore, a 127–129, 1970.
Bender, F.: Geology of the Arabian Peninsula, Jordan., 36 pp.,
Miocene age for this stage seems plausible. It is followed by
1975.
a transpressional stage (T5), with a NNW-SSE to N-S SHmax
Ben Menahem, A., Nur, A., and Vered, M.: Tectonics, seismicity
affecting rocks with an age up to the Plio-Pleistocene. These and structure of the Afro-Eurasian junction – The breaking of an
last two stages (T4 and T5) correspond to the Dead Sea Stress incoherent plate, Physics of the Earth and Planetary Interiors, 12,
Field (DSS). 1–50, 1976.
In addition, post-Pleistocene extensional stages (T6 and Bentor, Y. K. and Vorman, A.: A structural contour map of Israel,
T7) were evidenced from the fault-slip data that affected the scale 1:250 000 with remarks on its dynamic interpretation, Israel
Dana Conglomerates with T7 being the youngest. T6 has an Geological Survey Bulletin, 7, 10 pp, 1954.
E-W Shmin and T7 has a N-S Shmin . Bott, M. H. P.: The mechanism of oblique slip faulting, Geological
The Late Pleistocene-Holocene sinistral strike-slip defor- Magazine, 96, 109–117, 1959.
Delvaux, D.: The TENSOR program for palaeostress reconstruc-
mation (T8) related to the Wadi Araba Fault shows that
tion: examples from the East African and the Baikal rift zones,
strike-slip movements compatible with the Dead Sea Stress
Terra Abstract, Abstract Supplement No.1, to Terra Nova, 5, 216,
field are still active. 1993.
It can be concluded that the new palaeostress data evidence Delvaux, D., Moeys, R., Stapel, G., Petit, C., Levi, K., Mirosh-
a general clockwise rotation with time of the SHmax axis nichenko, A., Ruzhich, V., and San’kov, V.: Palaeostress recon-
from an E-W trend in the Cretaceous towards a N-S trend structions and geodynamics of the Baikal region, Central Asia,
in the Pleistocene. Two regional progressive rotations of the part II, Cenozoic rifting, Tectonophysics, 282, 1–38, 1997.You can also read