Parametric Study of Dumbbell-Shaped Specimens for Compression Testing of Ceramics Using Finite Element Analysis - by Adam Taylor and John Pittari ...
←
→
Page content transcription
If your browser does not render page correctly, please read the page content below

ARL-TR-9028 ● AUG 2020

Parametric Study of Dumbbell-Shaped
Specimens for Compression Testing of
Ceramics Using Finite Element Analysis

by Adam Taylor and John Pittari

Approved for public release; distribution is unlimited.
NOTICES

                                    Disclaimers

The findings in this report are not to be construed as an official Department of the
Army position unless so designated by other authorized documents.

Citation of manufacturer’s or trade names does not constitute an official
endorsement or approval of the use thereof.

Destroy this report when it is no longer needed. Do not return it to the originator.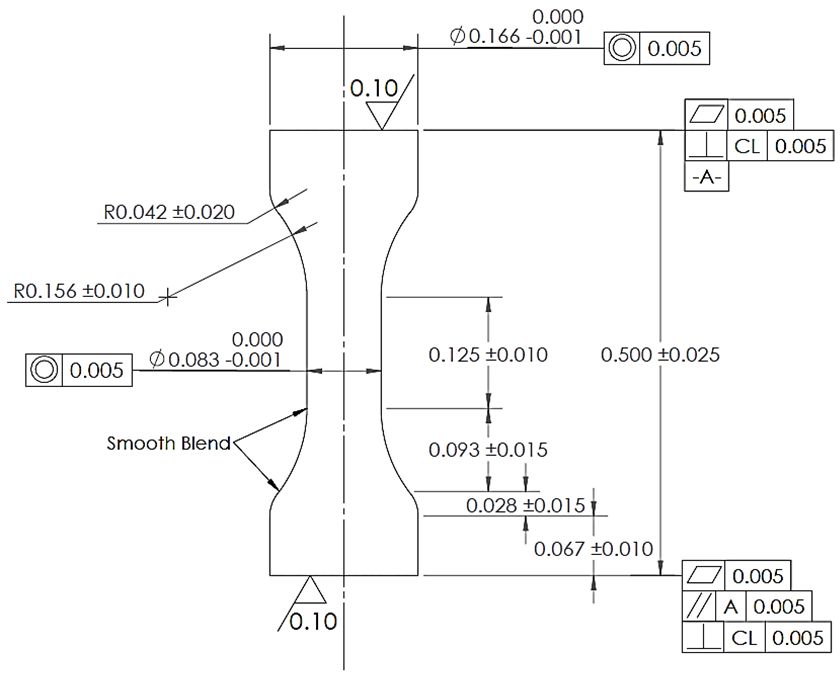
ARL-TR-9028 ● AUG 2020

Parametric Study of Dumbbell-Shaped Specimens
for Compression Testing of Ceramics Using Finite
Element Analysis

John Pittari
Weapons and Materials Research Directorate, CCDC Army Research Laboratory

Adam Taylor
College Qualified Leaders Program, Drexel University

Approved for public release; distribution is unlimited.
Form Approved
                                 REPORT DOCUMENTATION PAGE                                                                                                         OMB No. 0704-0188
Public reporting burden for this collection of information is estimated to average 1 hour per response, including the time for reviewing instructions, searching existing data sources, gathering and maintaining the
data needed, and completing and reviewing the collection information. Send comments regarding this burden estimate or any other aspect of this collection of information, including suggestions for reducing the
burden, to Department of Defense, Washington Headquarters Services, Directorate for Information Operations and Reports (0704-0188), 1215 Jefferson Davis Highway, Suite 1204, Arlington, VA 22202-4302.
Respondents should be aware that notwithstanding any other provision of law, no person shall be subject to any penalty for failing to comply with a collection of information if it does not display a currently
valid OMB control number.
PLEASE DO NOT RETURN YOUR FORM TO THE ABOVE ADDRESS.
1. REPORT DATE (DD-MM-YYYY)                             2. REPORT TYPE                                                                      3. DATES COVERED (From - To)
August 2020                                             Technical Report                                                                    30 March–18 September 2020
4. TITLE AND SUBTITLE                                                                                                                       5a. CONTRACT NUMBER
Parametric Study of Dumbbell-Shaped Specimens for Compression Testing of
Ceramics Using Finite Element Analysis                                                                                                      5b. GRANT NUMBER

                                                                                                                                            5c. PROGRAM ELEMENT NUMBER

6. AUTHOR(S)                                                                                                                                5d. PROJECT NUMBER
Adam Taylor and John Pittari
                                                                                                                                            5e. TASK NUMBER

                                                                                                                                            5f. WORK UNIT NUMBER

7. PERFORMING ORGANIZATION NAME(S) AND ADDRESS(ES)                                                                                          8. PERFORMING ORGANIZATION REPORT NUMBER
CCDC Army Research Laboratory
ATTN: FCDD-RLW-MB                                                                                                                           ARL-TR-9028
Aberdeen Proving Ground, MD 21005

9. SPONSORING/MONITORING AGENCY NAME(S) AND ADDRESS(ES)                                                                                     10. SPONSOR/MONITOR'S ACRONYM(S)
College Qualified Leaders, Drexel University
                                                                                                                                            11. SPONSOR/MONITOR'S REPORT NUMBER(S)

12. DISTRIBUTION/AVAILABILITY STATEMENT
Approved for public release; distribution is unlimited.
13. SUPPLEMENTARY NOTES
ORCID ID: John Pittari, 0000-0001-9611-3138
14. ABSTRACT
Compression strength testing of ceramics has historically been conducted using cylindrical- or cuboidal-shaped specimens due
to simplistic analysis and reduced machining costs. However, these specimen geometries tend to exhibit large amounts of
scatter and often fail from a nonuniform state of stress, rendering the strength results inconclusive. Instead, a dumbbell-shaped
compression specimen has been proposed, simulated, and utilized for such strength tests to provide better estimates of material
performance. This study reevaluates that specimen geometry via a modern finite element analysis simulation software. A
parametric study is performed to investigate how modifications to the original specimen, its associated geometry, and
simulation parameters could alter its performance during compression strength tests. High-rate testing with this specimen is
also simulated using an explicit analysis code. It was determined that alterations to the specimen geometry most affected the
performance, and it is suggested that a systematic study be carried out to identify further improvements to specimen geometry.
15. SUBJECT TERMS
ceramics, compression testing, finite element analysis, specimen geometry, stress concentration
                                                                                         17. LIMITATION               18. NUMBER            19a. NAME OF RESPONSIBLE PERSON
16. SECURITY CLASSIFICATION OF:                                                              OF                           OF
                                                                                                                                            John Pittari
                                                                                             ABSTRACT                     PAGES
a. REPORT                  b. ABSTRACT                   c. THIS PAGE                                                                       19b. TELEPHONE NUMBER (Include area code)
                                                                                                  UU                         35
Unclassified                 Unclassified                   Unclassified                                                                    (410) 306-0773
                                                                                                                                                                                         Standard Form 298 (Rev. 8/98)
                                                                                                                                                                                        Prescribed by ANSI Std. Z39.18

                                                                                                         ii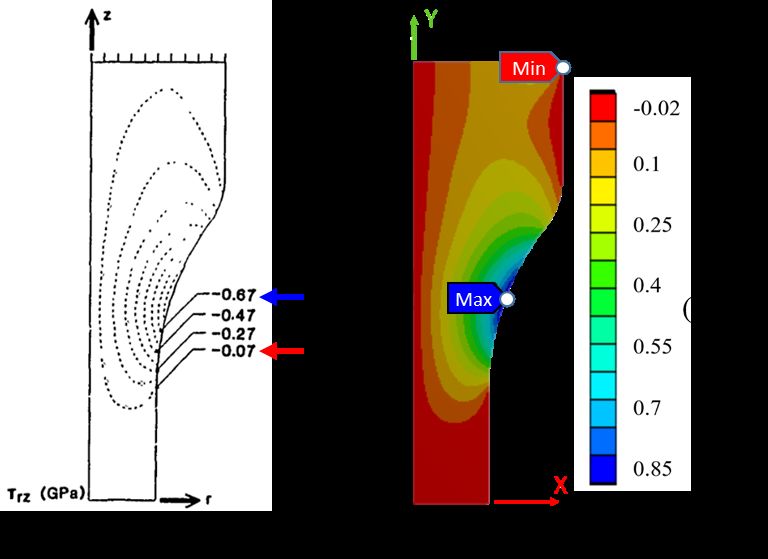
Contents

List of Figures                                             iv

List of Tables                                               v

1.   Introduction                                            1

2.   Modeling Procedure                                      2
     2.1 Generation of FEA Model                             2
     2.2 Application of Material Parameters                  5
     2.3 Model Validation (Study 0)                          6
     2.4 Comparison to Cuboidal and Cylindrical Specimens    9

3.   Results                                                10
     3.1 Study 1: Specimen Down-Scaling                     11
     3.2 Study 2: Displacement Rate                         13
     3.3 Study 3: Specimen Geometry                         13
     3.4 Study 4: Boundary Conditions                       17
     3.5 Study 5: High-Rate Loading                         20

4.   Discussion                                             21

5.   Conclusions                                            22

6.   References                                             24

List of Symbols, Abbreviations, and Acronyms                27

Distribution List                                           28

                                      iii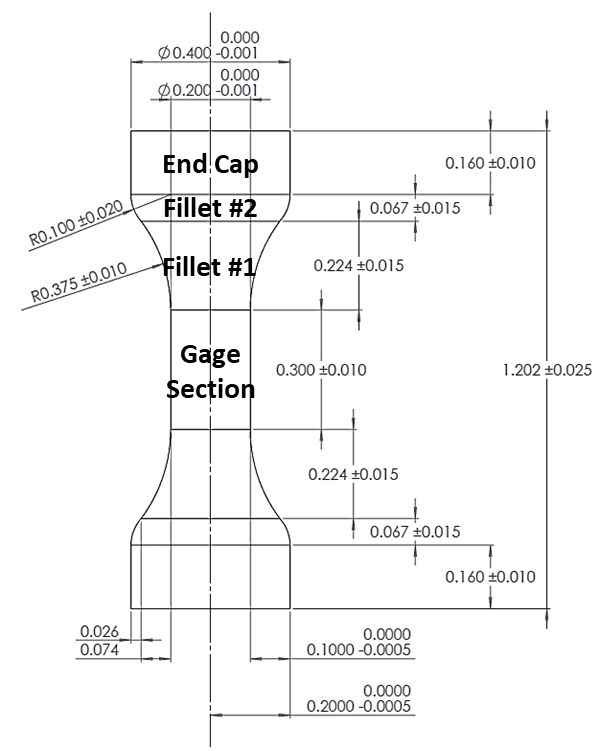
List of Figures
Fig. 1 Drawing of the dumbbell-shaped B size specimen geometry prescribed
in Dunlay et al. with noted geometric features of importance. This
geometry was used to create the baseline specimen. Units are in
inches. ................................................................................................... 3
Fig. 2 The baseline 2D axisymmetric mesh geometry. The outline of the
mesh was removed from every subsequent figure for aesthetic
reasons................................................................................................... 4
Fig. 3 Schematic of the model used in Dunlay et al. with the four highlighted
critical stress points. The locations (and magnitudes) of these points
will be compared to the baseline model generated for this study as part
of the validation procedure. .................................................................. 6
Fig. 4 Stress contour plots of the axial (compressive) stress components for
A) the literature specimen from Dunlay et al. and B) the baseline
configuration. Maximum compressive stress values are denoted in
blue, while minimum values are denoted in red. .................................. 7
Fig. 5 Stress contour plots of the shear stress components for A) the literature
specimen from Dunlay et al. and B) the baseline configuration. The
contours of maximum (blue) and minimum shear stress values (red)
are noted. The baseline agrees with the critical point for maximum
shear stress in Fig. 3. ............................................................................. 7
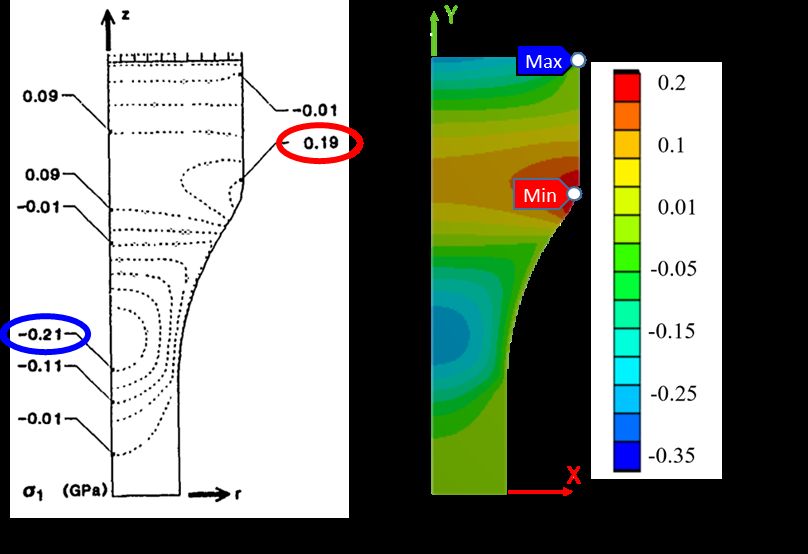
Fig. 6 Stress contour plots of the maximum (first) principal stresses for A)
the literature specimen from Dunlay et al. and B) the baseline
configuration. The contours of maximum (blue) and minimum first
principal stress values (red) are noted. .................................................. 8
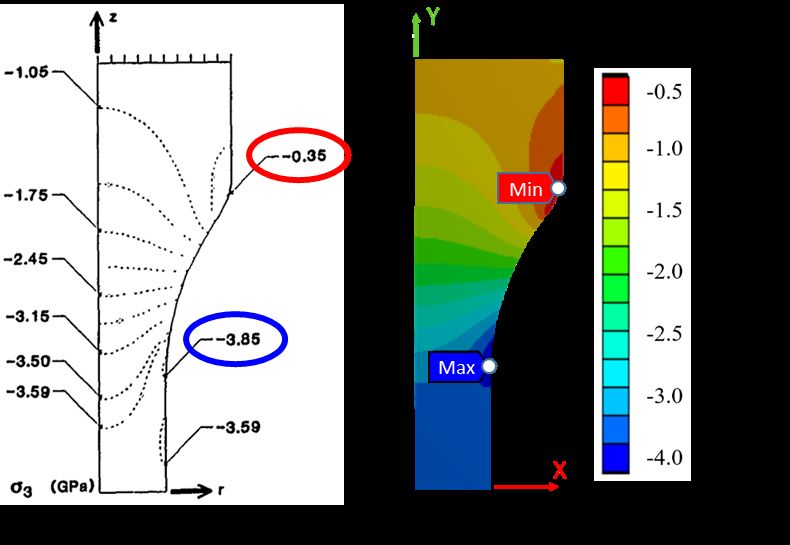
Fig. 7 Stress contour plots of the minimum (third) principal stresses for A)
the literature specimen from Dunlay et al. and B) the baseline
configuration. The contours of maximum (blue) and minimum third
principal stress values (red) are noted. .................................................. 8
Fig. 8 Specimen geometries for the A) cuboid (3D) and B) cylindrical (2D
axisymmetric) generated for simulation with the current model and
comparison to the baseline dumbbell geometry.................................... 9
Fig. 9 Plots of the stress contours for the A) cuboid (plane-stress 2D view)
and B) cylindrical specimens. The dashed black outline is the portion
considered for the gage section and is approximately one-quarter of
specimen length. The average stress across this region was taken as the
gage section compressive stress value. ............................................... 10
Fig. 10 Detailed drawing of Configuration A geometry (inches). This
specimen geometry is designed to be easily extracted from
conventional ceramic armor plate geometries. ................................... 11
Fig. 11 Modified dumbbell geometries of A) Configuration G and B)
Configuration H. The first fillet radius is maximized in both
iv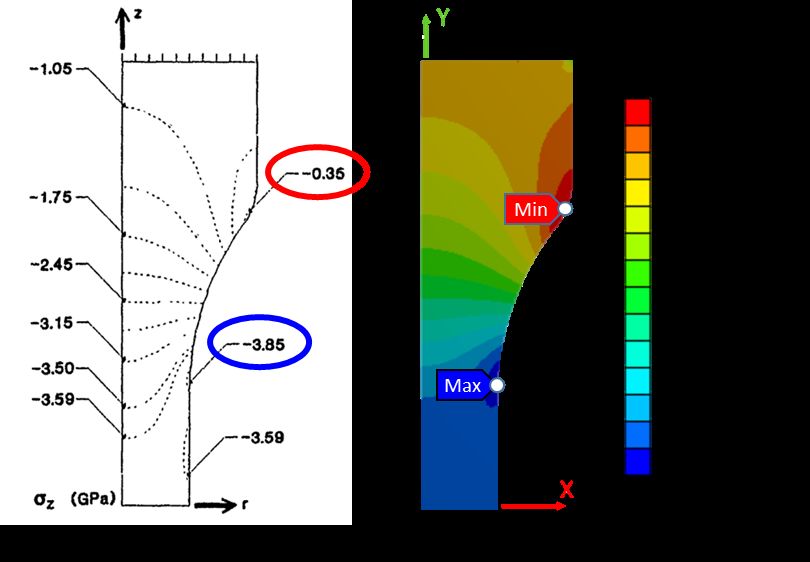
conditions. However, in Configuration G, the second fillet extends to
          the end of the dumbbell, negating the end cap in the baseline
          geometry. In Configuration H, the end cap from the baseline geometry
          is maintained, but the second fillet radius is maximized. ................... 15
Fig. 12   Plot of percent increase in stress at the concentration point vs.
          normalized gage length for Configurations A, E, F, G, and H (blue)
          compared to the “B” specimens (red) from Dunlay et al. (1989) and
          the baseline specimen in this study (2020). The gage lengths have been
          normalized to the total specimen length. ............................................ 16
Fig. 13   Detailed drawing of the edge chamfer modification to the geometry
          used for Configuration I to attempt to reduce the interfacial stress
          concentration at this point in the geometry of Configuration A ......... 16
Fig. 14   Axial stress contour plots for A) Configuration A and B)
          Configuration I with the added edge chamfer..................................... 17
Fig. 15   Detailed view of the stress contour plots of the axial (compressive)
          stress component for A) Configuration J (flush WC platen) and B)
          Configuration K (overhanging WC platen). A dotted black line has
          been added to denote the boundary of the WC platen. ....................... 18
Fig. 16   Stress contour plot of the axial (compressive) stress component for
          Configuration L with a frictionless loading interface ......................... 19
Fig. 17   Stress contour plot of the axial (compressive) stress component for the
          Configuration M dynamic study ......................................................... 20

List of Tables
Table 1   Material properties used for the simulations......................................... 4
Table 2   Configurations A, B, and C specific input parameters as varied from
          the baseline.......................................................................................... 12
Table 3   Configuration D specific input parameters as varied from the
          baseline ............................................................................................... 13
Table 4   Configurations E, F, G, H, and I specific input parameters as varied
          from the baseline ................................................................................. 13
Table 5   Configurations J, K, and L specific input parameters as varied from the
          baseline ............................................................................................... 17
Table 6   Maximum and gage section conditions of each configuration at the
          time of failure...................................................................................... 21

                                                      v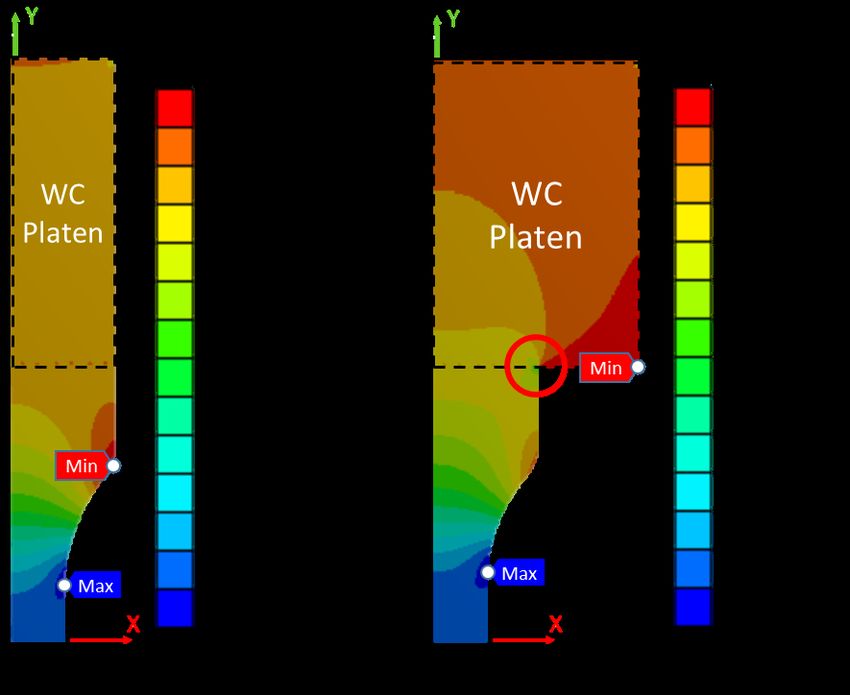
1.    Introduction

The evaluation of a ceramic’s material properties via compression testing has for a
long time been conducted using cylindrical or cuboidal specimens. However,
during testing, specimens of cylindrical or cuboidal shape typically exhibit stress
concentrations at the interface between specimen and the loading platen, causing
them to fail prematurely, and in a nonuniform manner, leading to underestimated
material performance.1–3 In the 1980s, a dumbbell-shaped specimen was proposed
to minimize these stress concentrations and produce more accurate values of
material properties.4,5 There had been some historical precedent investigating the
potential advantages of using a dumbbell-shaped specimen for these types of
tests.1,6,7 Since then, several researchers have studied the behavior of dumbbell
specimens, both computationally and experimentally, with varying loading
conditions and made comparisons to other similar studies as well as tests using
cylindrical and cuboidal specimens.8–13 Their results show high reproducibility of
material properties using a dumbbell specimen as well as highlight the pitfalls in
using cuboidal or cylindrical specimens for determining material performance. This
study attempts to validate the dumbbell design, as proposed by Tracy4 and used by
Dunlay et al.8 for both simulations and experiments, and identify the effects of
making modifications to the specimen and testing configuration. Computer
simulations using a finite element analysis (FEA) code will be performed to test the
bounds of each input parameter of a typical dumbbell compression test. The specific
design features considered during a dumbbell compression test were separated into
five studies to be evaluated parametrically:

     1) Effect of scaling the specimen (Configurations A–C)

     2) Effect of changing displacement rate (Configuration D)

     3) Modification of specimen geometry (Configurations E–I)

     4) Modification of the boundary conditions (Configurations J–L)

     5) Effect of high-rate loading (Configuration M)

The first four studies were limited to quasi-static (QS) testing to isolate issues
associated with explicit modelling of dynamic tests. The last study examined the
effect of high-rate loading on performance of the dumbbell specimen. This was
performed because ceramic materials are known to exhibit rate sensitivity when
experiments are performed across a range of strain rates. Several of the
aforementioned studies have investigated the use of dumbbell-shaped specimens
for evaluating high-rate properties using split-Hopkinson pressure bar apparatuses,
further supporting the final study.9,11–15

                                         1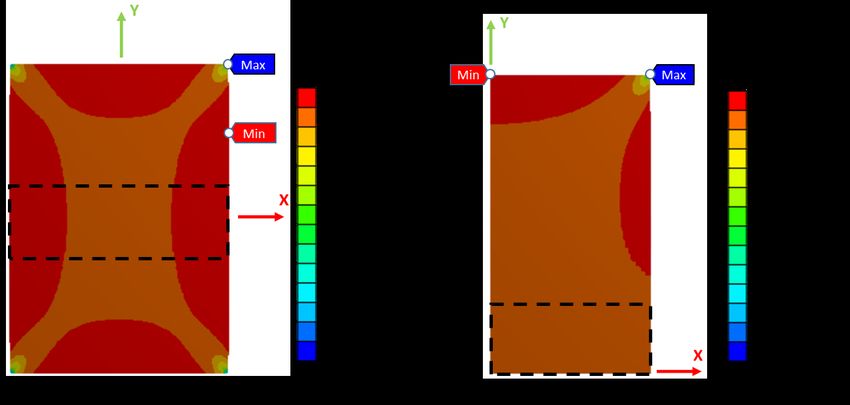
Each study parametrically changes an input variable during the setup of a
compression test to evaluate the dominant features in design. For example,
changing the overall size or shape of the dumbbell specimen may more
substantially affect its performance than changing the displacement rate or
configuration of the loading interface. A distinction like this could reduce the
resources spent on enhancing the precision of the loading interface and allow more
resources to be allocated on perfecting specimen geometry.

One consideration noticed during the analysis of dumbbell compression testing was
the presence of a stress concentration located just outside of the gage section along
the first fillet.8 Quantifying the severity of each configuration’s stress concentration
at this location is desirable and is used to evaluate the performance of each
configuration. More specifically, the magnitude of the axial (or compressive) stress
and the cross-sectional area at that location during the onset of failure is calculated
for each configuration. The values obtained from this region of maximum stress
will then be compared to that of the gage section. The configuration that produces
minimal differences in compressive stress and cross-sectional area between these
two locations will provide the most accurate measurement of material properties
during physical compression tests.

2.    Modeling Procedure

2.1 Generation of FEA Model

Each dumbbell specimen and respective testing configuration was simulated using
ANSYS, a finite element modeling and simulation software. The first step in
simulating a compression test involved recreating the dumbbell size B specimen
geometry from Dunlay8, which will henceforth be referred to as the baseline
configuration (Fig. 1).

                                           2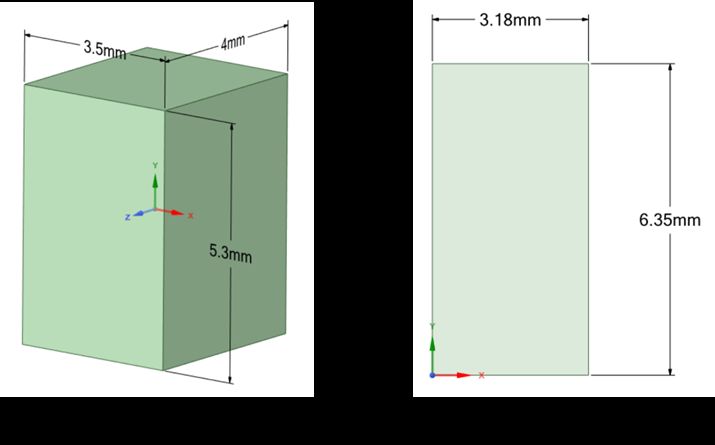
Fig. 1     Drawing of the dumbbell-shaped B size specimen geometry prescribed in Dunlay et
al.8 with noted geometric features of importance. This geometry was used to create the baseline
specimen. Units are in inches.

ANSYS was used to create this baseline specimen geometry in addition to the other
geometries evaluated in subsequent studies. Each specimen’s geometry was
modeled in 2D and consisted only of the upper-right quadrant of the specimen (seen
in Fig. 2) to facilitate the use of an axisymmetric solver. The axisymmetric solver
simulates 3D effects while allowing a greater resolution of elements on the 2D
plane. Before inputting boundary conditions and external loads, a grid mesh was
generated for each model (Fig. 2). Default settings were mostly used to calculate
these meshes; however, the element size was reduced to 100 µm (0.004 inch) for
better resolution, and the mesh was calculated using a “face meshing” scheme. Each
configuration used this mesh geometry.

                                              3
Fig. 2 The baseline 2D axisymmetric mesh geometry. The outline of the mesh was removed
from every subsequent figure for aesthetic reasons.
Next, a “static structural” (i.e., QS) analysis was conducted for Configurations A–
L. Two displacement constraints were placed on each specimen: one on the top that
displaced the specimen at 0.25 mm/min, consistent with the crosshead displacement
rate used for compression experiments in Dunlay8, while restricting movement in
the x-direction (assuming infinite friction per Dunlay8), and another on the bottom
(midpoint of the full specimen) that restricted movement only in the y-direction
(rolling support). For Configurations J and K, a tungsten carbide (WC) platen was
instead displaced (at the same provided displacement rate) adjacent to the
specimen’s end caps to investigate the effect of a loading platen on the stress
distribution at the interface with the specimen. The material properties for the WC
insert can be found in Table 1, which were extracted from the same properties for
the WC inserts used in Dunlay8. For Configuration L, a frictionless boundary
condition was added to the top of the specimen to evaluate the effect of friction on
dumbbell performance.
Table 1 Material properties used for the simulations
Property CAP3-Al2O316 WC Inserta 8
Density (kg/m3) 3900 14700
Young’s modulus (GPa) 370 600
Poisson’s ratio 0.22 0.28
Bulk modulus (GPa) 220 450
Shear modulus (GPa) 152 230
a
Kennametal Grade K3406 (WC-7.8%Co)
4An explicit dynamic test was also simulated using ANSYS’s simulation software.
Configuration M’s geometry (the same as the baseline) was imported into the new
solver with identical parameters to the baseline model. However, a displacement
rate of 12 m/s, an approximation of the experimentally reached particle velocity
during a high-rate compression test, such as in a split-Hopkinson pressure (a.k.a.
Kolsky) bar experiment, was applied to the top edge of the end cap. A displacement
condition was again placed on the bottom (midpoint of the full specimen) to restrict
movement in the y-direction. The velocity was ramped to simulate the use of a pulse
shaper (i.e., a constant velocity of 12 m/s was reached 250 µs into testing), but
failure occurred well before this plateau value was reached.
2.2 Application of Material Parameters
The final step before executing the model was to apply a set of material
parameters/properties to the geometry. The original studies both investigated an
older vintage of alumina with 94% purity, Coors Porcelain Company’s (now called
CoorsTek) AD-94.4,8 The same company has a more modern alumina with higher
purity (99.5%) that is also considered their “armor-grade” version, Ceramic Armor
Process 3 (CAP3). This is a material of special interest to the Army and has a similar
non-armor grade version, AD-995, that has been extensively studied in literature.
The material properties obtained from the manufacturer were used in this study and
can be found in Table 1 along with the properties for the WC insert, taken from
Dunlay8, described previously.
In ANSYS, each specimen was loaded up to its experimentally derived compressive
strength from the testing of the dumbbell-shaped specimen, as no fracture
mechanics were applied in these simulations to determine failure. Therefore, the
failure strength observed in the QS compression tests of Dunlay8, 4.0 GPa, was
used as the point of failure for studies 1–4. For dynamic testing, the upper limit of
the compressive failure strength observed in Swab and Quinn,10 4.9 GPa, was used
for Study 5.
When this failure stress was reached in the simulated specimen, the magnitude of the
maximum axial stress and the cross-sectional area at its location in the specimen were
extracted. In addition to these values, the average gage section axial stress and its
cross-sectional area were extracted as well. The important consideration is how the
stress concentration is behaving right at the onset of failure, since its behavior at this
point will influence the performance of the specimen. So, throughout the remainder
of this study, results are assumed to have been taken right at the onset of failure based
on each configuration’s experimentally derived compressive strength—that is, the
maximum axial stress at the onset of failure during a physical compression test.
52.3 Model Validation (Study 0)
After successful generation of the baseline model and completion of the simulation,
a comparison to similar FEA simulation results observed in Dunlay8 was performed
as a validation test. Four critical points of the various maximum stress locations
were noted in Dunlay8 and are presented again in Fig. 3.
Fig. 3 Schematic of the model used in Dunlay et al.8 with the four highlighted critical stress
points. The locations (and magnitudes) of these points will be compared to the baseline model
generated for this study as part of the validation procedure.
Matching the locations of these critical stresses and comparing the various stress
and strain distribution plots presented in that work are the metrics by which the
current model will be evaluated and, hopefully, validated. The first comparison,
and potentially the most important, is axial stress distributions (Fig. 4).
As discussed in Dunlay8, an area of particular interest in these specimens is the
transitional region between the gage section and first fillet, where the maximum
axial (compressive) stress contour can be seen in both plots in Fig. 4. The current
simulation also confirms this critical stress location with Fig. 3. The maximum axial
stress in the literature specimen at failure was 3.95 GPa while the gage section only
exhibited an average axial stress of 3.59 GPa.8 This disparity yields a 10% increase
in stress between the stress concentration and the gage section. Similarly, the
baseline specimen used in this study experienced an increase in stress of 9.4%
between average gage section stress and the point of maximum stress.
By comparing the (A) and (B) plots of the literature model and the baseline
configuration (Figs. 4–7), it is easy to observe that the current model matches the
historical model to a high degree, including locations of the critical stress points.
6Fig. 4 Stress contour plots of the axial (compressive) stress components for A) the literature
specimen from Dunlay et al.8 and B) the baseline configuration. Maximum compressive stress
values are denoted in blue, while minimum values are denoted in red.
To further validate that the current model predicts the same results as the literature
study, the stress contours were plotted for shear and principal stresses. Again, the
figures align closely with the figures generated by Dunlay8—the magnitudes and
profiles of the regions for respective plots of shear and principal stresses are quite
similar.
Fig. 5 Stress contour plots of the shear stress components for A) the literature specimen
from Dunlay et al.8 and B) the baseline configuration. The contours of maximum (blue) and
minimum shear stress values (red) are noted. The baseline agrees with the critical point for
maximum shear stress in Fig. 3.
7Fig. 6 Stress contour plots of the maximum (first) principal stresses for A) the literature
specimen from Dunlay et al.8 and B) the baseline configuration. The contours of maximum
(blue) and minimum first principal stress values (red) are noted.
Fig. 7 Stress contour plots of the minimum (third) principal stresses for A) the literature
specimen from Dunlay et al.8 and B) the baseline configuration. The contours of maximum
(blue) and minimum third principal stress values (red) are noted.
82.4 Comparison to Cuboidal and Cylindrical Specimens
Before moving onto the five studies, it was determined that a comparison of
dumbbell-shaped specimens needed to be drawn in relation to typical cuboidal and
cylindrical compression specimen geometries. These conventional specimen
geometries have previously been investigated in a variety of different sizes and
geometries; however, representative geometries have been selected for this current
study. It is anticipated that similar geometries (not modeled here) would not greatly
affect the outcomes. A cuboidal specimen commonly used for testing of advanced
ceramics17–21 was modeled with dimensions of 3.5 by 4.0 by 5.3 mm3 (height by
width by length). This specimen is presented in Fig. 8a. Note that for the purposes
of comparison, the cuboid specimen was modeled using a 2D plane-stress
approximation to improve the mesh resolution and simulation times. (A brief
comparison was made with the 3D model, and results were very similar, hence
validating the plane stress approximation.) A cylindrical specimen used for
standardized compression strength testing of whiteware ceramics22 was also
modeled with a radius of 3.18 mm and a total length of 12.7 mm (Fig. 8b).
Fig. 8 Specimen geometries for the A) cuboid (3D) and B) cylindrical (2D axisymmetric)
generated for simulation with the current model and comparison to the baseline dumbbell
geometry
Aside from the obvious geometric differences, these specimens were simulated
identically to that of the baseline configuration. No distinct gage section exists for
these specimens because the cross section is constant along the y-direction, so a
region within the center of both specimens, approximately one-quarter of the total
specimen length (black dashed area in Fig. 9), was chosen to represent the average
gage section stress.
9Fig. 9 Plots of the stress contours for the A) cuboid (plane-stress 2D view) and B)
cylindrical specimens. The dashed black outline is the portion considered for the gage section
and is approximately one-quarter of specimen length. The average stress across this region
was taken as the gage section compressive stress value.
The cuboidal specimen had an 80% increase in stress between the gage section and
stress concentration (which occurred along the edges of both specimens), while the
cylindrical specimen had a 122% increase in stress between these points. When
compared to the performance of cylindrical or cuboidal specimens, dumbbell
specimens drastically minimize the percent difference in stress between the gage
section and the point of maximum stress. The reduction in percent difference of
stress through using dumbbell specimens is clear; however, stress concentrations
still exist in these dumbbell specimens, which continue to influence the
compressive strength material performance.
3. Results
In order to compare the output for the various configurations within each study,
contour maps of axial stress and strain were generated along with values of the
cross-sectional area of both the stress concentration and the gage section at the time
of failure. Thus, alterations to the specimen size-scale, geometry, and loading
conditions were made in an attempt to understand the dominant parameters for
compression testing of ceramic dumbbell specimens; this was done to minimize the
differences in compressive stress and cross-sectional area between the gage section
and the maximum stress concentration point.
103.1 Study 1: Specimen Down-Scaling One aspect of compression testing ceramics that is important is the physical size of the specimen. Producing large plates or billets of ceramics is a nontrivial task, hence why small specimen sizes are typically employed for mechanical testing. It is desired to extract specimens from the typical manufacturing process used to make ceramic armor plates (typically
Table 2    Configurations A, B, and C specific input parameters as varied from the baseline

                                            Geometry: lengths
                        Configuration            (mm)
                                         Specimen Gage section
                              A            12.7         3.18
                              B            6.35         1.57
                              C            3.18         0.79

Scaling the specimen’s overall size did not affect the stress contours or
magnitudes—it solely affected the amount of time needed for stress and strain
values within the gage section to reach critical values. In fact, almost every
specimen’s contour maps for QS testing were quite similar to that of the baseline
(they are thus not presented). The fact that the time to failure changes proportionally
to specimen scale is expected since length and area are inversely proportional to
strain and stress, respectively. As deformation increases during compression, the
critical strain will be reached faster if the length of the undeformed specimen is
decreased (per the equation for axial strain). Configuration A had a stress
concentration that was 9.5% higher than the gage stress at a point where the cross-
sectional area was 1.1% larger than the gage section area. Similarly, Configurations
B and C both exhibited an increase of 9.5% and 0.8% in stress and area,
respectively. All of these stress concentrations were at the same point—the
transition from the first fillet into the gage section—which was the same point noted
in Fig. 3. Compared with the baseline specimen, which is 30.5 mm long, the
maximum stress conditions only vary slightly to that of Configurations A–C. The
small variation could be attributed to slight geometrical differences noticed
between the baseline specimen and Configuration A (Configuration A is not a
perfectly scaled-down version of the baseline), and also because the simulation is
stopped when the critical failure stress value is reached, which may occur at slightly
different “scaled” times due to the timesteps being the same for both simulations.
Hence, it can be concluded that scaling the specimen changes the stress distribution
by negligible amounts. However, this assumption does not consider microstructural
variations in the flaw distribution of a smaller specimen, which are not implemented
in this model and may influence the failure behavior. This issue will be discussed
in greater detail later in the investigation. Nevertheless, in light of the comparable
stress distributions and greater affinity for the smaller specimen size of
Configuration A for future testing, the subsequent studies will compare their results
with Configuration A rather than the larger baseline specimen (equivalent to the B
specimen detailed in Dunlay et al.8) described in Study 0.

                                           12
3.2 Study 2: Displacement Rate
Changing the displacement rate of the QS compression test proved to have an
inversely proportional effect on the time to failure. Configuration D was
compressed at half the rate of Configuration A (Table 3), hence critical values of
strain were not reached until it was compressed to the same amount, which took
twice as long. Configuration D failed at 19.0 s instead of the original 9.5 s seen in
Configuration A. The percent increase in stress between the gage section and the
stress concentration was 9.6%, and the cross-sectional area at this point was 0.8%
larger than the gage section. These values are consistent with Configuration A as
the only variation in the output was the doubling of time to failure.
Table 3 Configuration D specific input parameters as varied from the baseline
Displacement rate
Configuration
(mm/min)
D 0.25
3.3 Study 3: Specimen Geometry
In an effort to perform a rudimentary sensitivity study of the dumbbell specimen
geometry, a few basic geometric modifications were investigated as possible
improvements. Initially, the gage section length of 3.18 mm was modified by ±0.43
mm (Configurations E and F, respectively) without changing the fillet sizes. Next,
modifications to the two fillets were examined: extending the second fillet to the
end of the specimen (Configuration G) and maximizing the radius of the first fillet
(Configuration H). Finally, a small chamfer was placed at the edge of the specimen
end cap to reduce the likelihood of premature failure due to the stress concentration
at that point (Configuration I). These geometry modifications are summarized in
Table 4.
Table 4 Configurations E, F, G, H, and I specific input parameters as varied from the
baseline
Gage length
Configuration Geometry modification
(mm)
E 3.61 Lengthened gage section
F 2.74 Shortened gage section
Shortened gage section with second fillet extended to end (i.e.,
G 1.27
no cylindrical end cap)
Shortened gage section with maximum first fillet radius
H 1.27
allowing to maintain cylindrical end cap
I 3.18 Chamfer on end cap edge
13Lengthening the gage section, and thereby decreasing the radius of the first fillet,
slightly increased the percent difference between maximum stress and average gage
stress (Configuration E). Conversely, shortening the gage section, and thereby
increasing the radius of the first fillet, proved to slightly decrease this percentage
(Configuration F). The maximum stress in Configuration E was 11.2% higher than
the average gage section stress, while the maximum stress in Configuration F was
8.3% higher than the average gage section stress. This indicates that specimens with
shorter gage lengths are less sensitive to changes in area as one moves along the
specimen length because the radius of the first fillet is larger, and the tangential
slope into the gage section is less severe. Hence, a specimen with a shorter gage
section should produce smaller changes in area between the point of maximum
stress and the gage section stress than a longer gage section. This relationship is
noticed in Configurations E and F, where the percent difference in cross-sectional
area from gage to the maximum stress location is 1.5% and 0.2%, respectively.
However, a reduced gage length provides a smaller volume for failure to occur in;
therefore, an optimum balance must be determined.
In a further effort to reduce the difference between the point of stress concentration
and the gage section stress, two geometry modifications were created
(Configurations G and H). The aim of these specimens was to further decrease the
length of the gage section and increase the radius of the first fillet, resulting in the
smoother transition into the gage section mentioned previously. The overall width
and length of these newly designed dumbbell specimens were held constant to that
of the baseline geometry; however, the gage section length was shortened to
1.27 mm, and the two fillets connecting the gage section to the end caps were
maximized. In Configuration G, the second fillet extends the entire way to the
specimen’s end (Fig. 11a), which is different from the baseline design where a
1.70-mm cylindrical end cap is present. Configuration H, on the other hand,
includes this 1.70-mm cylindrical end cap but increases the radius of the second
fillet to maintain the radius of the maximized first fillet (Fig. 11b).
The percent increase from average gage section stress to the point of maximum
compressive stress is 6.2% and 6.3% for Configurations G and H, respectively, and
the percent difference in cross-sectional area for these two points is about 0.6% and
0.4%, respectively. These values are improvements from the 9.5% and 1.1%
increase in stress concentration and cross-sectional area at that point, respectively,
for Configuration A.
14Fig. 11 Modified dumbbell geometries of A) Configuration G and B) Configuration H. The
first fillet radius is maximized in both conditions. However, in Configuration G, the second
fillet extends to the end of the dumbbell, negating the end cap in the baseline geometry. In
Configuration H, the end cap from the baseline geometry is maintained, but the second fillet
radius is maximized.
In an effort to visualize the trend of reduced gage length decreasing the stress
concentration point, a plot was created of gage section length to the percent increase
between average gage stress and stress concentration point (Fig. 12). Generally, as
the gage section length is increased, the percent difference in stress between the
gage section and the stress concentration point also increases. The B specimen from
Dunlay8 is also plotted to help correlate the two functions. For each specimen, data
was collected when about 4 GPa of compressive stress was reached in the specimen;
however, because of how ANSYS generates discretized data, these stress values
can vary by ±50 MPa. Between similar tests of any given configuration, results for
percent increase in stress at the concentration point varied by approximately 0.25%;
therefore, error bars denoting this degree of error were generated on the individual
data points.
15Fig. 12 Plot of percent increase in stress at the concentration point vs. normalized gage
length for Configurations A, E, F, G, and H (blue) compared to the “B” specimens (red) from
Dunlay et al.8 (1989) and the baseline specimen in this study (2020). The gage lengths have
been normalized to the total specimen length.
As seen in Fig. 4, a stress concentration is also noticed on the outer edge of each
specimen’s end cap—a concentration similar to the one seen in the cylindrical
specimen (Fig. 9b). If this concentration reaches a critical value early in the loading
process, it could cause extremely premature failure and invalidate any experimental
results. In an attempt to minimize this concentration, a chamfer with 0.25-mm width
and height was added to the edge of Configuration A. This modification is
considered Configuration I and can be seen in Fig. 13.
Fig. 13 Detailed drawing of the edge chamfer modification to the geometry used for
Configuration I to attempt to reduce the interfacial stress concentration at this point in the
geometry of Configuration A
Configuration I was then simulated in ANSYS to observe the new behavior during
compression testing. The stress contour plots for both Configuration A (Fig. 14a)
and Configuration I (Fig. 14b) at the onset of failure are presented.
16Fig. 14 Axial stress contour plots for A) Configuration A and B) Configuration I with the
added edge chamfer
Unfortunately, the new chamfer had an adverse effect, effectively doubling the
magnitude of the stress concentration to 3.7 GPa, rather than the 1.8 GPa seen in
Configuration A. This indicates that a chamfer in this area is not ideal for stress
reduction. A tensile stress concentration of magnitude 14 MPa is noticed on
Configuration I as well, which may further complicate the design. Further testing
is necessary to determine how to best minimize this edge stress concentration.
3.4 Study 4: Boundary Conditions
In physical testing of dumbbell specimens, cylindrical WC inserts are often used
between the specimen and loading platen to reduce indentation and lateral
effects.8,11,15,23,24 The historical model incorporated WC inserts that were half-
dumbbell shaped and radius-matched to the end of the ceramic dumbbell
specimen.8 However, a platen of this geometry does not appear to be requisite, and
they are expensive to machine. More commonly, WC cylinders are used as platens.
To test how a cylindrical WC insert would affect the performance of dumbbell
specimens, two simulations were run of a 6.35-mm-thick WC cylinder with two
different radii (Table 5): one matched to the specimen end caps and another that
overhung the edges of the specimen.
Table 5 Configurations J, K, and L specific input parameters as varied from the baseline
Configuration Loading modification
J Radius-matched WC insert (i.e., flush)
K Large-radius WC inserts (i.e., overhanging)
L Frictionless upper support
For Configuration J, the WC platen was radius-matched to the specimen end cap
(i.e., flush); while in the second simulation, Configuration K, the WC insert
extended beyond the dumbbell end cap by one radius (i.e., overhanging). The
compressive stress contour maps for each test can be seen in Fig. 15.
17Fig. 15 Detailed view of the stress contour plots of the axial (compressive) stress component
for A) Configuration J (flush WC platen) and B) Configuration K (overhanging WC platen).
A dotted black line has been added to denote the boundary of the WC platen.
While the percent difference in stress and area at the concentration point compared
to the gage section is similar to that of Configuration A, Configurations J and K
have dissimilar stress contour maps. Configuration J exhibits an approximately
homogenous stress distribution on this outer region, including omission of the stress
concentration at the specimen edge noted in Configuration A. On the other hand, a
stress concentration is now noticed on the outer edge of Configuration K (seen
within the red circle), where the alumina specimen appears to be “indenting” the
WC. The overhang induces a nonuniform loading distribution on the top edge of
the specimen while the platen is also deforming elastically around the specimen
end cap, which promotes bending and shearing stresses (i.e., triaxial loading).
While Configuration K may fail because of this stress concentration, having a
magnitude of 2.3 GPa (0.5 GPa greater than Configuration A) at the moment of
failure, its gage section and maximum stress conditions are minimally affected. The
percent increase from average gage section compressive stress to maximum
compressive stress is about 9.4% for both Configurations J and K, and the percent
difference in area is about 0.9% and 0.2%, respectively, at the onset of failure.
The effect of friction on the loading surface was also investigated. Previously, a
displacement support of infinite friction was placed on the top of the specimen,
18where movement in the x-direction was restricted, as indicated by the results of
Dunlay.8 Conversely, Configuration L simulates a frictionless interface during
compression testing (Table 5). While the values for percent increase in stress and
area between gage and stress concentration point are similar to that of
Configuration A, the stress distributions in the contour plot have changed slightly
(Fig. 16).
Fig. 16 Stress contour plot of the axial (compressive) stress component for Configuration L
with a frictionless loading interface
The interior region of the specimen (i.e., closer to central axis) exhibits a slightly
larger stress magnitude than previously observed in Fig. 4 (infinite friction). The
stress concentration at the edge of the specimen is no longer apparent as well. The
way this specimen distributes stress through the end cap and into the gage section
could change specimen performance; if stress concentrations are minimized within
the end cap, failure is more likely to occur within the gage section. Configuration
L experienced a 9.6% increase in compressive stress between the gage section and
the maximum stress point—slightly higher than that of Configuration A. In physical
testing, interface behavior is expected to be closer to that of Configuration L, a
frictionless support, rather than Configuration A, which assumes infinite friction at
the interface, since lubrication and precision-machined inserts are often used.
However, in general, the results will fall somewhere between the two because ideal
conditions are extremely difficult, if not impossible, to obtain.
193.5 Study 5: High-Rate Loading
Advanced ceramics, such as alumina, are known to exhibit strain-rate sensitive
response.10,15,25–27 Therefore, acquiring the high-rate, or dynamic, properties of
these materials is of the utmost importance, especially when considering armor-
grade ceramics are employed in ballistic impact situations. To this point, simulating
the high-rate response of the dumbbell-shaped compression specimen is an
important consideration for this study to determine if high-rate loading has an
influence on the outcome.
To accomplish this, a ramp-like displacement profile was imposed on the
Configuration M specimen over a span of 250 µs. Approximately 50 µs into testing,
an axial stress of 4.9 GPa was reached at the location of maximum stress (Fig. 17).
At this point, the axial stress in the gage section is approximately 4.5 GPa, which
is comparable to the compressive strength measured during dynamic compression
testing of a dumbbell specimen of the same material.10 The top-half of the specimen
deformed about 0.05 mm in this time (which correlates to 0.1 mm of deformation
for the whole specimen), resulting in a strain rate of about 160 s–1. This is in very
good agreement with the majority of the strain rates attained in the round-robin
study on the same material.10
The percent difference in stress and area between the point of maximum stress and
the gage section was 7.5% and 0.8%, respectively. It is interesting to note that these
values are slightly lower than the values for the equivalent QS test (Configuration
A).
Fig. 17 Stress contour plot of the axial (compressive) stress component for the Configuration
M dynamic study
204. Discussion
The results of each configuration for all five of the studies are compiled into Table
6. This table presents the overall maximum axial (compressive) stress, average gage
section axial stress, cross-sectional area at the point of maximum axial stress, cross-
sectional area of the gage section, and their respective percent differences at the
time of failure.
Table 6 Maximum and gage section conditions of each configuration at the time of failure
Max. Avg. gage Area at max.
% Gage area %
Study Config. stress stress stress
diff. (mm2) diff.
(GPa) (GPa) (mm2)
Original 3.95 3.59 10.0 … … …
0
Baseline 3.97 3.63 9.36 20.6 20.2 1.98
A 4.00 3.65 9.53 3.53 3.49 1.14
1 B 4.00 3.65 9.50 0.91 0.90 0.75
C 4.00 3.65 9.54 0.23 0.23 0.75
2 D 4.00 3.65 9.58 3.52 3.49 0.76
E 3.95 3.55 11.2 3.63 3.58 1.51
F 4.01 3.70 8.29 3.62 3.62 0.19
3 G 3.93 3.70 6.22 3.64 3.62 0.56
H 3.97 3.74 6.27 3.64 3.62 0.37
I 3.95 3.61 9.34 3.63 3.62 0.37
J 3.96 3.62 9.43 3.54 3.50 0.95
4 K 4.00 3.65 9.38 3.73 3.72 0.18
L 3.98 3.63 9.63 3.54 3.50 1.14
5 M 4.88 4.54 7.53 3.54 3.51 0.76
Each configuration whose stress and strain contour map were not shown exhibited
similar behavior and distribution to that of Configuration A (seen in Figs. 3 and 4).
Table 6 shows that the parameter which most dominantly affected performance was
specimen geometry, Study 3. By manipulating specimen geometry, specifically
gage length, the percent increase in stress from the gage section to the point of
maximum stress changed, respectively. Increasing the gage length yielded a greater
difference between gage and maximum stress conditions, while decreasing gage
length yielded a smaller percent difference. Modifying the shape and proportions
of both fillets on the dumbbell changed these results as well. The best performing
configurations in terms of minimizing this percent increase in stress were
Configurations G and H, both of which yielded approximately a 6.2% difference in
axial stress between the gage section and the stress concentration. A thorough
sensitivity study of the dumbbell specimen geometry should be conducted to further
minimize these stress concentration conditions.
21Studies 1, 2, and 4 aimed to change other input parameters, such as specimen size,
loading rate, and boundary conditions, each of which affected the performance of
the specimen, in terms of minimizing stress differences, by negligible amounts.
Study 5 found that tests in higher strain-rate regimes reduced the percent difference
in stress and area between the gage section and the point of maximum stress. The
exact phenomenon that causes this is unknown, so additional examination is
needed.
During this experiment, several assumptions were made to reduce the variability of
simulation and simplify analysis. First, fracture mechanics was not considered.
Fracture mechanics plays a large role in determining material performance of
ceramics, so removing it from the analysis will certainly affect the results.
However, the linear-elastic behavior seen in these studies provides a rudimentary
understanding of how a specimen would behave when subjected to axial
compression. Similar stress concentrations would be apparent even with the
inclusion of fracture mechanics. Classically, fracture mechanics dictates when and
how brittle materials fail; however, for the purposes of this study, where
understanding the distribution of stress was paramount, fracture mechanics was not
needed. This allows for simpler simulations and a more streamlined analysis.
Material microstructure is also quite important in compression testing, especially
in ceramics where flaw distributions have a great effect on material performance.
However, because of the limitations of the simulation software, as well as
complexity of simulating real (or even simplified) material microstructure in
compression testing, microstructure was not implemented and material behavior
was assumed homogeneous. Further testing and simulation should be conducted to
evaluate the effects of both fracture mechanics and material microstructure on
specimen performance.
5. Conclusions
Dumbbell specimens in past studies have been used to determine material
properties of ceramics, as proposed by Carl Tracy in the 1980s.4 The use of
dumbbell-shaped specimens is an improvement over the previous cylindrical and
cuboidal geometries because they minimize stress concentrations occurring on the
outer edge interface, as well as aim to promote the onset of failure in the gage
section. However, new stress concentrations are noticed within the first fillet just
outside of the gage section on these dumbbell specimens, which can still lead to
slightly underestimated material performance. To quantify this stress concentration,
the percent increase in stress and cross-sectional area between the gage section and
the stress concentration point is extracted via simulations in ANSYS. A specimen
22that produces a stress concentration as close in magnitude and cross-sectional area
to that of the gage section will provide the most accurate values of material
properties during physical testing. Initially, the dumbbell specimen proposed by
Tracy4 and Dunlay et al.8 was recreated and analyzed to validate the current model
and obtain baseline values. Then, to determine which parameters had the greatest
effect on the specimen’s stress concentration, several input parameters were
modified and results were obtained. These modifications were broken down into
five studies in which size scale, loading rate, geometry, and boundary conditions
were all varied. The parameter that affected the percent difference in stress between
the gage and concentration point the most was specimen geometry, Study 3.
Specifically, reducing the overall length of the gage section and enlarging the first
fillet radius reduced the percent increase in stress by almost 3.3% when compared
to the results of Configuration A. We predict this percent increase in stress can
continue to be reduced by enhancing dumbbell specimen geometry, which requires
further thorough analysis and simulation. Therefore, an emphasis on perfecting
dumbbell specimen geometry instead of other input parameters, as studied in this
report, should be made to obtain the most accurate measurements of material
properties when conducting physical compression tests.
236. References
1. Sines G, Adams M. Compression testing of ceramics, in flaws and testing.
Boston (MA): Springer; 1978. p. 403–434.
2. Rudnick A, Marscall CW, Duckworth WH. The evaluation and interpretation
of mechanical properties of brittle materials. Columbus (OH): Battelle
Memorial Inst., Defense Ceramic Information Center; 1968.
3. Adams M, Sines G. Methods for determining the strength of brittle materials
in compressive stress states. Journal of Testing and Evaluation.
1976;4(6):383–396.
4. Tracy CA. A compression test for high strength ceramics. Journal of Testing
and Evaluation. 1987;15(1):14–19.
5. Tracy C, Slavin M, Viechnicki D. Ceramic fracture during ballistic impact.
Advances in Ceramics: Fractography of Glasses and Ceramics. 1988;22:295–
306.
6. Birch JM, Wilshire B, Owen DJR, Shantaram D. The influence of stress
distribution on the deformation and fracture behaviour of ceramic materials
under compression creep conditions. Journal of Materials Science.
1976;11(10):1817–1825.
7. Bortz SA, Burton KT. Analysis and review of mechanical testing procedures
for brittle materials. Chicago (IL): IIT Research Institute; 1968.
8. Dunlay WA, Tracy CA, Perrone PJ. A proposed uniaxial compression test for
high-strength ceramics. Watertown (MA): Army Materials and Mechanics
Research Center; 1989.
9. Swab JJ, Meredith CS, Casem DT, Gamble WR. Static and dynamic
compression strength of hot-pressed boron carbide using a dumbbell-shaped
specimen. Journal of Materials Science. 2017;52(17):10073–10084.
10. Swab JJ, Quinn GD. Dynamic compression strength of ceramics: results from
an interlaboratory round-robin exercise. Aberdeen Proving Ground (MD):
CCDC Army Research Laboratory; 2019 Nov. Report No.: ARL-TR-8860.
11. Chen W, Subhash G, Ravichandran G. Evaluation of ceramic specimen
geometries used in a split Hopkinson pressure bar. Dymat Journal.
1994;1(3):193–210.
2412. Blumenthal W, Gray G, Claytor T. Response of aluminium-infiltrated boron
carbide cermets to shock wave loading. Journal of Materials Science.
1994;29(17):4567–4576.
13. Blumenthal WR. High strain rate compression testing of ceramics and ceramic
composites. Advances in Ceramic Armor: A Collection of Papers Presented at
the 29th International Conference on Advanced Ceramics and Composites;
2005 Jan 23–28; Cocoa Beach, FL. 2005. John Wiley & Sons.
14. Pickup I. The correlation of microstructural and mechanical characteristics of
silicon carbide with ballistic performance. Advances in Ceramic Armor: A
Collection of Papers Presented at the 29th International Conference on
Advanced Ceramics and Composites; 2005 Jan 23–28; Cocoa Beach, FL.
2005. John Wiley & Sons.
15. Cosculluela A, Cagnoux J, Collombet F. Uniaxial compression of alumina:
structure, microstructure and strain rate. Le Journal de Physique IV.
1991;01(C3):C3-109–C3-116.
16. CoorsTek. Cerashield and cercom armor ceramics for superior lightweight
protection. Golden (CO): CoorsTek; 2017.
17. Hogan JD, Farbaniec L, Sano T, Shaeffer M, Ramesh KT. The effects of
defects on the uniaxial compressive strength and failure of an advanced
ceramic. Acta Materialia. 2016;102:263–272.
18. Hu G, Ramesh KT, Cao B, McCauley JW. The compressive failure of
aluminum nitride considered as a model advanced ceramic. Journal of the
Mechanics and Physics of Solids. 2011;59(5):1076–1093.
19. Farbaniec L, Hogan JD, Ramesh KT. Micromechanisms associated with the
dynamic compressive failure of hot-pressed boron carbide. Scripta Materialia.
2015;106:52–56.
20. Hogan JD, Farbaniec L, Shaeffer M, Ramesh KT. The effects of microstructure
and confinement on the compressive fragmentation of an advanced ceramic.
Journal of the American Ceramic Society. 2015;98(3):902–912.
21. Hogan JD, Farbaniec L, Daphalapurkar N, Ramesh KT. On compressive brittle
fragmentation. Journal of the American Ceramic Society. 2016;99(6):2159–
2169.
22. ASTM C773-88. Standard test method for compressive (crushing) strength of
fired whiteware materials. West Conshohocken (PA): ASTM International;
2016.
2523. Subhash G, Nemat‐Nasser S. Dynamic stress‐induced transformation and
texture formation in uniaxial compression of zirconia ceramics. Journal of the
American Ceramic Society. 1993;76(1):153–165.
24. Subhash G, Nemat-Nasser S. Uniaxial stress behaviour of Y-TZP. Journal of
Materials Science. 1993;28(21):5949–5952.
25. Luo H, Chen W. Dynamic compressive response of intact and damaged
AD995 alumina. International Journal of Applied Ceramic Technology.
2004;1(3):254–260.
26. Lankford J. Mechanisms responsible for strain‐rate‐dependent compressive
strength in ceramic materials. Journal of the American Ceramic Society.
1981;64(2):C‐33–C‐34.
27. Jiao T, Yulong L, Ramesh KT, Wereszczat AA. High rate response and
dynamic failure of structural ceramics. International Journal of Applied
Ceramic Technology. 2004;1(3):243–253.
26List of Symbols, Abbreviations, and Acronyms
2D two-dimensional
3D three-dimensional
FEA finite element analysis
QS quasi-static
WC tungsten carbide
271 DEFENSE TECHNICAL
(PDF) INFORMATION CTR
DTIC OCA
1 CCDC ARL
(PDF) FCDD RLD CL
TECH LIB
1 CCDC ARL
(PDF) FCDD RLW MB
J PITTARI
28You can also read