Different triggers for the two pulses of mass extinction across the Permian and Triassic boundary - Nature
←
→
Page content transcription
If your browser does not render page correctly, please read the page content below
www.nature.com/scientificreports
OPEN Different triggers for the two
pulses of mass extinction
across the Permian and Triassic
boundary
Guoshan Li1,2, Wei Liao2,3, Sheng Li2,4, Yongbiao Wang2* & Zhongping Lai1*
Widespread ocean anoxia has been proposed to cause biotic mass extinction across the Permian–
Triassic (P–Tr) boundary. However, its temporal dynamics during this crisis period are unclear. The
Liangfengya section in the South China Block contains continuous marine sedimentary and fossil
records. Two pulses of biotic extinction and two mass extinction horizons (MEH 1 & 2) near the P–
Tr boundary were identified and defined based on lithology and fossils from the section. The data
showed that the two pulses of extinction have different environmental triggers. The first pulse
occurred during the latest Permian, characterized by disappearance of algae, large foraminifers, and
fusulinids. Approaching the MEH 1, multiple layers of volcanic clay and yellowish micritic limestone
occurred, suggesting intense volcanic eruptions and terrigenous influx. The second pulse occurred in
the earliest Triassic, characterized by opportunist-dominated communities of low diversity and high
abundance, and resulted in a structural marine ecosystem change. The oxygen deficiency inferred by
pyrite framboid data is associated with biotic declines above the MEH 2, suggesting that the anoxia
plays an important role.
Abbreviations
GSSP Global stratotype section and point
MEH Mass extinction horizon
PTB Permian–Triassic boundary
PTME Permian–Triassic mass extinction
SEM Scanning electron microscope
SCB South China Block
The Permian–Triassic (P–Tr) mass e xtinction1 (~ 252 Ma)2, destroyed both terrestrial and marine l ife3 and killed
more than 90% of all species on E arth1,4. The extinction is the largest and most devastating biotic crisis of the
Phanerozoic Aeon5,6 because it caused whole-scale reorganization in marine ecosystems and the transition from
the Palaeozoic evolutionary fauna to the Modern evolutionary f auna7. While the exact causes and the nature
of this extinction are unknown6, numerous hypotheses, including episodic volcanism8,9, rapid changes of sea
level10, lethally hot t emperatures11, widespread oceanic a noxia12,13, oceanic a cidification14, oceanic t oxicity15,
and multiple catastrophic e vents16 have been proposed. Severe environmental perturbations related to giant
volcanic eruptions have recently been considered one of the most likely killing mechanisms9. Oceanic anoxia
across the P–Tr boundary is a global event and a major killing mechanism for extinction17. Besides, it explains
the protracted recovery after the extinction18–20. However, the temporal dynamics of anoxia using proxies are
still poorly constrained.
Various proxies such as sedimentological and palaeoecological f eatures12, Th/U r atios21, cerium anomaly
changes22, molybdenum isotopic c omposition23, uranium isotopes from d olostones24, sulfur isotopic e xcursions25,
carbon isotopes26, and molecular biomarkers have been used to constrain the timing and nature of marine redox
conditions during the crisis i nterval27. However, the geochemical proxies have several potential interpretations
1
Institute of Marine Sciences, Guangdong Provincial Key Laboratory of Marine Biotechnology, Shantou University,
Shantou 515063, China. 2School of Earth Sciences, China University of Geosciences (Wuhan), Wuhan 430074,
China. 3Anthropology Museum of Guangxi, Nanning 530028, China. 4No.3 Institute of Geological & Mineral
Resources Survey of Henan Geological Bureau, Zhengzhou 450000, China. *email: wangyb@cug.edu.cn;
zhongping.lai@yahoo.com
Scientific Reports | (2021) 11:6686 | https://doi.org/10.1038/s41598-021-86111-7 1
Vol.:(0123456789)
www.nature.com/scientificreports/
due to d iagenesis28, and their applications are often limited in scope. The morphology and size distribution of
pyrite framboids, which is a robust redox indicator found in both carbonate and mudstone/shale f acies29, are a
reliable proxy of benthic oxygenation in both modern e nvironments29 and ancient s ediments30,31.
In the South China Block, a small tectonic plate located in the eastern Tethys where the shallow-water plat-
form and deep-water siliceous–argillaceous sedimentary facies coexist, pyrite framboids have been used as an
indicator to investigate the P–Tr mass extinction. Numerous studies of pyrite framboid-inferred palaeoredox
conditions have focused on deep ocean deposited sedimentary rocks32,33. However, a few have studied shallow
platform sediments34,35, where microbialites are often bloomed as disaster forms after the mass extinction. Pre-
vious studies have suggested that a long-term and widespread oceanic anoxia occurred during the e xtinction13.
Mounting evidence show that oceanic redox conditions underwent high-frequency o scillations24,33,36. Bond and
30
Wignall suggested that anoxic conditions in the Palaeotethys were complex and unstable based on size distribu-
tions of pyrite framboids from several P–Tr boundary sections. However, those conodont data are not available
in many Bond and Wignall sections30 to confirm the P–Tr boundary. Besides, the sampling density is also not
high enough to reflect palaeoredox changes. Moreover, a depositional hiatus usually exists between conodont
Clakina meishanensis and Hindeodus changxingesis zones in the shallow carbonate platform sediments in the
South China Block10. Therefore, high-resolution palaeoecologic and sedimentologic studies from consecutive
shallow settings are needed to reconstruct detailed oceanic palaeoredox changes during this critical interval.
Therefore, high-density and high-resolution samples were collected, and the triggers and pattern of mass
extinction from the Liangfengya section were investigated. This study helps assess the temporal link between
environmental triggers and two pluses of extinction by comparing it with the previous studies in the Yangtze
Platform before, during, and after the mass extinction.
Geological and stratigraphic settings
Two different sedimentary facies coexisted in the South China Block (SCB) during the Changhsingian (Late
Permian) [(1) shallow-water platform facies represented by various carbonate-dominated sediments and
(2) deep-water siliceous/argillaceous deposits (Fig. 1)]. The Liangfengya section is located in an abandoned
quarry in the Mt. Zhongliang area, 10 km west of Chongqing city, and the upper Yangtze Carbonate Platform
(Fig. 1A). Yang et al.37 were the first to study it and since then it is one of the most important P–Tr boundary
sections38. The Liangfengya area recorded a shallow-water carbonate platform, inter-reef facies deposits during
the Late Permian39. There are representatives of Late Permian sponge-dominated reef facies in the northeast of
Liangfengya40. This study analyzed the upper Changxing Formation and the basal Feixianguan Formation of the
section (Fig. 1B). The total thickness of the section is about 6.4 m, with 18 beds (Beds 1–18) (Fig. 2). The topmost
two meters of the upper Permian Changxing Formation, Bed 1, consists of medium to thick, bioclastic limestone,
and yields abundant fossil fragments, such as foraminifers and f usulinids41, calcareous a lgae42, conodonts38, and
calcareous sponges40. The lower part of the Feixianguan Formation is characterized by alternating yellowish
shale and gray marlstones (Beds 2–15). The first episode of the mass extinction occurs at the topmost of Bed 8.
It is characterized by the disappearance of a fossil assemblage dominated by fusulinids, calcareous algae42, and
Permian brachiopods43. The basal five meters of the overlying earliest Triassic Feixianguan Formation comprise
fine-grained lithologies including micrites and marls. Thin claystone, calcareous shales, and mudstone, sparse
fauna separate the lithologies. Beds 9–15 contain a fossil assemblage with low diversity including small fora-
minifers, small gastropods, and ostracods. Beds 16–18 have a few bivalves, where pyrite framboids are common.
Overall, three fossil assemblage groups suggest a two-pulses extinction event straddling the P–Tr boundary.
Conodonts are essential index fossils for P–Tr stratigraphic studies. Yuan and S hen38 established five cono-
dont biozones within the Liangfengya section based on their occurrence. According to the first Hindeodus
parvus appearance, the P–Tr boundary was placed at 81 cm above the bioclastic limestone of the Changxing
Formation38. In this study, samples were collected at an interval of 5 ~ 10 cm from the upper Changxing Forma-
tion and lower Feixianguan Formation to conduct a high-resolution conodont stratigraphic study. Conodont
H. parvus appeared in sample LFY 10-2 of Bed 10 (Fig. 1C), indicating that the P–Tr boundary is at the middle
of Bed 10, located about 66 cm above the top of the bioclastic limestones of the Changxing Formation (Fig. 2),
consistent with Peng and Tong result46.
Besides conodont biostratigraphy, large carbon isotope excursions are useful for stratigraphic correlation
from the end-Permian to the Early-Middle Triassic47. There are two negative excursions of δ13Ccarb and δ13Corg
across the P–Tr boundary in deep-water s ections26. Two negative δ13C excursions occur at the Meishan section,
within Clarkina meishanensis and Isaricella isarcica zones respectively, and are intercalated by a weaker posi-
tive shift around the H. parvus zone45 (Fig. 3A). However, due to the major regression at the end-Permian10,
the first negative excursion record disappeared at most shallow-water sections (Fig. 3C). The δ13Ccarb record
from Liangfengya contains two negative shifts and a weaker positive shift, different from other shallow-water
sections34,48 (Fig. 3), suggesting that there is no distinct hiatus within the Liangfengya section. The continuous
sedimentary record of the Liangfengya section provides a potential to study triggers for the two pulses of mass
extinction near the P–Tr boundary.
Materials and methods
Sample and fossil assembly. A total of 70 samples were continuously collected from fresh outcrops at
the Liangfengya section, from a ~ 6.4 m thick interval across the P–Tr boundary. Changxing Formation had 11
samples, with a sampling interval of about 13 cm, and that of the Feixianguan Formation was about 7 cm.
A total of 29 samples were selected from the Liangfengya section to make directional thin-sections of
2.2 cm × 2.2 cm for fossil composition determination. Photomicrographs (41) were taken from the thin-sec-
tions and used to document the petrographic composition and taxonomic distribution of fossil fragments. A
Scientific Reports | (2021) 11:6686 | https://doi.org/10.1038/s41598-021-86111-7 2
Vol:.(1234567890)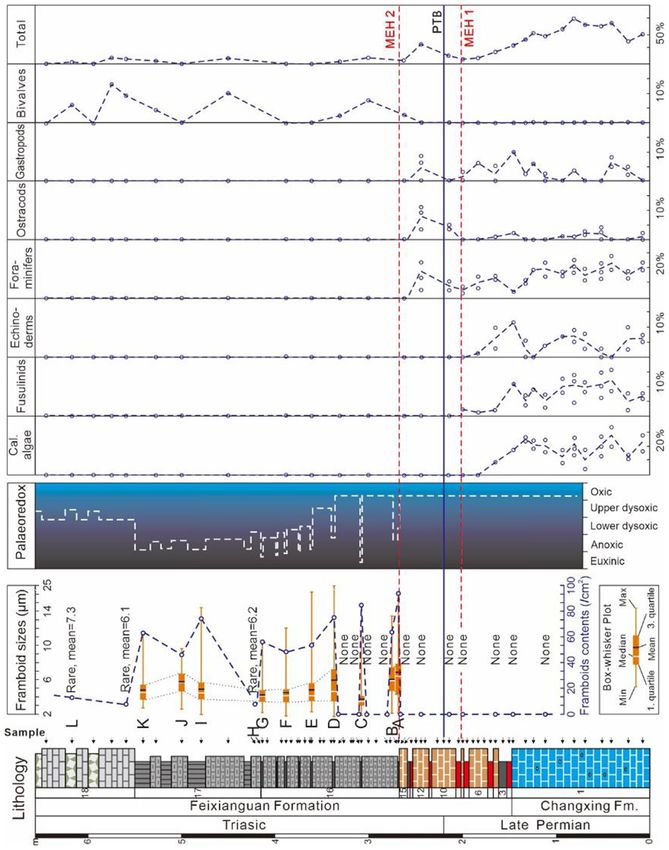
www.nature.com/scientificreports/
Figure 1. Location map and outcrop photograph of the Liangfengya section. (A) Late Permian
palaeogeography of South China (modified from Feng et al.44) showing study section locations (LFY
Liangfengya section) and previously-studied sections (LLD Laolongdong s ection34, MS Meishan Sect.45).
(B) Outcrop photograph of the Liangfengya section showing the P–Tr boundary (PTB; solid blue line), and
Changxing and Feixianguan Formation boundary (white dashed line). (C) Polished surface of Bed 10 from the
Liangfengya section showing the first appearance of Hindeodus parvus and the P–Tr boundary (PTB; solid blue
line).
quantitative statistical method, with 300 or 500 points counted per thin section, was used to uncover the strati-
graphic distribution of fossil fragments through the P–Tr t ransition50.
Carbon isotope stratigraphy. Remarkable negative carbon-isotope excursions are an important charac-
teristic of the P–Tr transition26. They are used for stratigraphic correlation from the end-Permian to the Early-
Middle Triassic47. A total of 45 samples were selected for carbon isotope analysis to compare the P–Tr event at
the Liangfengya section with other SCB sections. The weathered parts and diagenetic veins cutting across each
sample were carefully removed during sampling. Finnigan-MAT 251 mass spectrometer was used to measure
the isotopes. The results were presented in the conventional notation relative to the Vienna Pee Dee belemnite
(V-PDB) standard. The analytical precision for δ13C was better than ± 0.1‰. The data showed one weaker posi-
Scientific Reports | (2021) 11:6686 | https://doi.org/10.1038/s41598-021-86111-7 3
Vol.:(0123456789)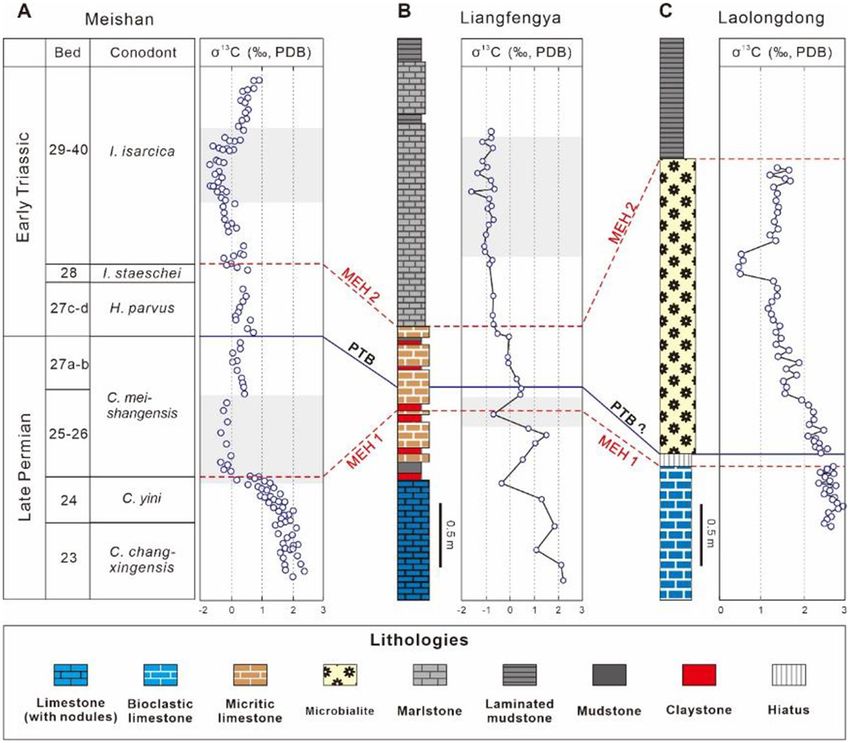
www.nature.com/scientificreports/
Figure 2. Stratigraphic log, conodont zones (open circles show Yuan and Shen d ata38), carbon isotopes, sedimentary
microfacies, and fossil fragment assemblages of the P–Tr transitional sequence from the Liangfengya section. Photos
include: (I) bioclastic limestone from the Changxing Formation, including abundant foraminifers (Colaniella, Pachyphloia),
calcareous algae and ostracods; (II) micritic limestone from the Feixianguan Formation; (III) micrite from the Feixianguan
Formation, including abundant Earlandia sp.; (IV) marlstone from the Feixianguan Formation; (V) vermicular limestone
from the Feixianguan Formation. MEH mass extinction horizon, PTB P–Tr boundary, Ca calcareous algae, Ec echinoderm,
Fo foraminifer, Os ostracoda.
Scientific Reports | (2021) 11:6686 | https://doi.org/10.1038/s41598-021-86111-7 4
Vol:.(1234567890)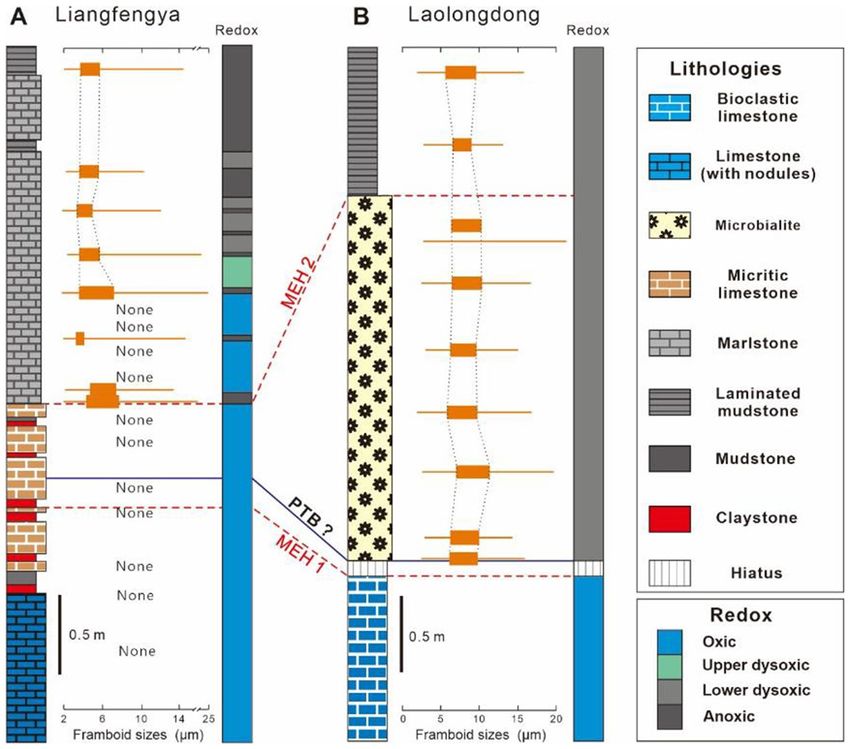
www.nature.com/scientificreports/
Figure 3. P–Tr boundary negative shifts correlation of δ13Ccarb in South China. Meishan from Xie et al.45;
Laolongdong from Liao et al.34. The biostratigraphic frame of Meishan from Jiang et al.49. The biostratigraphic
frame of Laolongdong revised from Yin et al.10. Shadowed areas represent negative excursions.
tive and two significant negative excursions during the P–Tr transition in the Liangfengya section (Fig. 2) and
were compared with the Meishan GSSP section45 (Fig. 3).
Pyrite framboids analysis. In modern environments, aggregated iron monosulfides form at the redox
interface between the oxic and anoxic zones29. In an anoxic/euxinic setting, pyrite framboids accumulate as tiny
particles and have a narrow size range (i.e., small standard deviation). In contrast, framboids form at the redox
interface within the surficial sediments when the lower portion of the water column is poorly oxygenated. The
individual framboids are larger and more variable due to the local availability of reactants and the support of the
sediment substrate (larger standard deviation)29.
Wignall and Newton51 demonstrated that morphology and size distributions of pyrite framboids are reliable
indicators of palaeoredox conditions since five semi-quantify redox levels can be d istinguished30. The pyrite
30
framboid technique has recorded more instantaneous c onditions and is valid for redox interpretations of
weathered samples, different from many geochemical indicators33. Therefore, size analysis of pyrite framboids
is a widely-used technique for evaluating the intensity and duration of ancient marine anoxic l evels33,36,51–53.
In this study, 24 oriented thin-sections (ca. 2.0 cm × 2.0 cm) from across the P–Tr boundary were selected for
detailed palaeoredox analysis. Two samples were from the bioclastic limestone of the Upper Permian Changxing
Formation (Bed 1), five from the greyish-yellow micritic limestone of the P–Tr “transition beds” (Beds 2–15),
and 17 from the Lower Triassic Feixianguan Formation (Beds 16–18). The samples covered the P–Tr transi-
tion interval recorded by this section, and the results reflected the palaeoredox evolution within the shallow
carbonate platform of the upper Yangtze region. A stereomicroscope was used for preliminarily petrographic
Scientific Reports | (2021) 11:6686 | https://doi.org/10.1038/s41598-021-86111-7 5
Vol.:(0123456789)www.nature.com/scientificreports/
observation of polished block of each sample prepared and FEI Quanta 200 scanning electron microscope for
the size of pyrite framboids in situ at the State Key Laboratory of Geological Processes and Mineral Resources,
China University of Geosciences (Wuhan). At least 150 pyrite framboids size measurements were conducted for
each sample where possible. Although such analyses appeared to underestimate the true size of the framboids
when not measured from the great circle, calculation showed that the error had little effect on the interpretation
of redox levels29. The pyrite framboid technique can be used for paleaoredox interpretations when the samples
are weathered, unlike many geochemical proxies33.
Results and discussions
Paleaoredox changes in the Liangfengya section. Pyrite framboid distributions at the Liangfengya
section were highly variable and underwent significant changes from the bottom to the top of the study interval.
A total of 11 of 24 samples did not contain any framboids, but others yield pyrite framboids in variable con-
centrations. Generally, dark-colored thin mudstone/marlstone yields much smaller and richer framboids than
light-colored thick limestone.
The lower part of the section (Beds 1 to 15), with bioclastic limestones of the Changxing Formation (Bed 1)
and the micritic limestones of the lower part of the Feixianguan Formation (Beds 2 to 15) had seven samples.
The samples had no pyrite framboids (only rare crystalline pyrite), suggesting that the bottom-water was oxic
before and during the first extinction pulse. Other sections from shallow-water platform settings of the South
China Block, including the Laolongdong section in C hongqing34, Gaohua section in H unan48, and Panjiazhuang
54
section in Z hejiang , were also deposited under oxic conditions.
The marlstone and mudstone of the Feixianguan Formation (Beds 16 to 17), which lie above MEH 2, yield
abundant pyrite framboids, with most dispersion in the matrix. Finally, the argilliferous and vermicular lime-
stones of the Feixianguan Formation (Bed 18) had rare pyrite framboids, consistent with limited bioturbation
observation in the samples. The size distributions of pyrite framboids from selected samples from Bed 16 to Bed
18 are shown in Fig. 4.
A total of 2738 pyrite framboids were measured from 12 samples (n = 186 to n = 361) except for LFY 17–1 and
LFY 18–4, where only 34 and 28 framboids were identified, respectively. Generally, over 90% of pyrite framboids
measured in each sample were smaller than 10 μm (Fig. 4). However, a few samples exhibited a “tail” of slightly
larger framboids. Seven of 11 samples from Bed 16 had abundant framboids (about 69 per sq cm), with a mean
framboid diameter between 3.72 μm (SD = 1.37 μm) and 6.83 μm (SD = 2.47 μm). However, four samples from the
lower part did not contain framboids. Pyrite framboids from four samples in Bed 17 had similar size distributions
to the upper part of Bed 16, which had a mean framboid diameter between 4.84 μm (SD = 1.91 μm) and 6.24 μm
(SD = 2.59 μm). The abundance of measured framboids had a noticeable valley, about 9 per sq cm, at the bottom
of Bed 17. In contrast, Bed 18, the vermicular and argillaceous limestones of the Feixianguan Formation, had
rare framboids and some pyrite crystals. For instance, LFY 18-4 only had 28 pyrite framboids in the polished
block, with a mean diameter (M) of 7.28 μm, and a standard deviation (SD) of 1.77 μm (Fig. 4L).
Semi-quantify palaeaoredox levels were semi-quantified at the Liangfengya section using a cross plot of mean
diameter versus standard deviation based on Wignall and Newton51 and Bond and Wignall30 criteria (Fig. 5). Five
samples from Bed 16, three from Bed 17, and one from Bed 18 were within the anoxic/euxinic field, indicating
poor-oxygen conditions in the water column (Fig. 5). Circulation was suppressed, and stratification reappeared
in the water column during the rise in Early Triassic t emperatures11. The absence of bioturbation in the samples
determined via thin-section analysis supports the redox interpretation. There were two samples from Bed 16
and one from Bed 17 within the dysoxic field. “Box-and-whisker” plots showed the changing size distribution of
pyrite framboids (Fig. 6), suggesting that palaeoredox condition of Liangfengya section varied between euxinic/
anoxic to dysoxic immediately after the second extinction pulse.
There were few framboids (14 in sample LFY 18-1 and 28 in LFY 18-4) at the top of this section. However,
the size distributions were along the edge of the anoxic zone (Fig. 5). According to the number and size of fram-
boids, this stage was assigned to dysoxic conditions, consistent with limited bioturbation observed in vermicular
limestone samples.
Extinction pattern at the Liangfengya section. Two extinction horizons (MEH 1 & 2) straddling the
P–Tr boundary at Liangfengya section were defined, as shown in Figs. 2 and 6. The benthic faunas underwent
three significant changes: (1) the diversity and abundance of benthic organisms rapidly decreased, (2) algae
and most fusulinids were extinct at the MEH 1 and, (3) bivalve abundance began to increase from the MEH
2 (Fig. 6). The total fossil abundance reached a peak (~ 71%) before MEH 1, and gradually decreased to ~ 8%
in Bed 8. Abundance rebounded to 33% in Bed 12 after MEH 1, but substantially dropped in Bed 15, where it
stabilized at or below 10% (Fig. 6). Notably, the calcareous algae suddenly disappeared at the beginning of the
Clarkina yini zone42, during multiple layers of volcanic clay and yellowish micritic limestone (Beds 2–15).
Disaster forms, such as microforaminifers, ostracodes, and microgastropods bloomed within a short period
in MEH 1 and MEH 2 (Fig. 6). Interestingly, the two distinct declines in abundance were associated with two
microbial proliferations identified via biomarker analysis and negative shifts of carbon isotope c omposition45,
possibly because foraminifers directly consume microbes, and their disappearance causes microbe blooming.
Similar assemblage changes have been observed in many coeval faunas across the P–Tr boundary in sections
from deep-water regions47.
Wu et al.55 proposed that mass extinction of reef ecosystems consists of two pulse and non-reef ecosystems
similar to that of reef ecosystems. Song et al.47 demonstrated that the first stage of the extinction happens in the
Clarkina yini zone and the second in Isarcicella staeschei zone. Song et al.47 used a “likelihood ratio” test on 87
species from the Liangfengya section, similar to the Meishan GSSP section. Their results confirmed a two-pulsed
Scientific Reports | (2021) 11:6686 | https://doi.org/10.1038/s41598-021-86111-7 6
Vol:.(1234567890)www.nature.com/scientificreports/
Figure 4. Size distributions of pyrite framboids from the Liangfengya section. Each histogram corresponds to
samples marked from (A–L) in the stratigraphic section of Fig. 6. M mean framboid diameter (μm), SD standard
deviation of framboid diameters (μm), n number of pyrite framboids measured in sample.
extinction pattern. A total of 62 species were consistent with a simultaneous extinction at the top of Clarkina
yini zone47.
Liu et al.41 assumed that the foraminifers have a two-step decline at Liangfengya, similar to this study that
showed a two-pulse extinction pattern in Liangfenya (Fig. 6), and Meishan47. However, according to conodonts
biozones of Yuan and S hen38, Liu et al.41 pointed that the first extinction pulse was synchronous with Meishan,
and the second within the H. parvus Zone. We confirm the two extinction pulses were synchronous at Liang-
fengya and Meiahan since conodont H. parvus was found in Bed 10.
Different triggers for the two extinction pulses. The study data showed a two-episode extinction
pattern at the Liangfengya section. In contrast, many tropical shallow-water platforms only record the interlude
phase between two major pulses of extinction48. There is no first extinction pulse record in most shallow plat-
form sections because of the end-Permian regression10. Most normal marine benthos disappeared at the top of
end-Permian reef limestone at Laolongdong section due to a hiatus of the end-Permian regression (Fig. 7)34.
Post-extinction taxa, tolerant to anoxic or poor-oxygen c onditions55, flourish at a low diversity in the overlying
microbialite. The Liangfengya section data was good for the pattern or trigger comparison of the mass extinc-
Scientific Reports | (2021) 11:6686 | https://doi.org/10.1038/s41598-021-86111-7 7
Vol.:(0123456789)www.nature.com/scientificreports/
Figure 5. Mean diameter versus standard deviation crossplot of pyrite framboid data from the Liangfengya
section. Each sample corresponds to those marked from (A–L) in the stratigraphic section in Fig. 6. The dotted
line separating anoxic/euxinic from dysoxic facies is from Bond and Wignall30.
tion during the P–Tr transition from shallow-water platforms to deep-water regions (Fig. 7). The group-specific
extinction selection suggested that the two P–Tr extinction pulses have different environmental triggers.
Previous studies have shown a strong connection between the biotic mass extinction and oxygen deficiency
in the water column13,56. For instance, Huang et al.33 found a two-stage oceanic anoxia pattern during the P–Tr
transition in Kashmir, which is highly related to the two-pulse mass extinction33. Calcareous algae, fusulinids,
and echinoderms disappeared at the top of Bed 8. None of the species were found in the P–Tr transition beds or
the overlying Feixianguan Formation, as shown in Fig. 6. Sedimentary conditions are well-oxygenated according
to the pyrite framboids of the Late Permian Changxing Formation. The shallow platform can support a diverse
population under such conditions. However, Wignall and Hallam39 found that the marl (Beds 2–15) is poorly
bioturbated, limited to small-sized burrows. Loope et al.57 reported a cerium anomaly from the microbialites
at the Cili section in South China. They argued that shallow-marine anoxia was not widespread in equatorial
waters and was not a factor in the mass extinction. Wu et al.55 pointed that non-reef ecosystems cannot experi-
ence oceanic anoxia but has the first extinction stage, implying that the oceanic anoxia is probably not the main
killer of the oceanic benthos at the first extinction pulse.
Besides, there was a sharp temperature rise along with the P–Tr v olcanism11. Chen et al.58 reported a ~ 9 °C
increase in seawater surface temperatures from Bed 24e to Bed 27 at Meishan GSSP. High temperatures and
increased terrigenous influx to the oceans during the Early Triassic could have increased the cyanobacterial
bloom45, which constructed Lower Triassic microbialites in the S CB34 (Fig. 7). High and oscillating tempera-
tures in the equatorial Paleotethys likely controlled the pace and nature of recovery after the end-Permian mass
extinction11. Thus, high-temperature intolerant shallow-water inhabitants, such as corals and large foraminifers
were first e liminated11, leading to calcareous algae loss. Taxa without physiological buffering and non-motile taxa
were severely affected at higher extinction rates59. Ostracods and gastropods have high-temperature tolerances16,
thus can survive in the shallow waters during the earliest Triassic. Therefore, the high temperature could be the
main killer during the first extinction phase and not an anoxic condition. Besides, the end-Permian regression
in C. yini Zone to C. meishanensis zone might have significantly affected the pattern and process of the PTB
mass extinction10.
However, an anoxic event inferred from pyrite framboids occurred immediately after the MEH 2 of the
Liangfengya section (Fig. 6). Similarly, the mean diameter of framboids in mudstone over the MEH 2 decreased
at the Laolongdong section, suggesting a further intensification of oxygen deficiency in the bottom waters34
(Fig. 7). The oxygen-minimum zone (OMZ) expansion60 or upwelling of abyssal anoxic w aters61 are used to
explain anoxic condition development in shallow waters during the Early Triassic. Regional upwelling has been
widely developed due to the particular palaeogeographical position of SCB62. Wignall et al.63 suggested that
volcanic-induced global warming contributes to widespread oceanic anoxic event developments. The cyano-
bacterial bloom enhanced consumption of dissolved oxygen via degradation of organic matter produced by
the cyanobacteria31. Furthermore, the carbon isotopes had a positive relationship with biodiversity (Figs. 2, 6).
These results suggest that the change from oxic to dysoxic conditions in shallow environments could be related
to the Early Triassic transgression10,35. Only a few planktonic or nektonic taxa such as epifaunal bivalves and
conodonts can survive under anoxic conditions. The abundance and diversity of marine organisms were lowly
maintained during the Early-Middle Triassic (Fig. 6). There were no disaster forms, such as microgastropods,
ostracods, and foraminifers, flourishing in the microbialite before the MEH 2 in the lower interval of m udstone34.
Moreover, deep-water slope facies (e.g. Shangsi section64), demonstrated a similar relation between the redox
Scientific Reports | (2021) 11:6686 | https://doi.org/10.1038/s41598-021-86111-7 8
Vol:.(1234567890)www.nature.com/scientificreports/
Figure 6. Pyrite framboid “box-and-whisker” plots of the Liangfengya section, the distribution of inferred
water-column redox conditions according to Bond and W ignall30, and stratigraphic percentages of fossil
fragments determined in thin-section. MEH mass extinction horizon, PTB P–Tr boundary.
Scientific Reports | (2021) 11:6686 | https://doi.org/10.1038/s41598-021-86111-7 9
Vol.:(0123456789)www.nature.com/scientificreports/
Figure 7. Stratigraphic logs of the Liangfengya and Laolongdong sections34, including pyrite framboid “box-
and-whisker” plots and inferred redox conditions.
changes and the benthos extinction, suggesting that the anoxic conditions could have played an important role
at the second extinction pulse.
Conclusions
The Liangfengya section recorded a continuous shallow-water facies deposition from the Late Permian to Early
Triassic. Besides, its biological assemblage revealed that the ancient halobios exhibited a two-pulse extinction
pattern. The first episode of the extinction occurred during the latest Permian. The MEH 1 was at the top of the
Clarkina yini zone (Bed 8), corresponding to Bed 25 of the Meishan section, characterized by the disappear-
ance of all calcareous algae, echinoderms, fusulinids, and most large non-fusulinids foraminifers. The second
extinction episode occurred in the earliest Triassic. The MEH 2 was at the top of Bed 15, corresponding to Bed
28 of the Meishan section. The second pulse selectively showed a different extinction. Some small foraminifers,
ostracods, and microgastropods survived the first episode, but most were extinct during the second phase, caus-
ing a reorganization of marine ecosystems at the Liangfengya section.
This study showed two remarkable negative δ13C excursions and a weaker positive excursion near the P–Tr
boundary correlated with the Meishan GSSP section. The two negative δ13C excursions, and the conodont
biostratigraphy, indicate that there is no distinct hiatus within the Liangfengya section. The continuous sedimen-
tary record provides a potential to study triggers for the two pulses of mass extinction near the P–Tr boundary.
The high-resolution analysis of pyrite framboid size distributions and sedimentary facies from the Liang-
fengya section provided a detailed shallow-water record of palaeoredox changes during the PTME. Notably, no
framboid was found near MEH 1, suggesting that the first pulse of P–Tr mass extinction could not be caused
by an anoxia event, at least for benthic organisms at Liangfengya. However, anoxic conditions inferred from
framboid sizes immediately appeared above MEH 2, implying that anoxic conditions played an important role
in the second pulse.
Received: 14 December 2020; Accepted: 10 March 2021
References
1. Sepkoski, J. J. A kinetic model of Phanerozoic taxonomic diversity. III. Post-Paleozoic families and mass extinctions. Paleobiology
10, 246–267 (1984).
Scientific Reports | (2021) 11:6686 | https://doi.org/10.1038/s41598-021-86111-7 10
Vol:.(1234567890)www.nature.com/scientificreports/
2. Fan, J. X. et al. A high-resolution summary of Cambrian to Early Triassic marine invertebrate biodiversity. Science 367, 272–277
(2020).
3. Huey, R. B. & Ward, P. D. Hypoxia, global warming, and terrestrial late Permian extinctions. Science 308, 398–401 (2005).
4. Erwin, D. H., Bowring, S. A. & Yugan, J. End-Permian mass extinctions: A review. Spec. Pap. Geol. Soc. Am. 356, 363–383 (2002).
5. Racki, G. End-Permian mass extinction: Oceanographic consequences of double catastrophic volcanism. Lethaia 36, 171–173
(2003).
6. Rong, J. Exploring the real causes of the end-Permian mass extinction. Natl. Sci. Rev. 1, 326–327 (2014).
7. Dineen, A. A., Roopnarine, P. D. & Fraiser, M. L. Ecological continuity and transformation after the Permo-Triassic mass extinc-
tion in northeastern Panthalassa. Biol. Lett. 15, 20180902 (2019).
8. Burgess, S. D., Muirhead, J. D. & Bowring, S. A. Initial pulse of Siberian Traps sills as the trigger of the end-Permian mass extinc-
tion. Nat. Commun. 8, 164–169 (2017).
9. Burgess, S. Deciphering mass extinction triggers. Science 363, 815–816 (2019).
10. Yin, H. et al. The end-Permian regression in South China and its implication on mass extinction. Earth Sci. Rev. 137, 19–33 (2014).
11. Sun, Y. et al. Lethally hot temperatures during the Early Triassic greenhouse. Science 338, 366–370 (2012).
12. Wignall, P. B. & Hallam, A. Anoxia as a cause of the Permian/Triassic mass extinction: Facies evidence from northern Italy and
the western United States. Palaeogeogr. Palaeoclimatol. Palaeoecol. 93, 21–46 (1992).
13. Isozaki, Y. Permo-triassic boundary superanoxia and stratified superocean: Records from lost deep sea. Science 276, 235–238
(1997).
14. Jurikova, H. et al. Permian–Triassic mass extinction pulses driven by major marine carbon cycle perturbations. Nat. Geosci. 13,
745–750 (2020).
15. Meyer, K. M., Kump, L. R. & Ridgwell, A. Biogeochemical controls on photic-zone euxinia during the end-Permian mass extinc-
tion. Geology 36, 747–750 (2008).
16. Song, H. et al. Anoxia/high temperature double whammy during the Permian–Triassic marine crisis and its aftermath. Sci. Rep.
4, 4132 (2014).
17. Brennecka, G. A., Herrmann, A. D., Algeo, T. J. & Anbar, A. D. Rapid expansion of oceanic anoxia immediately before the end-
Permian mass extinction. Proc. Natl. Acad. Sci. U.S.A. 108, 17631–17634 (2011).
18. Kump, L. R., Pavlov, A. & Arthur, M. A. Massive release of hydrogen sulfide to the surface ocean and atmosphere during intervals
of oceanic anoxia. Geology 33, 397–400 (2005).
19. Winguth, C. & Winguth, A. M. E. Simulating Permian–Triassic oceanic anoxia distribution: Implications for species extinction
and recovery. Geology 40, 127–130 (2012).
20. Wignall, P. B. et al. Death in the shallows: The record of Permo-Triassic mass extinction in paralic settings, southwest China. Global
Planet. Change 189, 103176 (2020).
21. Wignall, P. B. & Twitchett, R. J. Oceanic anoxia and the end permian mass extinction. Science 272, 1155–1158 (1996).
22. Kakuwa, Y. & Matsumoto, R. Cerium negative anomaly just before the Permian and Triassic boundary event—The upward expan-
sion of anoxia in the water column. Palaeogeogr. Palaeoclimatol. Palaeoecol. 229, 335–344 (2006).
23. Pearce, C. R., Cohen, A. S., Coe, A. L. & Burton, K. W. Molybdenum isotope evidence for global ocean anoxia coupled with per-
turbations to the carbon cycle during the Early Jurassic. Geology 36, 231–234 (2008).
24. Zhang, F. et al. Two distinct episodes of marine anoxia during the Permian–Triassic crisis evidenced by uranium isotopes in marine
dolostones. Geochim. Cosmochim. Acta 287, 165–179 (2020).
25. Riccardi, A. L., Arthur, M. A. & Kump, L. R. Sulfur isotopic evidence for chemocline upward excursions during the end-Permian
mass extinction. Geochim. Cosmochim. Acta 70, 5740–5752 (2006).
26. Korte, C. & Kozur, H. W. Carbon-isotope stratigraphy across the Permian–Triassic boundary: A review. J. Asian Earth Sci. 39,
215–235 (2010).
27. Grice, K. et al. Photic zone euxinia during the Permian–Triassic superanoxic event. Science 307, 706–709 (2005).
28. Shields, G. & Stille, P. Diagenetic constraints on the use of cerium anomalies as palaeoseawater redox proxies: An isotopic and
REE study of Cambrian phosphorites. Chem. Geol. 175, 29–48 (2001).
29. Wilkin, R. T., Barnes, H. L. & Brantley, S. L. The size distribution of framboidal pyrite in modern sediments: An indicator of redox
conditions. Geochim. Cosmochim. Acta 60, 3897–3912 (1996).
30. Bond, D. P. G. & Wignall, P. B. Pyrite framboid study of marine Permian–Triassic boundary sections: A complex anoxic event and
its relationship to contemporaneous mass extinction. Geol. Soc. Am. Bull. 122, 1265–1279 (2010).
31. Liao, P. et al. Formation, aggregation, and deposition dynamics of NOM-iron colloids at anoxic-oxic interfaces. Environ. Sci.
Technol. 51, 12235–12245 (2017).
32. Shen, W. et al. Pyrite framboids in the Permian–Triassic boundary section at Meishan, China: Evidence for dysoxic deposition.
Palaeogeogr. Palaeoclimatol. Palaeoecol. 253, 323–331 (2007).
33. Huang, Y. et al. Two-stage marine anoxia and biotic response during the Permian–Triassic transition in Kashmir, northern India:
pyrite framboid evidence. Glob. Planet. Change 172, 124–139 (2019).
34. Liao, W., Wang, Y., Kershaw, S., Weng, Z. & Yang, H. Shallow-marine dysoxia across the Permian–Triassic boundary: Evidence
from pyrite framboids in the microbialite in South China. Sed. Geol. 232, 77–83 (2010).
35. Wang, T., Burne, R. V., Yuan, A., Wang, Y. & Yi, Z. The evolution of microbialite forms during the Early Triassic transgression: A
case study in Chongyang of Hubei Province, South China. Palaeogeogr. Palaeoclimatol. Palaeoecol. 519, 209–220 (2019).
36. Li, G., Wang, Y., Shi, G. R., Liao, W. & Yu, L. Fluctuations of redox conditions across the Permian–Triassic boundary—New evidence
from the GSSP section in Meishan of South China. Palaeogeogr. Palaeoclimatol. Palaeoecol. 448, 48–58 (2016).
37. Yang, Z., Yin, H. & Wu, S. Permian and triassic boundary stratigraphy and faunas of South China (Geological Publishing House,
1987).
38. Yuan, D. X. & Shen, S. Z. Conodont succession across the Permian–Triassic boundary of the Liangfengya section, Chongqing
South China. Acta Palaeontol. Sin. 50, 420–438 (2011).
39. Wignall, P. B. & Hallam, A. Facies change and the end-permian mass extinction in SE Sichuan, China. Palaios 11, 587–596 (1996).
40. Wu, Y. S., Jiang, H. X. & Liao, T. P. Sea-level drops in the Permian–Triassic boundary section at Laolongdong, Chongqing Sichuan
province. Acta Petrol. Sin. 22, 2405–2412 (2006).
41. Liu, X., Song, H., Bond, D. P. G., Tong, J. & Benton, M. J. Migration controls extinction and survival patterns of foraminifers during
the Permian–Triassic crisis in South China. Earth Sci. Rev. 209, 103329 (2020).
42. Jia, E. & Song, H. End-Permian mass extinction of calcareous algae and microproblematica from Liangfengya, South China. Geobios
51, 401–418 (2018).
43. Shen, S. Z. & Xl, He. Changxingian brachiopod assemblage sequence in Zhongliang Hill, Chongqing. J. Stratigr. 15, 189–196 (1991).
44. Feng, Z. Z. et al. Lithofacies paleogeography of the permian of South China. Acta Sedimentol. Sin. 14, 1–11 (1996).
45. Xie, S. et al. Changes in the global carbon cycle occurred as two episodes during the Permian–Triassic crisis. Geology 35, 1083–1086
(2007).
46. Peng, Y. & Tong, J. Integrated study on Permian–Triassic boundary bed in Yangtze Platform. Earth Sci. J. China Univ. Geosci. 24,
39–47 (1999).
47. Song, H., Wignall, P. B., Tong, J. & Yin, H. Two pulses of extinction during the Permian–Triassic crisis. Nat. Geosci. 6, 52–56 (2012).
Scientific Reports | (2021) 11:6686 | https://doi.org/10.1038/s41598-021-86111-7 11
Vol.:(0123456789)www.nature.com/scientificreports/
48. Wang, L. et al. Depositional conditions and revised age of the Permo-Triassic microbialites at Gaohua section, Cili County (Hunan
Province, South China). Palaeogeogr. Palaeoclimatol. Palaeoecol. 443, 156–166 (2016).
49. Jin, Y. G. et al. Pattern of marine mass extinction near the Permian–Triassic boundary in South China. Science 289, 432–436 (2000).
50. Payne, J. L., Lehrmann, D. J., Wei, J. & Knoll, A. H. The pattern and timing of biotic recovery from the End-Permian extinction
on the great bank of Guizhou, Guizhou Province, China. Palaios 21, 63–85 (2006).
51. Wignall, P. B. & Newton, R. Pyrite framboid diameter as a measure of oxygen deficiency in ancient mudrocks. Am. J. Sci. 298,
537–552 (1998).
52. Wignall, P. B. et al. An 80 million year oceanic redox history from Permian to Jurassic pelagic sediments of the Mino-Tamba ter-
rane, SW Japan, and the origin of four mass extinctions. Glob. Planet. Change 71, 109–123 (2010).
53. He, L. et al. An oxygenation event occurred in deep shelf settings immediately after the end-Permian mass extinction in South
China. Global Planet. Change 101, 72–81 (2013).
54. Huang, Y.-F. et al. Early Triassic microbialites from the Changxing Region of Zhejiang Province, South China. J. Palaeogeogr. 8,
225–237 (2019).
55. Wu, Y., Fan, J., Jiang, H. & Yang, W. Extinction pattern of reef ecosystems in latest Permian. Chin. Sci. Bull. 52, 512–520 (2007).
56. Clapham, M. E. & Payne, J. L. Acidification, anoxia, and extinction: A multiple logistic regression analysis of extinction selectivity
during the Middle and Late Permian. Geology 39, 1059–1062 (2011).
57. Loope, G. R., Kump, L. R. & Arthur, M. A. Shallow water redox conditions from the Permian–Triassic boundary microbialite: The
rare earth element and iodine geochemistry of carbonates from Turkey and South China. Chem. Geol. 351, 195–208 (2013).
58. Chen, Z.-Q. et al. Complete biotic and sedimentary records of the Permian–Triassic transition from Meishan section, South China:
Ecologically assessing mass extinction and its aftermath. Earth Sci. Rev. 149, 67–107 (2015).
59. Knoll, A. H., Bambach, R. K., Payne, J. L., Pruss, S. & Fischer, W. W. Paleophysiology and end-Permian mass extinction. Earth
Planet. Sci. Lett. 256, 295–313 (2007).
60. Clarkson, M. O. et al. Dynamic anoxic ferruginous conditions during the end-Permian mass extinction and recovery. Nat Commun
7, 12236 (2016).
61. Payne, J. & Kump, L. Evidence for recurrent Early Triassic massive volcanism from quantitative interpretation of carbon isotope
fluctuations. Earth Planet. Sci. Lett. 256, 264–277 (2007).
62. Kershaw, S. et al. Earliest Triassic microbialites in the South China block and other areas: Controls on their growth and distribu-
tion. Facies 53, 409–425 (2007).
63. Wignall, P. B., Newton, R. & Brookfield, M. E. Pyrite framboid evidence for oxygen-poor deposition during the Permian–Triassic
crisis in Kashmir. Palaeogeogr. Palaeoclimatol. Palaeoecol. 216, 183–188 (2005).
64. Xiang, L. et al. Oceanic redox evolution across the end-Permian mass extinction at Shangsi, South China. Palaeogeogr. Palaeocli-
matol. Palaeoecol. 448, 59–71 (2016).
Acknowledgements
This study was jointly supported by CNSF (41730320), STU Scientific Research Start-Up Foundation for Talents
(NTF19003, NTF20006), and Innovation and Entrepreneurship Project of Shantou (2021112176541391). Thanks
are due to Dr. Haishui Jiang and Dr. Lina Wang for help in identifying conodonts. We thank the three reviewers
for constructive comments.
Author contributions
G.L., W.L., Y.W., and S.L. collected the samples and photographs in the field. G.L. S.L., and W.L. conducted the
laboratory measurements and analyzed the data. G.L. and Y.W. organized and revised the drawings. G.L., Z.L.,
and Y.W. wrote the manuscript. Z.L. proofread the manuscript. All authors involved in the discussions.
Competing interests
The authors declare no competing interests.
Additional information
Correspondence and requests for materials should be addressed to Y.W. or Z.L.
Reprints and permissions information is available at www.nature.com/reprints.
Publisher’s note Springer Nature remains neutral with regard to jurisdictional claims in published maps and
institutional affiliations.
Open Access This article is licensed under a Creative Commons Attribution 4.0 International
License, which permits use, sharing, adaptation, distribution and reproduction in any medium or
format, as long as you give appropriate credit to the original author(s) and the source, provide a link to the
Creative Commons licence, and indicate if changes were made. The images or other third party material in this
article are included in the article’s Creative Commons licence, unless indicated otherwise in a credit line to the
material. If material is not included in the article’s Creative Commons licence and your intended use is not
permitted by statutory regulation or exceeds the permitted use, you will need to obtain permission directly from
the copyright holder. To view a copy of this licence, visit http://creativecommons.org/licenses/by/4.0/.
© The Author(s) 2021
Scientific Reports | (2021) 11:6686 | https://doi.org/10.1038/s41598-021-86111-7 12
Vol:.(1234567890)You can also read