06/52 NAMAKWA DISTRICT - NORTHERN CAPE - COGTA
←
→
Page content transcription
If your browser does not render page correctly, please read the page content below
06/52   NAMAKWA DISTRICT
        Northern Cape

          NAMAKWA combines the
          unspoilt expanses of
          Namaqualand and
          Hantam Karoo to form a
          region of exquisite natural
          beauty and contrast.
2
    PROFILE: NAMAKWA DISTRICT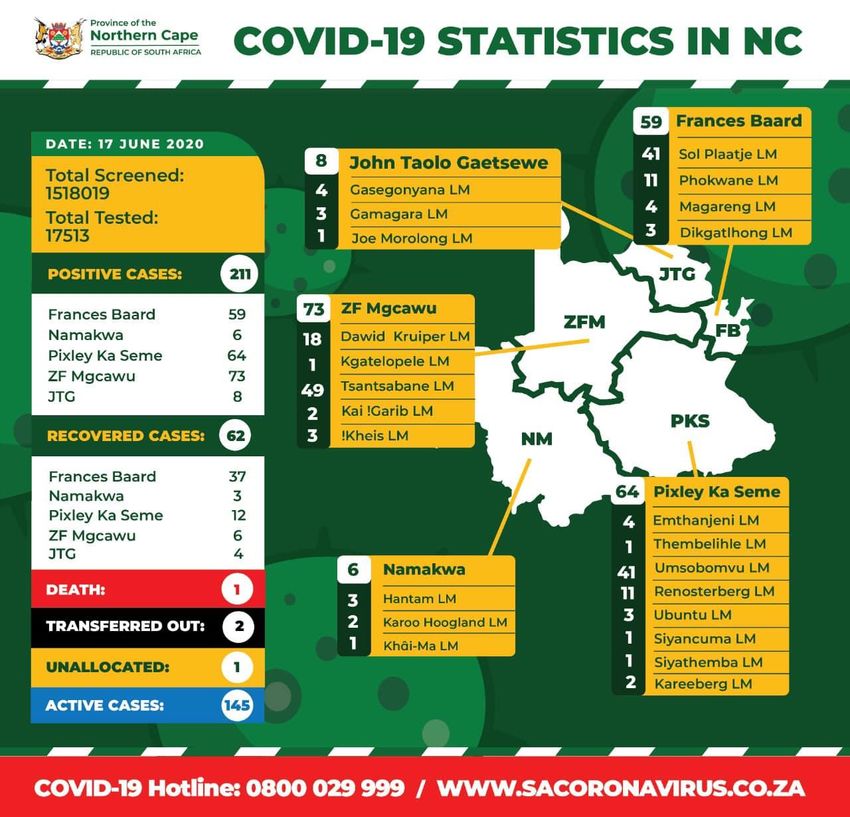
PROFILE: NAMAKWA DISTRICT                     3

                                                         CONTENT

1. Executive Summary ........................................................................................... 5
2. Namakwa District: Brief Overview .................................................................... 6
     2.1     Historical Perspective ............................................................................................................ 6
     2.2     Location ................................................................................................................................. 6
     2.2.1      Hantam Local Municipality................................................................................................ 7
     2.2.2      Kamiesberg Local Municipality.......................................................................................... 7
     2.2.3      Karoo Hoogland Local Municipality .................................................................................. 8
     2.2.4      Khai-Ma Local Municipality ............................................................................................... 8
     2.2.5      Nama Khoi Local Municpality ............................................................................................ 8
     2.2.6      Richtersveld Local Municipality......................................................................................... 8
     2.3     Spatial Status ......................................................................................................................... 9
     2.4     Land Ownership ................................................................................................................... 10
3. Social Development Profile ............................................................................. 10
     3.1     Key Social Demographics ..................................................................................................... 10
     3.1.1      Population ....................................................................................................................... 10
     3.1.2      Race, Age and Gender ..................................................................................................... 11
     3.2     Households .......................................................................................................................... 13
     3.3     Health Profile ....................................................................................................................... 13
     3.4     Covid-19 ............................................................................................................................... 14
     3.5     Poverty................................................................................................................................. 15
     3.5.1      Poverty Distribution ........................................................................................................ 15
     3.5.2      Inequality......................................................................................................................... 16
     3.5.3      Employment/Unemployment ......................................................................................... 16
     3.6     Crime ................................................................................................................................... 17
     3.7     Education and Skills Profile.................................................................................................. 18
4. Drivers of the Economy ................................................................................... 19
     4.1 Structure of the Economy ....................................................................................................... 19
     4.1.1 Primary Sector ................................................................................................................. 19
     4.1.2 Secondary Sector............................................................................................................. 20
     4.1.3 Tertiary Sector ................................................................................................................. 20
     4.1.4 Informal Sector................................................................................................................ 21
5. Service Delivery ............................................................................................... 21
     5.1     Water ................................................................................................................................... 21
     5.2     Sanitation............................................................................................................................. 21
     5.3     Human Settlements ............................................................................................................. 22
     5.4     Waste Management ............................................................................................................ 22
     5.5     Roads and Transport............................................................................................................ 23
     5.6     Electricity ............................................................................................................................. 23
6. Governance and Management ........................................................................ 24
     6.1     Municipal Perfofmance ....................................................................................................... 24
     6.2     Municipal Capacity .............................................................................................................. 25
     6.3     Traditional Affairs ................................................................................................................ 25
7. Projects to Diversify and Grow People and the Economy ........................... 26
     7.1     Social Development Projects ............................................................................................... 26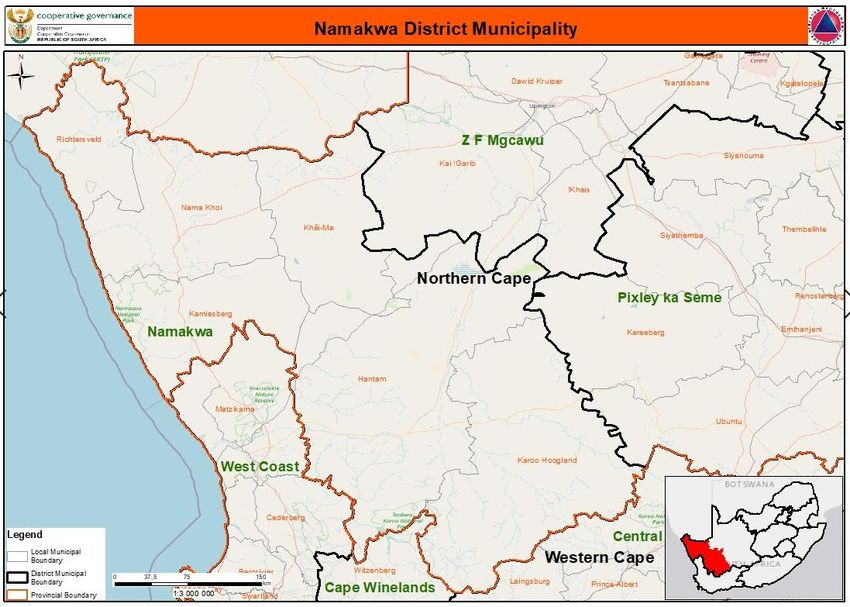
4
              PROFILE: NAMAKWA DISTRICT

     7.2     Spatial Development ........................................................................................................... 26
     7.2.1     Activity Corridor, Nodal and Growth Area ...................................................................... 26
     7.3     Infrastructure Projects ........................................................................................................ 27
     7.4     Economic Projects ............................................................................................................... 28
     7.4.1     Namakwa Special Economic Zone ................................................................................... 28
     7.4.2     Boegoebaai Deep Sea Port .............................................................................................. 29
     7.5     Environmental Forecast....................................................................................................... 29
8. Key Recommendations ................................................................................... 30
     8.1     Prioritise Integrated Development Plan .............................................................................. 30
     8.2     Investor and Sponsorship Opportunities............................................................................. 31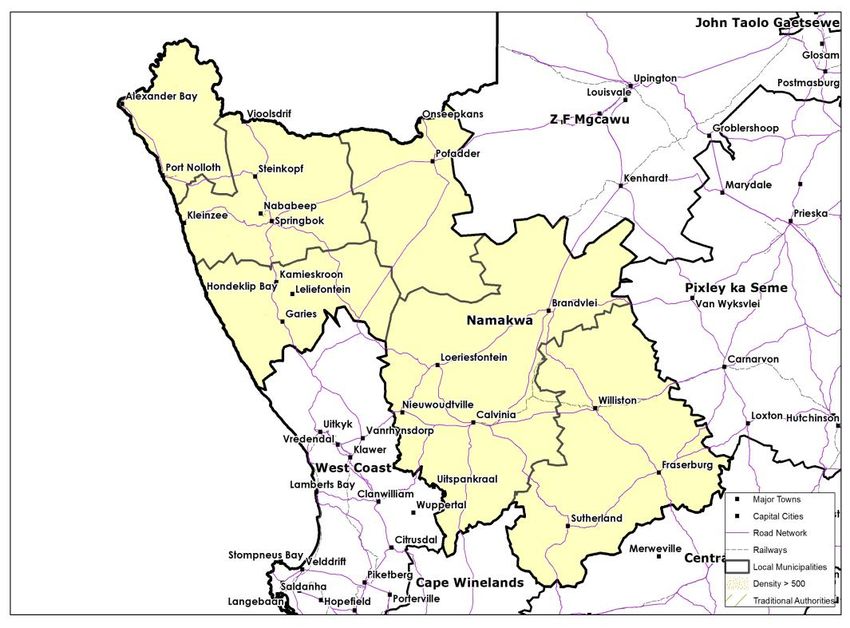
PROFILE: NAMAKWA DISTRICT   5

1. Executive Summary
The Namakwa District Municipality (NDM) is a Category C municipality located in
the Northern Cape Province. It is bordered by the republic of Namibia in the north,
ZF Mgcawu Local Municipality in the north-east, Cape Winelands District
Municipality in the south, West Coast District Municipality in the south-west,
Pixley Ka Seme District Municipality in the east, Central Karoo District
Municipality in the south-east, and the Atlantic Ocean in the west. It is the largest
district in the province, making up over a third of its geographical area. It is
comprised of six local municipalities: Nama Khoi, Hantam, Khai-Ma, Kamiesberg,
Karoo Hoogland and Richtersveld. The seat of the Namakwa District Municipality
is Springbok.

The district has a population of 139 370, which is 10.4 % of the total population of the
Northern Cape Province. The annual population growth rate for 2019 was 1.2 percent.
The district had a total number of 41 613 households with a population density of 1.1
people per square kilometers. There are 27 child headed households and 14 145
(37.6%) women headed households.

On 17 June 2020, the total number of confirmed Coronavirus COVID-19 cases in the
Northern Cape was 211 and 1 death. The Namakwa District only had 6 cases, with 3
infections in Hantam, 2 in Karoo Hoogland and 1 in Khai-Ma. 1 518 019 screenings
were done and 17 513 tests.

22.1% (30 801) of the the population lived below the lower poverty line in 2019. 31% of
the population older than 20 years had a matric or higher qualification in 2019. 17.4%
of the population older than 15 years have not completed grade 7 and is therfore not
funcionally literate.

In 2018, the mining sector is the largest within Namakwa District Municipality accounting
for R 3.4 billion or 35.6% of the total GVA in the district municipality's economy. The
sector that contributes the second most to the GVA of the Namakwa District Municipality
is the community services sector at 16.1%, followed by the trade sector with 11.8%. The
sector that contributes the least to the economy of Namakwa District Municipality is the
electricity sector with a contribution of R 136 million or 1.42% of the total GVA. The
economic situation in the Namakwa District Municipality is depended on the international
and national economic climate which is not favourable at this stage.
6
              PROFILE: NAMAKWA DISTRICT

2. Namakwa District: Brief Overview
2.1 Historical Perspective
The Namakwa District covers the region known for its cultural history, which was
preserved by the Nama and Khoisan tribes. It is home to the Nama people, the largest
group of Khoikhoi people who had originally populated the area around the Orange
River in southern Namibia and northern South Africa. About 80% of the population were
brutally killed by the German Empire between 1904 and 1907 in a racial extermination
during the Herero and Namaqua genocide. Nama people traditionally speak the
Khoekhoe language.

In the 1920s diamonds were discovered at the mouth of the Orange River, and
prospectors began moving there, establishing towns at Alexander Bay and Port Nolloth.
This accelerated the appropriation of traditional lands that had begun early in the
colonial period. Under apartheid, remaining pastoralists were encouraged to abandon
their traditional lifestyle in favour of village life, which partly accounts for the current
levels of poverty in the district.

In 1991, a part of Namaqualand (home of the Nama and one of the last true wilderness
areas of South Africa) was named the Richtersveld National Park. In December 2002,
ancestral lands, including the park, were returned to community ownership and the
governments of South Africa and Namibia began creating a trans-frontier park from the
west coast of southern Africa to the desert interior, absorbing the Richtersveld National
Park. Today, the Richtersveld National Park is one of the few places where the original
Nama traditions and language have survived.

2.2 Location
The Namakwa District Municipality (NDM) is situated in the north-western corner of South
Africa and borders the Atlantic Ocean to the west and Namibia to the north. It is also
bordered by the ZF Mgcawu and Pixley ka Seme Districts of the Northern Cape Province
to the North-East and East, respectively. It is borders by the Western Cape Province to
the South (the West Coast, Cape Winelands and Central Karoo District Municipalities).
The district is one of five districts in the Northern Cape Province and situated in the
western part of the province. The Namakwa District is the largest district geographically
in South Africa.1

1
    Namakwa District IDP Review 2019/2020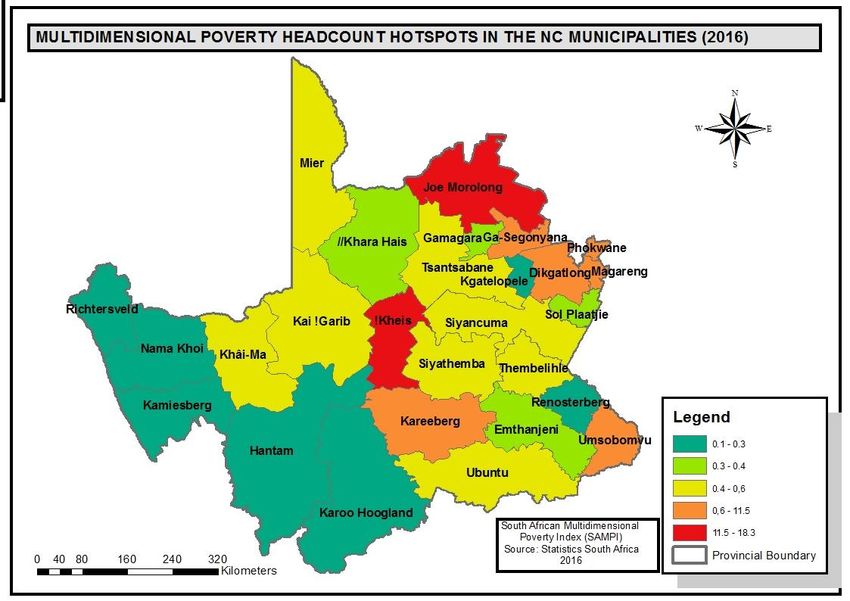
PROFILE: NAMAKWA DISTRICT   7

2.2.1 Hantam Local Municipality
The Hantam Local Municipality is the largest local municipality of six in the district,
making up a third of its geographical area. The municipality’s seat is in Calvinia, which
is approximately 400km from Cape Town, Springbok, Upington and Beaufort West. The
Hantam Municipality is well known for its wide-open spaces, stunning mountain ranges,
and nature reserves filled with an incredible array of plants and bulbs that cannot be
found anywhere else in the world.

2.2.2 Kamiesberg Local Municipality
The Kamiesberg Local Municipality is one of the smallerlocal municipalities of the six
that make up the district. It was established in 2001 in accordance with the demarcation
process. The municipality spans three topographic zones: from the sandy coastal
lowlands (Sandveld) to the mountainous central Kamiesberg escarpment (Hardveld),
and to the eastern plateau of Bushmanland.

There are no perennial rivers in the area. Water is obtained from subterranean sources.
Some of the water is pumped up by windmills, but most of the water to the communal
8
          PROFILE: NAMAKWA DISTRICT

areas comes from natural springs. Many of these springs are semi-perennial and the
salt content of the water can vary from year to year, causing problems.

2.2.3 Karoo Hoogland Local Municipality
The Karoo Hoogland Local Municipality is the second largest of the six local
municipalities in the district, making up a quarter of its geographical area. Hoogland is
an Afrikaans word meaning ‘highland' and Karoo is a Khoi word meaning ‘hard' or ‘dry'.
The name reflects the area, which has dry, arid and desert-like conditions.

2.2.4 Khai-Ma Local Municipality
The Khai-Ma Local Municipality is one of the six municipalities that make up the district,
accounting for 12% of its geographical area. The seat, Pofadder, is situated about
220km west of Upington and 165km east of Springbok. Farming settlements are:
Dwagga Soutpan, Vrugbaar, Raap-en-Skraap and Klein Pella.

2.2.5 Nama Khoi Local Municpality
The town of Springbok is the administrative centre of the Nama Khoi Local Municipality.
Nama and Khoisan people occupied this area for hundreds of years. Springbok is the
most densely populated area, is close to the N7, and functions as the sub-regional
centre for administrative, commercial and higher-order social facilities. Mining used to
form the backbone of the economy, with tourism being seen as the new frontier for
economic development.

2.2.6 Richtersveld Local Municipality
The Richtersveld Local Municipality is the smallest municipality of six in the district,
making up only 6% of its geographical area. The municipality is named after Reverend
W Richter, a Dutch missionary of the 20th century who opened a mission station in
Koeboes. The Richtersveld is a unique landscape surrounded by a variety of contrasts.
It is a conservation area. Rainfall is minimal and water is a scarce commodity, yet the
vast plains, which are considered a special place by some, are still a beautiful region
with unique characteristics that attract thousands of tourists. In Port Nolloth there is the
ocean, at Alexander Bay there is the Orange River, and at Lekkersing and
Eksteensfontein there is underground water that is a little brackish.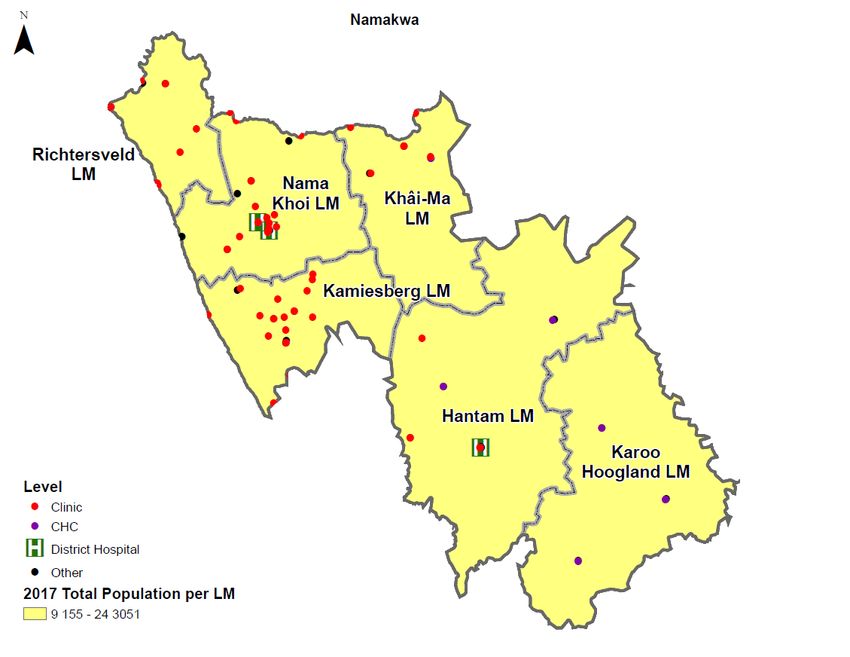
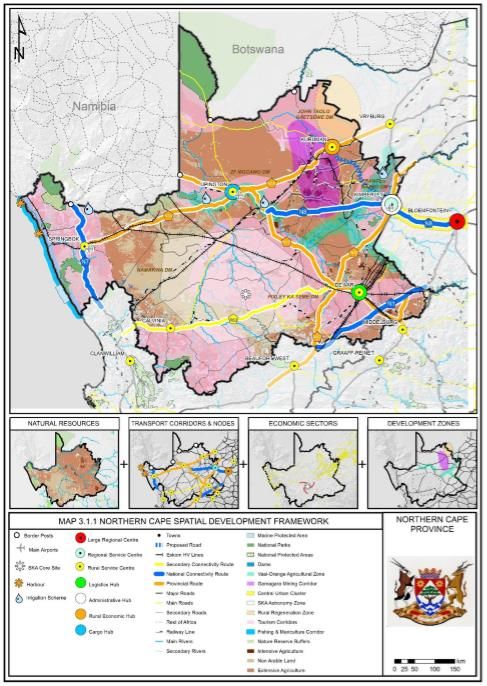
PROFILE: NAMAKWA DISTRICT   9

2.3 Spatial Status
The Namakwa District Municipality can be described as an arid region receiving some
of the lowest average rainfall levels in the country. Water scarcity and soil salinity
represent the main challenges facing agriculture in the district. In some areas, salinity
levels are so high that salt mining operations have been established. The two rivers that
are running through the district are the Orange River towards the northern boundary as
well as the Oliphants/Doring River system.

The National Spatial Development Framework (NSDF, 2019) identified the Namakwa
District as part of the Arid Innovation Region. Key national roads (N7 and N14) are
traversing the district. The N7 links South Africa with Namibia and the N14 is an
important link with districts to the east. The region comprises the arid and sparsely
populated western and south-western central parts of the country. It is set to be
significantly affected by future climate change trends and requires a consolidated
response. The NSDF (2019) make proposals such as: regional adaptation, economic
diversification and agriculture innovation at scale, limit expansion and development of
settlements, enhanced regional cross provincial collaboration, strong compacts with
role-players, enhanced ICD linkages, discouraging temporary settlements such as
mining or large-scale construction projects etc (NSDF, 2017: P171).
10
            PROFILE: NAMAKWA DISTRICT

The Namakwa region consists of the former Namaqualand and Hantam Karoo regions
and is bordered by the Orange River to the north and the Atlantic Ocean to the west.
Geographically, the region can be described as a semi-desert area with hot summers,
little rainfall and cold winters.

2.4 Land Ownership
The table below highlights the total area of the municipality under a land claim process.

                                            Sum of Land Claims
 Namkwa                                     1845,132
 NC total                                   5006,433
 SA total                                   20617,156

3. Social Development Profile
3.1 Key Social Demographics
3.1.1 Population
The Namakwa District Municipality has the lowest population of all districts in the
Northern Cape, although it is geographically the largest. With a population of 139 370
people, the Namakwa District housed 0.2% of South Africa's total population in 2019.
Compared to Northern Cape's average annual growth rate (2.05%), the growth rate in
Namakwa's population at 1.17% was about half than that of the province.
PROFILE: NAMAKWA DISTRICT 11 Within the District, the Richtersveld Local Municipality increased the most, in terms of population, between 2009 and 2019, with an average annual growth rate of 2.1%, the Karoo Hoogland Local Municipality had the second highest growth in terms of its population, with an average annual growth rate of 1.9%. The Kamiesberg Local Municipality had the lowest average annual growth rate of 0.15% relative to the other within the Namakwa District Municipality. 3.1.2 Race, Age and Gender In 2018, the Namakwa District Municipality's population consisted of 7.32% African (9 670), 8.96% White (11 800), 83.06% Coloured (110 000) and 0.65% Asian (862) people. The chart below compares Namakwa's population structure of 2019 to that of South Africa:
12
PROFILE: NAMAKWA DISTRICT
Population structure, Total, 2019
DC06 Namakwa vs. National
Male Female
DC06 75+
Namakwa 70-74
65-69
60-64
55-59
50-54
45-49
40-44
35-39
30-34
25-29
20-24
15-19
10-14
05-09
00-04
6,0% 4,0% 2,0% 0,0% 2,0% 4,0% 6,0%
Source: IHS Markit Regional eXplorer version 1946
By comparing the population pyramid of the Namakwa District Municipality with the
national age structure, the most significant differences are:
• There is a significant smaller share of young working age people - aged 20 to
34 (22.7%) - in Namakwa, compared to the national picture (26.9%).
• The area seems to be a migrant sending area, with many people leaving the
area to find work in the bigger cities.
• Fertility in Namakwa is significant lower compared to South Africa as a whole.
• The share of children between the ages of 0 to 14 years is significant smaller
(20.7%) in Namakwa compared to South Africa (28.6%). Demand for
expenditure on schooling as percentage of total budget within Namakwa District
Municipality will therefore be lower than that of South Africa.
Namakwa District Municipality's male/female split in population was almost equal with
49.96% males and 50.04% females in 2019. In total there were 69 700 (50.04%)
females and 69 600 (49.96%) males. This is different from the Northern Cape Province
where the female population counted 681 000 which constitutes 50.61% of the total
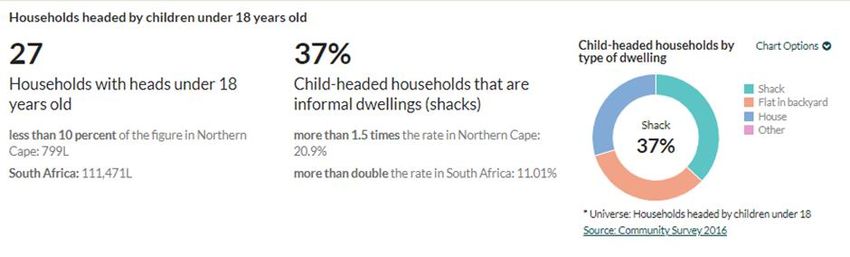
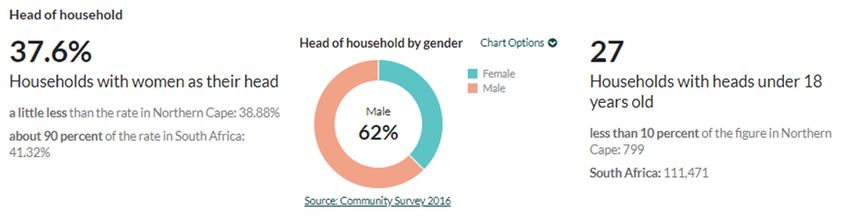
population of 1.34 million.PROFILE: NAMAKWA DISTRICT 13 3.2 Households In 2019, the Namakwa District comprised of 41 613 households. The average household size in 2008 decreased from approximately 3.4 individuals per household to 3.3 persons per household in 2019. Namakwa has 27 households with heads who are under 18 years old. 52% of these are headed by males while 48% are headed by females under 18 years of age. In 2016 STATSSA recorded the households headed by females at 37.6% (14 145) while men headed households constituted 62%. 3.3 Health Profile The leading causes of death in the district are injuries, non-communicable diseases, HIV and TB. Communicable diseases together with maternal, perinatal and nutritional conditions are the leading cause of death among infants below the age of 5 years.
14
         PROFILE: NAMAKWA DISTRICT

Health Facilities Mapped

3.4 Covid-19
On 17 June 2020, the total number of confirmed Coronavirus COVID-19 cases in the
Northern Cape was 211 and 1 death. By 17 June 2020, the Namakwa District only had
6 cases, with 3 infections in Hantam, 2 in Karoo Hoogland and 1 in Khai-Ma.
PROFILE: NAMAKWA DISTRICT 15 3.5 Poverty 3.5.1 Poverty Distribution In 2016, the South African Multidimensional Poverty Index reflected a poverty head count for the Northern Cape province was 6.6% whilst the poverty head count for Namakwa District was only 2,8%.
16
                                      PROFILE: NAMAKWA DISTRICT

3.5.2 Inequality
In 2018, the Gini coefficient in Namakwa District Municipality was at 0.566, which
reflects a marginal increase in the number over the ten-year period from 2008 to 2018.
The Northern Cape Province and South Africa, both had a more unequal spread of
income amongst their residents (at 0.604 and 0.63 respectively) when compared to
Namakwa District Municipality.

3.5.3 Employment/Unemployment
     Economically Active Population

                                      • Namakwa                                 • The Namakwa                            • In 2018
                                                                                                            Employment
                                                              Labour Force
                                                                             Participation

                                        District                                  District                                 Namakwa had
                                        Municipality's                            Municipality's                           36 200 people
                                        EAP was 48 000                            labour force                             employed,
                                        in 2018, which is                         participation rate                       which is 11.15%
                                        36.33% of its                             decreased from                           of the total
                                        total population                                                                   employment in
                                                                                         55.68% to                         Northern Cape
                                                                                         52.98%                            Province
                                                                                         between 2008 and
                                                                                         2018
PROFILE: NAMAKWA DISTRICT 17
The number of formally employed people in Namakwa District Municipality counted 31
400 in 2018, which is about 86.74% of total employment, while the number of people
employed in the informal sector counted 4 800 or 13.26% of the total employment.
Informal employment in Namakwa increased from 3 420 in 2008 to an estimated 4 800
in 2018.
Namakwa’s share of the total number of unemployed people in Northern Cape Province
is 9.36% (12 000 people unemployed in Namakwa). This represents an increase of 1
760 (1.7%) from 10 200 in 2008.
3.6 Crime
For the period 2007/2008 to 2017/2018 overall crime has decreased at an average
annual rate of 2.21% within the Namakwa District Municipality. Violent crime
decreased by 2.75% since 2007/2008, while property crimes increased by 1.82%
between the 2007/2008 and 2017/2018 financial years.
Property crime is a major problem for all the regions relative to violent crime. It is
evident that the property crime is a major problem for all the regions relative to the rest
of crime indices.
Contact Crimes Sexual Offences Property Related
Crimes
Police Station 2017/2018 2018/201 2017/2018 2018/2019 2017/2018 2018/2019
9
Alexander Bay 47 53 7 4 54 63
Calvinia 160 160 10 8 118 157
Fraserburg 45 57 2 3 34 26
Kamieskroon 96 83 7 3 37 34
Loeriesfontein 56 52 7 5 43 22
Nababeep 222 231 30 26 180 136
Pofadder 47 47 3 6 62 34
Port Nolloth 141 146 5 4 129 100
Springbok 244 253 20 18 159 159
Steinkopf 46 56 3 9 33 52
Williston 102 59 3 7 30 30
The top Ten worst crimes reported at police stations included: Murder, Gender based
violence and robbery. Property crimes comprise of crimes that are classified as less
violent in nature and involve acts against property. The crimes included in this index
are as follows: arson, malicious damage to property, crimen injuria, burglary at
residential premises, burglary at business premises, theft of motor vehicle and
motorcycle, theft out of or from motor vehicle, stock-theft, illegal possession of firearms18
PROFILE: NAMAKWA DISTRICT
and ammunition, drug-related crime, driving under the influence of alcohol or drugs,
all theft not mentioned elsewhere, commercial crime and shoplifting.
3.7 Education and Skills Profile
No of No of Private No of Special No of Learners No of
Schools Schools Schools Educators
72 09 01 21 908 777
Most schools in this district are in remote areas and a large number of them have
infrastructure assets which are under-utilised. This district has the largest number of
school hostels in the province, due to its geographical size. The District has one (1)
TVET college and no university.
Namakwa District's functional literacy rate of 81.12% in 2018 was higher than the
provincial rate of 79.05%, but lower National rate 84.83%.
The biggest group in terms of highest level of education for the age 15 years and older
is for Namakwa is those with Grade 7-9 at 29 200 followed by the category Grade 10-
11 making up a total of 17 400. This indicates that a huge number of young people are
lost to the education system between Grade 6 and 9, and further between Grade 9 and
12. Namakwa’s population with matric only constitutes 9.9% of the province. The
category with Matric and certificate and Matric plus a Bachelor’s degree stand at 5058
and 2120 respectively, constituting 31.9%.PROFILE: NAMAKWA DISTRICT 19
4. Drivers of the Economy
4.1 Structure of the Economy
With a GDP of R 10.5 billion in 2018 (up from R 6.49 billion in 2008), the Namakwa
District Municipality contributed 10.65% to the Northern Cape Province GDP of R 98.6
billion in 2018 increasing in the share of the Northern Cape from 11.85% in 2008.
In 2018, the Namakwa District Municipality achieved an annual growth rate of -0.54%
which is a slightly lower GDP growth than the Northern Cape Province's -0.31%, and is
lower than that of South Africa, where the 2018 GDP growth rate was 0.79%.
Gross Value Added (GVA) by broad economic sector - Namakwa District Municipality, 2018 [R billions]
Namakwa Northern Cape National Total Namakwa as Namakwa as
% of % of national
province
Agriculture 1.1 6.4 106.1 16.7% 1.01%
Mining 3.4 19.4 350.9 17.5% 0.97%
Manufacturing 0.2 3.0 572.9 6.2% 0.03%
Electricity 0.1 3.3 166.0 4.1% 0.08%
Construction 0.3 2.8 170.3 10.1% 0.17%
Trade 1.1 10.5 652.7 10.8% 0.17%
Transport 0.9 10.7 426.7 8.2% 0.21%
Finance 0.9 11.9 854.4 7.9% 0.11%
Community services 1.5 20.4 1,041.3 7.6% 0.15%
Total Industries 9.6 88.5 4,341.3 10.8% 0.22%
Source: IHS Markit Regional eXplorer version 1750
4.1.1 Primary Sector
In 2018, the mining sector is the largest within Namakwa District Municipality accounting
for R 3.4 billion or 35.6% of the total GVA in the district municipality's economy. Although
the Namakwa District Municipality was a fairly constant district without many changes
over the last few years, the district suddenly came into the limelight with the massive
expansion in the mining sector in the Khai Ma Local Municipality. Apart from the growing
mining interest in the district, the Boegoebay Port is also a potential catalytic project that
could potentially uplift the Namakwa District Municipality in various ways including
demographically, developmental, economic and infrastructure wise. Should this
development be implemented the NDM will also become more significant from a national
perspective and could potentially lure further investment. Unfortunately due to the global20
PROFILE: NAMAKWA DISTRICT
economic climate, the mining sector is estimated to grow the slowest with an average
annual growth rate of - 3.60%. The mining development in the District can benefit from
the new mining and renewable energy project if planned efficiently. Diversification and
the development of a competitive manufacturing sector is a must with agriculture and
mining as focus areas. In terms of access to basic services all the local municipalities
are outperforming national, barring the slight underperformance of the provision of
electricity in Karoo Hoogland and Hantam.
In the primary sector, agriculture is expected to grow faster at an average of 2.72%
annually from R 726 million in Namakwa District Municipality to R 830 million in 2023.
Most of the Orange River’s water is being used for the irrigation of high-value crops.
Groundwater is also widely used for agricultural, municipal, and industrial land use. The
main agricultural commodities produced in Namakwa District Municipality include small
stock, lucerne, vegetables, and grapes. Sheep farming is practised on a small scale in
Namakwa District Municipality from which wool and mutton products are produced.
Niche opportunities for agro-processing have been identified in the form of high-value
aquaculture (such as abalone).
4.1.2 Secondary Sector
Namakwa District Municipality had a total tourism spending of R 735 million in 2018
with an average annual growth rate of 10.3% since 2008 (R 275 million). Northern
Cape Province had a total tourism spending of R 4.39 billion in 2018 and an average
annual growth rate of 7.7% over the period. Total tourism spending in South Africa
increased from R 153 billion in 2008 to R 296 billion in 2018 at an average annual rate
of 6.8%.
In Namakwa District Municipality the tourism spending as a percentage of GDP in 2018
was 7.00%. Tourism spending as a percentage of GDP for 2018 was 4.45% in Northern
Cape Province, 6.06% in South Africa.
4.1.3 Tertiary Sector
The sector that contributes the second most to the GVA of the Namakwa District
Municipality is the community services sector at 16.1%, followed by the trade sector with
11.8%. The sector that contributes the least to the economy of Namakwa District
Municipality is the electricity sector with a contribution of R 136 million or 1.42% of the
total GVA.PROFILE: NAMAKWA DISTRICT 21
4.1.4 Informal Sector
The number of people employed in the informal sector counted 5 100 or 12.08% of
the total employment. Informal employment in Namakwa increased from 3 840 in 2009
to an estimated 5 100 in 2019
5. Service Delivery
5.1 Water
Number of households within Namakwa District Municipality below the RDP-level has
decreased annually and now stands at 389 (from 1 490 in 2008). This represents a -
12.55% decrease per annum.
Table Error! No text of specified style in document..1: Households by type of water access - Namakwa District Municipality,
2018
Piped Piped Communal piped Communal piped No Total
water water water: less than water: more than formal
inside in yard 200m from dwelling 200m from dwelling piped
dwelling (At RDP-level) (Below RDP) water
Richtersveld 3,140 1,130 53 7 66 4,400
Nama Khoi 12,900 2,570 121 19 107 15,700
Kamiesberg 1,400 2,080 7 2 22 3,510
Hantam 4,960 2,590 88 10 43 7,700
Karoo 3,240 1,350 9 0 17 4,610
Hoogland
Khai-Ma 2,410 1,680 10 1 95 4,200
Total 28,064 11,394 289 40 349 40,136
Namakwa
Source: IHS Markit Regional eXplorer version 1750
5.2 Sanitation
No Households by type of sanitation
Pit Latrine
Toilet Bucket Toilet
4%
3% 1% VIP
16%
No Toilet
Bucket Toilet
Flush Toilet
76% Pit Latrine
VIP
Flush Toilet
Households by type of sanitation - Richtersveld, Nama Khoi, Kamiesberg, Hantam, Karoo Hoogland and Khai-Ma local
municipalities, 201822
PROFILE: NAMAKWA DISTRICT
Flush toilet Ventilation Pit toilet Bucket No toilet Total
Improved Pit system
(VIP)
Richtersveld 3,700 421 161 18 94 4,400
Nama Khoi 12,400 2,020 789 130 369 15,700
Kamiesberg 1,570 1,620 80 144 95 3,510
Hantam 6,590 706 106 96 203 7,700
Karoo Hoogland 3,030 1,160 214 59 145 4,610
Khai-Ma 3,290 509 140 24 230 4,200
Total 30,597 6,443 1,490 471 1,135 40,136
Namakwa
Source: IHS Markit Regional eXplorer version 1750
The number of households without hygienic toilets in Namakwa District Municipality
this decreased annually at a rate of -1.58% (from 3 630 to 3 100 in 2018).
5.3 Human Settlements
Of the 37 669 households Namakwa District Municipality had a total number of 24 100
(60.14% of total households) very formal dwelling units, a total of 14 000 (34.76% of
total households) formal dwelling units and a total number of 971 (2.42% of total
households) informal dwelling units. Backlog for formal dwelling were 1 930 in 2008
within Namakwa District Municipality and has increased annually (at 0.57%) to 2 050 in
2018.
5.4 Waste Management
Namakwa District Municipality had a total number of 33 600 (83.77%) households which
had their refuse removed weekly by the authority, a total of 1 180 (2.93%) households
had their refuse removed less often than weekly by the authority and a total number of
4 520 (11.26%) households which had to remove their refuse personally (own dump).PROFILE: NAMAKWA DISTRICT 23
Figure: Households by refuse disposal - Namakwa, Northern Cape, and National Total, 2018
5.5 Roads and Transport
According to the Namakwa District municipality’s IDP of 2019/20, the current condition
of tarred roads within the district is good particularly the national roads (the N14 and the
N7). However, the condition of the gravel roads is poor. The District municipality and
individual municipalities have variety of plans and through collaboration with the
Department of Roads and Public Works to pave internal gravel roads. In addition, to the
storm water management issues on some roads in the urban areas which makes them
prone to flooding.
The available modes of public transport available in the district include minibus/tax and
bus.
5.6 Electricity
Access to Electricity24
PROFILE: NAMAKWA DISTRICT
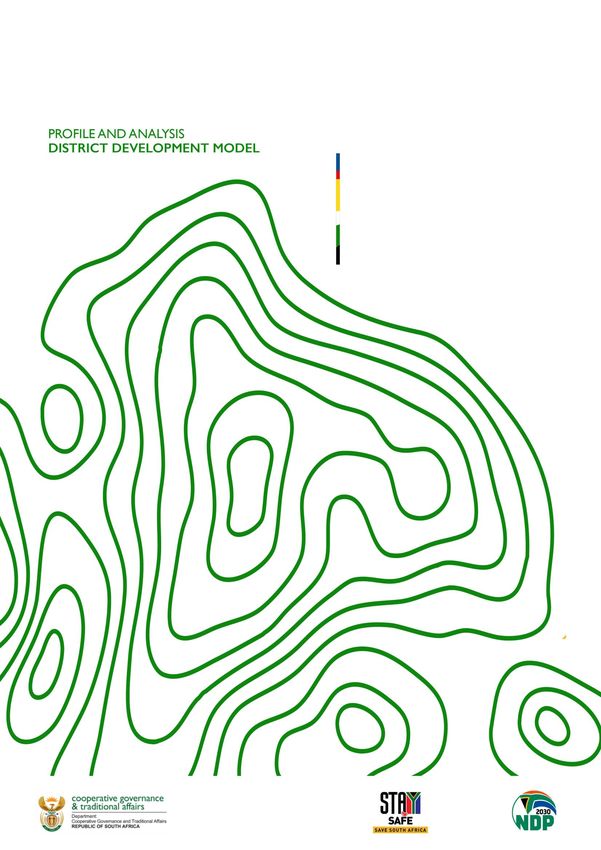
Households by Electricity Type
7% 7%
Electricity for Lighting Only
Electricity for Lighting &
Other Purposes
No Electricity
86%
Source: IHS Markit Regional eXplorer version 1750
6. Governance and Management
6.1 Municipal Perfofmance
In terms of governance, the first indicator represents the degree to which voters
participate in local elections. The following graph illustrates the number of voters and
the political parties’ performance in the 2016 municipal elections2:
The table below gives highlights of key performance and governance parameters for
the district and its 6 local municipalities.
Table: Municipality performance
Municipality Audit Outcomes Political and Critical posts Financial
2017/18 administrative filled at senior Viability
stability level
Namakwa DM Unqualified Stable All posts filled Municipality is
(Unchanged) viable
Hantam Qualified with Politically fairly Vacancies filled Municipality is
Findings stable viable
(Unchanged)
2
https://wazimap.co.za/profiles/district-DC6-namakwa/PROFILE: NAMAKWA DISTRICT 25
Municipality Audit Outcomes Political and Critical posts Financial
2017/18 administrative filled at senior Viability
stability level
Kamiesberg Qualified with Politically stable CFO posts does Municipality is not
Findings not comply with viable
(Regressed) regulations
Karoo Hoogland Unqualified Politically CFO vacant Current Viability
(Improved) unstable. Caucus compromised by
of majority party non-adherence to
unstable SCM prescripts
Khai-Ma Qualified with Stable Corporate Financially
Findings Services and distressed
(regressed) Technical
Directors vacant.
Nama Khoi Qualified with Politically CFO, Corporate Municipality in
Findings unstable due the Services and financial distress
(Unchanged) coalition Technical
arrangement. Directors post
vacant
Richtersveld Qualified with Politically fairly MM not filled Municipality is not
Findings stable since 2016 and viable. Ordered
(Unchanged) Technical director by Court to take
post vacant over Alexander
Bay and service
6.2 Municipal Capacity
The total number of staff in all the municipalities of the District reported to the StatsSA
non-financial census in 2019 was 2 070, with an overall vacancy tate of 3,2%. This
masks challenges in local municipalities such as Karoo Hoogland as illustrated in the
table below:
Northern Cape Full-time Part-time Vacant Total Vacancy rate
posts
Hantam Local Municipality 156 10 24 190 12,6%
Kamiesberg Local Municipality 91 0 5 96 5,2%
Karoo Hoogland Local 67 0 20 87 23,0%
Municipality
Khâi-Ma Local Municipality 90 0 5 95 5,3%
Nama Khoi Local Municipality 299 0 3 302 1,0%
Namakwa District Municipality 84 1077 7 1168 0,6%
Richtersveld Local Municipality 107 17 8 132 6,1%
District TOTAL 894 1104 72 2070 3,5%
6.3 Traditional Affairs
There are no traditional authorities in Namakwa District, however the Khoi-San consists
of five main groupings namely the Cape-Khoi, Griqua, Koranna, Nama and San. Many
of these main groupings have various subgroupings.26
PROFILE: NAMAKWA DISTRICT
While legislation has over many decades made provision for the statutory recognition
of traditional communities and leaders, there has never before been provision for similar
recognition of the Khoi-San communities and leaders.
The Traditional and Khoi-San Leadership Act, 2019 (Act No. 3 of 2019), which was
published in the Government Gazette on 28 November 2019, is of historic value as it is
the first legislation that provides for the statutory recognition of the Khoi-San
communities and leaders, provided they meet the criteria contained in the Act. However,
the Act has not yet commenced, because its commencement date has not yet been
proclaimed. Once the Act commences, a Commission on Khoi-San Matters will be
established to receive and investigate applications for recognition of Khoi-San
communities and leaders. The Commission will make recommendations to the Minister
in this regard and the Minister will have the power to recognise such communities and
leaders. There is thus currently no legally recognised Khoi-San communities or leaders
in South Africa, the Act makes provision for two Khoi-San leadership positions namely
senior Khoi-San leaders and branch heads. The recognised senior Khoi-San leaders
will have personal jurisdiction over their communities.
7. Projects to Diversify and Grow People and the Economy
7.1 Social Development Projects
Project Period Cost Estimate
Sutherland: Sport Facility 2019/20 R 7 505 669.60
(IDP)
Paving of Streets: GARIES 2019/20 R 5 784 993,95
(IDP)
7.2 Spatial Development
7.2.1 Activity Corridor, Nodal and Growth Area
The Northern Cape PSDF is aligned with the proposals as capture into the NSDF.
Figure 8 depicts a focus on enhanced regional connectivity, inter-regional and national
development corridors and routes, integrated urban clusters, economic infrastructure
networks, infrastructure to support water and electricity security and flows, productive
mining, the managing of large-scale land developments and efficient ecological, trade
connectivity and social service infrastructure.PROFILE: NAMAKWA DISTRICT 27
Figure: NC PSDF (2019:P 115)
The agricultural and mining sectors as well as the potential growth in manufacturing in
the district are largely dependent on an efficient freight transport system. The location
of the district within the Northern Cape provide strong linkages towards Namibia to the
north and positions the province as a logistical hub for goods and services to be
transported towards the Northwest of South Africa, especially through the N7 corridor.
(RDP, 2017: P268).
7.3 Infrastructure Projects
Project Period Cost Estimate
Construction of the New NC355 2019/20 The total budget of the project is
Road from Klipfontein to R 79.09 million, and comprise of
Hondeklip Bay Phase 2 Construction Cost of R 57.93
million or 73.24% and
Professional Fees of R 21.16
million or 26.75% respectively.28
PROFILE: NAMAKWA DISTRICT
Project Period Cost Estimate
Construction of the New Port 2018/19 The total budget of the project is
Nolloth Community Health R 107.51 million, and comprise of
Centre (CHC): Construction Cost of R 91 million
or 84.64% and Professional Fees
of R 16.51 million or 15.36%
respectively
7.4 Economic Projects
7.4.1 Namakwa Special Economic Zone
The Northern Cape Department of Economic Development and Tourism, in conjunction
with the national Department of Trade and Industry (the dti), is in the process of finalising
submission documents for the declaration of a Namakwa Special Economic Zone.
The planned Namakwa Special Economic Zone to be established in the Aggeneys
region of the Namakwa District of the Northern Cape Province will have a transformative
effect on the local, regional, provincial and national economies.
The anchor investor of the SEZ will be Vedanta Zinc International, which is
already running the Gamsberg Zinc Mine and intends to build a smelter. The SEZ
would advance the aims of developing infrastructure, accelerating skills development
and empowerment, and consolidating economic development in the Northern Cape.
The location of the project is ideal. Aggeneys is in the Khai-Ma Local Municipality within
the Namakwa District Municipality of the Northern Cape Province. Aggeneys is 66 km
from Pofadder (headquarters of the local municipality) and 110 km from Springbok,
where the office of the district municipality is located. All three towns are on the N14,
the national road that links Springbok with Pretoria.
The proposed Namakwa SEZ is strategically located along a bulk commodity
corridor, which runs from a planned port on the Atlantic coast (the Boegoebaai Deep
Port Harbour) through Aggeneys to the large urban centre of Upington and beyond to
the concentrations of iron ore and manganese ore at Sishen and Kathu. Upington Arport
is capable of handling large aircraft.
The railway line that currently transports ore from Sishen to the coast at Saldanha is
one of the engineering marvels of the world, moving 40-million tons every year along an
861 km route.PROFILE: NAMAKWA DISTRICT 29
7.4.2 Boegoebaai Deep Sea Port
The Northern Cape is planning for a massive harbour development to be located at one
of South Africa’s few natural deep-water sites at Boegoe Baai on the arid Namaqualand
coastline. The mooted development is estimated at about R40 billion and could anchor
the transformation of the province’s economic landscape.
A new deep-water harbor could provide supplementary or alternative transport options
as well as contribute to making minerals beneficiation in the province feasible.
Education and skills development will of course be of critical importance.
7.5 Environmental Forecast
The Northern Cape is planning for a massive harbour development to be located at one
of South Africa’s few natural deep-water sites at Boegoe Baai on the arid Namaqualand
coastline. The mooted development is estimated at about R40 billion and could anchor
the transformation of the province’s economic landscape.
The development had been undertaken subsequent and related large-scale
industrialization and commercialization phases could see the Northern Cape could
attract a total investment of R200 billion investment resulting in the creation of as many
as 50 000 permanent jobs. Potentially this is a win-win situation. Logistics companies
serving the Kalahari minerals complex are constrained in their ability to transport bulk
mineral commodities to Saldanha Bay and elsewhere.
A new deep-water harbor could provide supplementary or alternative transport options
as well as contribute to making minerals beneficiation in the province feasible.
Education and skills development will of course be of critical importance.
Table: NDM Climate Change Vulnerability30
PROFILE: NAMAKWA DISTRICT
Source: NC Provincial Report on Socio-Economic Challenges 2019
8. Key Recommendations
8.1 Prioritise Integrated Development Plan
The Namakwa District Municipality is an arid region receiving some of the lowest
average rainfall levels in the country. Water scarcity and soil salinity represent the
main challenges facing agriculture in NDM. In some areas, salinity levels are so high
that salt mining operations have been established. However the region has two rivers
running through it, the Orange River towards the northern boundary as well as the
Oliphants/Doring River system. Most of the Orange River’s water is being used for the
irrigation of high-value crops. Groundwater is also widely used for agricultural,
municipal and industrial land use. The main agricultural commodities produced in
NDM, according to the Provincial Growth and Development Plan (NC PGDP 2018)
include small stock, lucerne, vegetables, and grapes. Sheep farming is practised on a
small scale in NDM from which wool and mutton products are produced. NichePROFILE: NAMAKWA DISTRICT 31
opportunities for agro-processing have been identified in the form of high-value
aquaculture (such as abalone).
The District Municipality has identified key strategic development plans for possible
future investment. When fully funded through provincial and national allocations, these
will have major catalytic impacts within the Namakwa region. Based on their
comparative advantage, the focus is based on the three municipalities in Namakwa
Region, with each focussing on the following economic activities:
• Richtersveld (Port Nolloth) – Alluvial Mining, Mini Waterfront, Fishing and
Acquaculture, Small Ships/ Boat Building and Maintenance
• Nama Khoi (Kleinsee) – Special Economic Zone and Aquaculture use
• Kamiesberg (Hondeklipbaai) – Fishing and Aquaculture, Alluvial Mining
The coastal strip is also ideal for renewable energy (wind and wave) projects and could
benefit from future investments and projects in this regard.
8.2 Investor and Sponsorship Opportunities
The anchor investor of the SEZ will be Vedanta Zinc International, which is
already running the Gamsberg Zinc Mine. Vedanta, a minerals company has
plans to build a smelter within the Khai-Ma Local municipality. The SEZ would
advance the aims of developing infrastructure, accelerating skills development and
empowerment, and consolidating economic development in the Northern Cape. The
implications for this further investment is that municipal services will have to enhanced
to match the demand and the likely population rise resulting from the accompanying
economic activity.
The Northern Cape Provincial Government is pursuing discussion with the company
to explore possible avenues for support to the surrounding municipalities.32
PROFILE: NAMAKWA DISTRICTYou can also read