Study of the seasonal variation in Aeolus wind product performance over China using ERA5 and radiosonde data
←
→
Page content transcription
If your browser does not render page correctly, please read the page content below
Atmos. Chem. Phys., 21, 11489–11504, 2021
https://doi.org/10.5194/acp-21-11489-2021
© Author(s) 2021. This work is distributed under
the Creative Commons Attribution 4.0 License.

Study of the seasonal variation in Aeolus wind product performance
over China using ERA5 and radiosonde data
Siying Chen1 , Rongzheng Cao1 , Yixuan Xie1 , Yinchao Zhang1 , Wangshu Tan1 , He Chen1 , Pan Guo1 , and Peitao Zhao2
1 School   of Optics and Photonics, Beijing Institute of Technology, Beijing 100081, China
2 Meteorological   Observation Center of CMA, Beijing 100081, China

Correspondence: Yinchao Zhang (ychang@bit.edu.cn) and Peitao Zhao (peitaozhao@163.com)

Received: 7 April 2021 – Discussion started: 21 April 2021
Revised: 7 July 2021 – Accepted: 7 July 2021 – Published: 2 August 2021

Abstract. Aeolus wind products became available to the            1   Introduction
public on 12 May 2020. In this study, Aeolus wind observa-
tions, L-band radiosonde (RS) data, and the European Cen-
tre for Medium-Range Weather Forecasts fifth-generation at-       Global wind field data are indispensable meteorological
mospheric reanalysis (ERA5) data were used to analyze the         parameters for weather forecasting (Ishii et al., 2017). The
seasonality of Aeolus wind product performance over China.        European Space Agency (ESA) proposed the Atmospheric
Based on the Rayleigh-clear and Mie-cloudy data, the data         Dynamics Mission Aeolus (ADM-Aeolus) in 1999. The
quality of the Aeolus effective detection data was verified,      Aeolus is equipped with a 355 nm direct-detection wind
and the results showed that the Aeolus data were in good          lidar, which uses a single-view detection method to obtain
agreement with the L-band RS and ERA5 data. The Aeolus            the horizontal line-of-sight (HLOS) component of the
data relative errors in the four regions (Chifeng, Baoshan,       three-dimensional wind field from space. In addition, it
Shapingba, and Qingyuan) in China were calculated based           adopts a dual-channel design and uses different frequency
on different months (July to December 2019 and May to             discriminators to receive the Mie and Rayleigh channel
October 2020). The relative error in the Rayleigh-clear data      signals (Stoffelen et al., 2005; Reitebuch, 2012). Aeolus
in summer was significantly higher than that in winter, with      was successfully launched on 22 August 2018, becoming
the mean relative error parameter in July 174 % higher than       the world’s first spaceborne wind lidar in orbit. It then
that in December. The mean random error increased by              sent back the first batch of wind profile data, proving
0.97 m s−1 in July compared with December, which also sup-        that the satellite-borne direct-detection wind lidar could
ported this conclusion. In addition, the distribution of the      provide global wind profiles (Reitebuch et al., 2019). On
wind direction and high-altitude clouds in different months       12 May 2020, ESA opened Aeolus’s wind measurement
(July and December) was analyzed. The results showed that         products to the public (https://earth.esa.int/eogateway/
the distribution of the angle between the horizontal wind di-     news/aeolus-data-now-publicly-available,        last   access:
rection of the atmosphere and the horizontal line of sight        13 March 2021), including Level 1B (L1B) and Level 2B
had a greater proportion in the high error interval (70–110◦ )    (L2B) products. Among these, L2B products provide fully
in summer, and this proportion was 8.14 % higher in July          processed HLOS wind profiles after correction of temper-
than in December. The cloud top height in summer was ap-          ature and pressure effects (European Space Agency et al.,
proximately 3–5 km higher than that in winter, which might        2008), which were used in the present study.
decrease the signal-to-noise ratio of Aeolus. Therefore, the         To accurately calibrate the Doppler lidar carried on Ae-
wind product performance of Aeolus was affected by sea-           olus, a dedicated calibration and validation team has carried
sonal factors, which might be caused by seasonal changes in       out a series of verification and comparison studies on Aeolus’
wind direction and cloud distribution.                            wind products. After the launch of Aeolus, a special verifi-
                                                                  cation study was immediately performed. The main verifica-
                                                                  tion methods have included radiosonde (Baars et al., 2020)

Published by Copernicus Publications on behalf of the European Geosciences Union.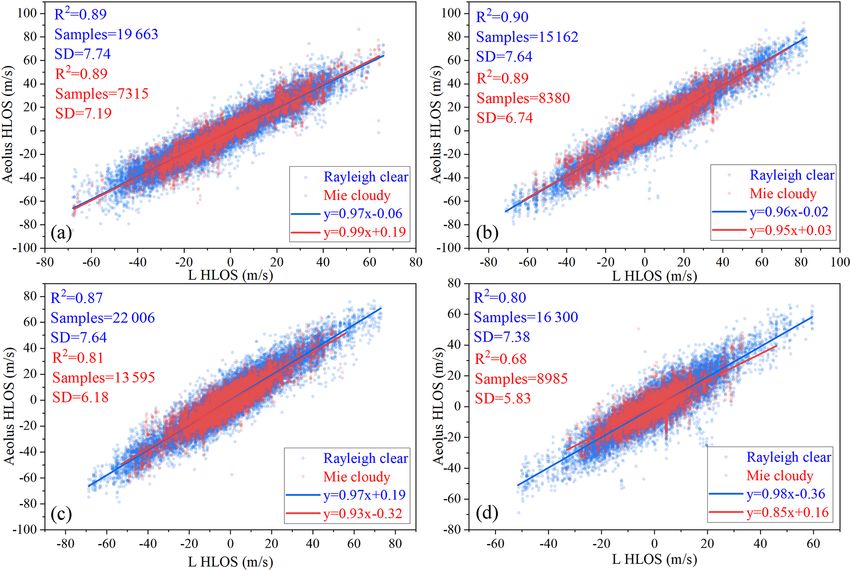
11490 S. Chen et al.: Study of the seasonal variation in Aeolus wind product performance over China
and airborne lidar (Lux et al., 2020; Witschas et al., 2020), tained from the L2B data. Based on the recommendations
in which Aeolus’s prototype atmospheric laser Doppler in- of the ECMWF (Rennie and Isaksen, 2020) and the actual
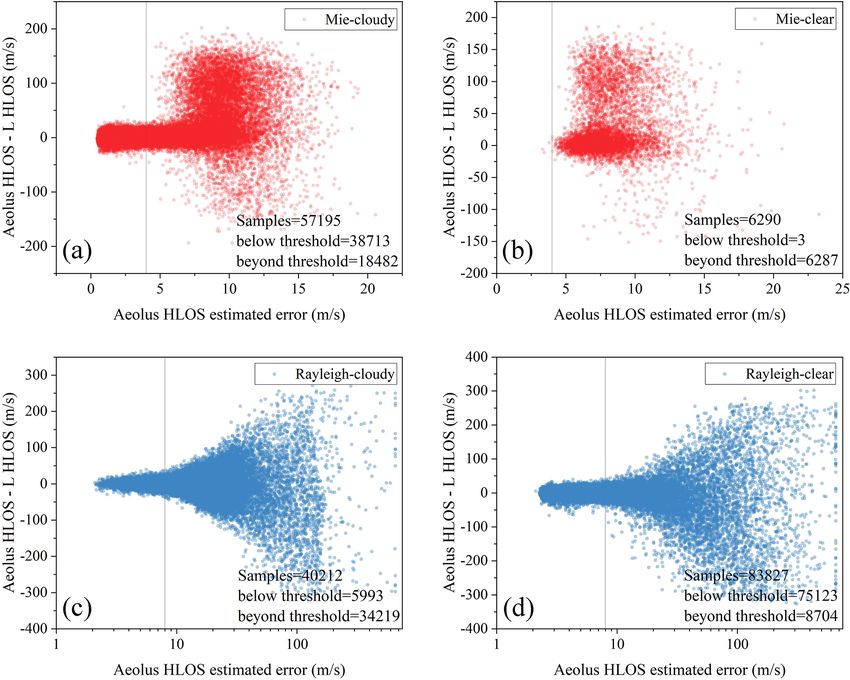
strument airborne demonstrator was used. Over the follow- data situation used in the present study (Fig. 1), the thresh-
ing 2 years, researchers worldwide completed regional ver- olds of the estimated errors were 8 m s−1 (Rayleigh-clear)
ification of the Aeolus detection data using various detec- and 4 m s−1 (Mie-cloudy). In this study, the Mie-clear and
tion methods, including satellites (Shin et al., 2020), ground- Rayleigh-cloudy data were discarded because the remaining
based lidar (Hauchecorne et al., 2020), ground-based wind valid data points were too few.
profiler radar (Belova et al., 2021; Guo et al., 2021), and
radiosonde (Liu et al., 2021). In addition, global Aeolus 2.2 L-band radiosonde wind data
data verification studies using the numerical weather pre-
diction (NWP) model have been undertaken (Rennie and The L-band RS is widely used to obtain the true situation
Isaksen, 2019; Martin et al., 2021). These verifications have of the atmospheric environment, and its detection altitude
deepened our understanding of Aeolus data quality, with reaches 30 km (Guo et al., 2016). In the present study, the L-
some factors discovered that affect Aeolus data quality dur- band RS wind data were the valid data detected by the four
ing the verification process, such as solar background ra- L-band RS stations. Matching the geographical location and
diation (Zhang et al., 2021), satellite flight direction (Guo time of the L-band lidar required special attention. For the
et al., 2021), and seasonal changes (Martin et al., 2021). geographical location, most of the valid L-band RS detec-
The European Centre for Medium-Range Weather Fore- tion data used in the present study had a balloon drift of less
casts (ECMWF) has revised the data processing algorithm than 0.5◦ (longitude or latitude). Only a few data points in
over time, including the temperature gradient correction al- winter had a maximum balloon drift of approximately 1.6◦ .
gorithm for M1, which is the main mirror of the Aeolus tele- The detection time of the L-band RS network in China was
scope, to solve the problem of seasonal changes (Rennie and 00:00 and 12:00 UTC. Generally, the time of launching the
Isaksen, 2019). ball is approximately 45 min earlier than the detection time,
To date, very few studies on the seasonal fluctuation in Ae- which is 1 to 2 h away from the transit time of Aeolus. To
olus wind product performance over China have been under- reduce the influence of time and geographical location dif-
taken, especially using actual detection data. After the im- ferences in the present study, ERA5 data were used as the
plementation of the new M1 deviation correction scheme, reference data.
the effect of system thermal performance changes on Aeo-
2.3 ERA5 data
lus’ seasonal fluctuation is significantly reduced, which has
led to systematic errors lower than 1 m s−1 (Rennie and Isak- The reanalysis dataset is often used as a reference for
sen, 2020). However, the actual atmospheric conditions dur- meteorological data analysis (Hersbach et al., 2020).
ing different seasons still affect the detection performance of ERA5 data provided by the ECMWF were used in
the lidar. the present study as the reference data. The cur-
In the present study, the variation in the Aeolus wind prod- rent observation dataset used for ERA5 assimilation
uct performance during different seasons was analyzed us- does not contain the observation results of Aeolus
ing Aeolus L2B wind products in four regions of China (https://confluence.ecmwf.int/pages/viewpage.action?
over 12 months (July to December 2019 and May to Octo- pageId=82870405#ERA5:datadocumentation-Table14, last
ber 2020) and was compared to the L-band radiosonde (L- access: 27 July 2021); therefore, there was no mutual
band RS) detection and ECMWF Reanalysis v5 (ERA5) influence between the L2B data of Aeolus and the reanalysis
data. Two conjectures regarding Aeolus’s different wind data of ERA5. In addition to the zonal wind vector u and
product capabilities were introduced and verified. the meridional wind vector v, the cloud coverage provided
in ERA5 was used in the present study (Sect. 3.2.2). Be-
cause of the high resolution of ERA5 regarding time and
2 Data and methods geographical location, after matching well with Aeolus data,
the difference between ERA5 and L-band RS data was used
2.1 Aeolus L2B wind products to represent the wind difference between Aeolus and the
L-band RS due to time and geographic differences to a
A sun-synchronous dawn–dusk orbit with a height of approx- certain extent.
imately 320 km is selected by Aeolus, and the orbit repeats its
ground track every 7 d (European Space Agency et al., 2008). 2.4 Data matching
The transit time of Aeolus over central and eastern China
is at approximately 10:00 and 22:00 UTC. In the present The collocation distance suggested by the
study, the criteria for judging the validity of the Aeolus data CAL/VAL implementation plan (https://earth.
were the validity flags (0 is invalid, and 1 is valid) and the esa.int/eogateway/documents/20142/1564626/
estimated errors (threshold requirements), which were ob- Aeolus-Scientific-CAL-VAL-Implementation-Plan.pdf,
Atmos. Chem. Phys., 21, 11489–11504, 2021 https://doi.org/10.5194/acp-21-11489-2021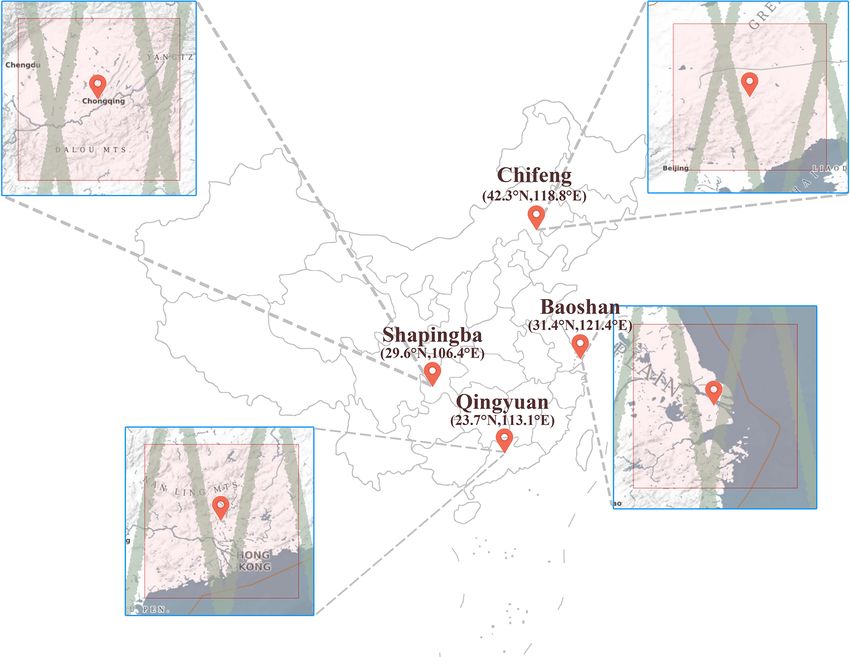
S. Chen et al.: Study of the seasonal variation in Aeolus wind product performance over China                                     11491

Figure 1. Difference between the Aeolus HLOS and L HLOS wind components as a function of estimated errors for (a) Mie-cloudy, (b) Mie-
clear, (c) Rayleigh-cloudy, and (d) Rayleigh-clear. Samples mean the number of data points, and the samples below or beyond the threshold
are also listed. Reference lines are the screening threshold of estimated errors: 4 m s−1 (Mie) and 8 m s−1 (Rayleigh).

last access: 27 July 2021) is 100 km around the ground                 where, VL/ERA5 represents the total horizontal wind speed
site, but for a single site, there are too few data points that        provided by the L-band RS data or ERA5 data. θL/ERA5 rep-
meet the suggestion per month. To compromise between the               resents the wind direction of the total horizontal wind vector.
consistency of meteorological conditions and abundance of              θHLOS is the azimuth of Aeolus. The ERA5 wind data have
detection data, the Aeolus L2B data were compared with                 full, u, and v wind vector information and can calculated
the ERA5 and L-band RS detection data, within a ±2.5◦                  the VHLOS through two components. However, the result is
(latitude and longitude) geographical range (Fig. 2) near              the same as that calculated by Eq. (1) after the total wind
the target L-band RS station. The four L-band RS stations              vector has been composited.
shown in Fig. 1 were selected because they possessed                      For time matching, the L-band RS and ERA5 take the lat-
obvious differences in geographical location and meteoro-              est detection data from the Aeolus transit to the target area
logical conditions. The main characteristics of the datasets           (±2.5◦ near the L-band RS station). Geographical location
used in the comparison are listed in Table 1. The main                 matching was determined by selection of the L-band RS sta-
processing procedures are shown in Fig. 3, and more details            tion. The Aeolus data select the detection data within a ±2.5◦
are discussed in the following.                                        (latitude and longitude) rectangular area centered on the L-
   The L2B data are the result of the single-component wind            band RS station (rectangular red area in Fig. 2). For the
measurements of Aeolus; therefore, it was necessary to de-             ERA5 data, the data point closest to the latitude and longi-
compose the L-band RS and ERA5 data in the direction of                tude of the Aeolus data was selected. In the vertical direc-
the Aeolus HLOS. The Aeolus has different azimuths at dif-             tion, owing to the difference in the vertical resolution of the
ferent locations and distances, which have been given in the           three datasets, L-band RS and ERA5 data had to be matched
L2B data. RS and ERA5 data were decomposed in the HLOS                 with the Aeolus data via linear interpolation. Linear interpo-
direction:                                                             lation is a method of curve fitting using linear polynomials to
                                                                      construct new data points within the range of a discrete set of
VHLOS = VL/ERA5 × cos θHLOS − θL/ERA5 ,                     (1)

https://doi.org/10.5194/acp-21-11489-2021                                             Atmos. Chem. Phys., 21, 11489–11504, 2021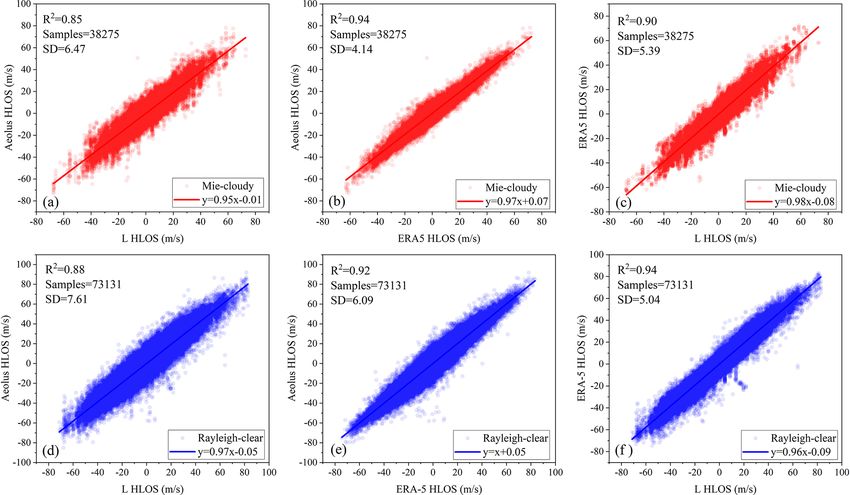
11492                      S. Chen et al.: Study of the seasonal variation in Aeolus wind product performance over China

Figure 2. Geographical location of the L-band RS site and Aeolus measurement trajectory. In the enlarged view (http://aeolus-ds.eo.esa.int/
socat/L1B_L2_Products, last access: 27 July 2021), the red rectangles represent the range of ±2.5◦ around the L-band RS stations, and the
gray-green lines represent Aeolus’s overlapping trajectories for the 12 months.

Figure 3. Main processing procedures of Aeolus, L-band RS, and ERA5 wind data.

Atmos. Chem. Phys., 21, 11489–11504, 2021                                                https://doi.org/10.5194/acp-21-11489-2021
S. Chen et al.: Study of the seasonal variation in Aeolus wind product performance over China                                        11493

Table 1. Main characteristics of the datasets used in the comparison.

      Data            Aeolus                                  ERA5                                   L-band RS
      Time            Jul–Dec 2019 and May–Oct 2020           Jul–Dec 2019 and May–Oct 2020          Jul–Dec 2019 and May–Oct 2020
                      Approximately 10:00                     Every hour                             Approximately 00:00
                      and 22:00 UTC                                                                  and 12:00 UTC
      Geographical    ±2.5◦ (latitude and longitude) near     ±2.5◦ (latitude and longitude) near    Chifeng (42.3◦ N, 118.8◦ E)
      location        the target RS station                   the target RS station                  Baoshan (31.4◦ N, 121.4◦ E)
                                                                                                     Shapingba (29.6◦ N, 106.4◦ E)
                                                                                                     Qingyuan (23.7◦ N, 113.1◦ E)
      Vertical        0.25 to 2 km                            37 pressure levels for 1000 to 1 hPa   < 10 m
      resolution
      Max altitude    Approximately 20 km for valid data      Approximately 45 km                    Approximately 32 km

known data points. The L-band RS (ERA5) data point, which                (Frehlich, 2001), the relative error can better reflect the de-
is just a little higher than one Aeolus data point in altitude,          tection performance of the instrument compared to the error
was found and marked as V (H + ). Then, V (H − ) was found,              value. The general calculation of the relative error is shown
which was just a little lower than the Aeolus data point. The            in Eq. (7):
L-band RS (ERA5) wind matched with the Aeolus data point
                                                                                 V − Vture
was calculated using Eq. (2):                                            Dr =              ,                                           (7)
                                                                                   Vture
           HAeolus − H −
VH = V H − +              · V H + − V H − , (2)                          where, Vture represents the data with a smaller error in the two

             H+ −H−                                                      datasets. In the present study, it was assumed that the error in
where VH is the L-band RS (ERA5) wind matched with the                   ERA5 data was the smallest, while the error in Aeolus data
Aeolus data at altitude and HAeolus is the altitude of the Aeo-          was the largest.
lus data point.                                                             Similarly, for a dataset with a sample size of n, the statis-
                                                                         tical average relative error was
2.5   Calculation of the relative error                                             n
                                                                                 1X
                                                                         Dr =          |Dr (i)| .                                      (8)
Generally, the calculation formula of the wind speed error for                   n i=1
the wind measurement system is
                                                                         In the data comparison logic of the present study, both
D = Va − Vb ,                                                   (3)      D r (Aeolus&L) − D r (L&ERA5) and D r (Aeolus&ERA5)
                                                                         were used to approximate the relative error value of the Ae-
where Va and Vb represent the wind speeds of different                   olus data when the space–time matching was good. The Ae-
datasets. This equation was used to calculate the difference             olus relative error parameter was set as follows:
between the different wind field data. Then, for a dataset with
a sample size of n, its statistical mean deviation (MD) and              DAeolus =
standard deviation (SD) were

                                                                          D r (Aeolus&L) − D r (L&ERA5) + D r (Aeolus&ERA5)
                                                                                                                            .          (9)
        n                                                                                          2
     1X
MD =       D(i),                                                (4)      The average value of the comparisons between Aeolus and
     n i=1
     v                                                                   the two datasets was used to reduce the possibility of large
     u
     u 1 X    n                                                          deviations in the relative error. DAeolus was used to approxi-
SD = t           (D(i) − MD)2 .                                 (5)      mate the relative error value of the Aeolus data in the present
       n − 1 i=1
                                                                         study.

In addition, the scaled median absolute deviation (scaled
MAD) is widely used in other Aeolus validation studies:                  3     Results and discussion

scaled MAD = 1.4826 × median(|D − median(D)|).                  (6)      3.1    Data quality

However, because the detection error in the Doppler wind                 The comparison results of the three data sources after data
lidar increases with an increase in the detected wind speed              matching are shown in Fig. 4. The red and blue points in

https://doi.org/10.5194/acp-21-11489-2021                                                Atmos. Chem. Phys., 21, 11489–11504, 2021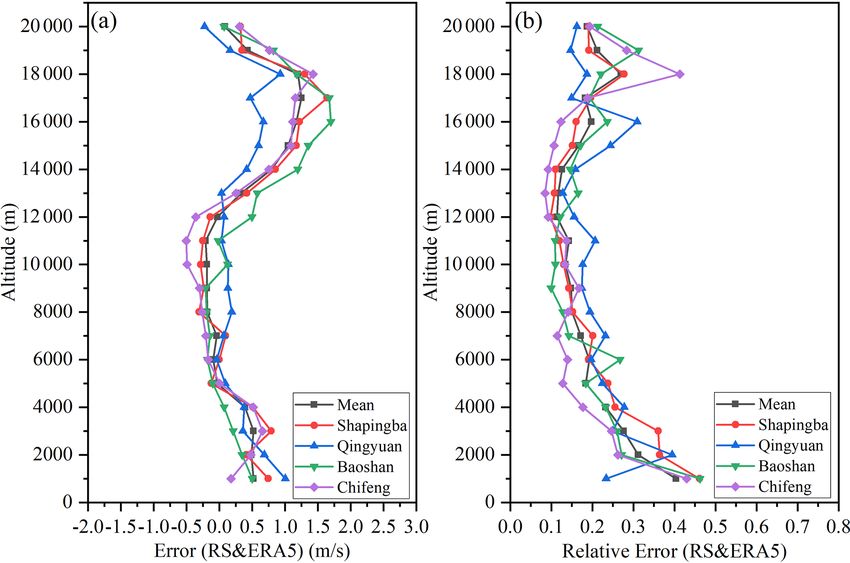
11494                      S. Chen et al.: Study of the seasonal variation in Aeolus wind product performance over China

Figure 4. Comparison results of Aeolus, L-band RS, and ERA5 data in Mie-cloudy and Rayleigh-clear groups. (a, d) Aeolus vs. L-band RS,
(b, e) Aeolus vs. ERA5, and (c, f) ERA5 vs. L band RS.

Table 2. Comparison between Aeolus, L HLOS, and ERA5 HLOS wind.

                                     Aeolus vs. L                     Aeolus vs. ERA5                       ERA5 vs. L
                             Mie-cloudy     Rayleigh-clear      Mie-cloudy     Rayleigh-clear      Mie-cloudy    Rayleigh-clear
     R                              0.92              0.94             0.97             0.96              0.95             0.97
     N samples                    38 275            73 131           38 275           73 131            38 275           73 131
     Slope                          0.95              0.97             0.97             1.00              0.98             0.96
     Intercept (m s−1 )           −0.01             −0.05              0.07             0.05            −0.08            −0.09
     MD (m s−1 )                  −0.03             −0.03              0.05             0.05              0.21             0.24
     SD (m s−1 )                    6.47              7.61             4.14             6.09              5.39             5.04
     Scaled MAD (m s−1 )            5.76              6.98             3.62             5.39              2.04             1.94

the figures represent the data points of the Mie-cloudy and          that there is a great agreement between ERA5 wind and L-
Rayleigh-clear groups, respectively. The red and blue lines          band RS wind, despite their temporal and spatial matching
represent the linear fitting lines of the data points of the         problems. Overall, the correlation coefficients in the three
two groups, respectively. The Mie-cloudy and Rayleigh-clear          sets of comparison results were all higher than 0.92, reflect-
groups in the four regions provided 38 275 and 73 131 valid          ing the reliability of the data used in the present study. The
data points over 12 months (July–December 2019 and May–              comparison results of data 1◦ from RS site are also shown
October 2020).                                                       in Table 3. The correlation coefficient is increased and the
   Table 2 shows the comparison results for the three groups         scaled MAD is decreased, when applying a stricter colloca-
of data. The consistency of the L-band RS and Aeolus data            tion criterion of 100 km. A stricter collocation criterion led
was the lowest among the three groups for the Mie-cloudy             to better results.
and Rayleigh-clear groups. The performance of the R and                 Because the present study also involved wind field data
SD values of this group (Aeolus vs. L) was also slightly             in different regions, the influence of the geographical loca-
worse than that of the other two groups, which was expected.         tion and climatic factors on data quality needed to be demon-
In addition, the scaled MAD value of group ERA5 vs. L                strated. Figure 5 shows a comparison of the Aeolus and L-
was significantly lower than that of other groups. This means        band RS data in the four regions used in the present study.

Atmos. Chem. Phys., 21, 11489–11504, 2021                                             https://doi.org/10.5194/acp-21-11489-2021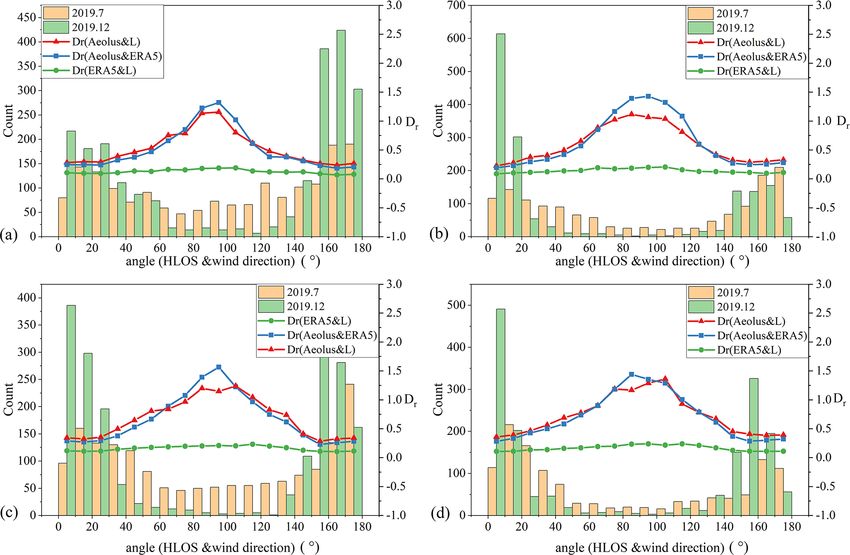
S. Chen et al.: Study of the seasonal variation in Aeolus wind product performance over China                                       11495

Figure 5. Comparison of Aeolus and L-band radar detection data in four regions. The blue data points are the Rayleigh-clear group data, and
the red data points are the Mie-cloudy group data. (a) Chifeng, (b) Baoshan, (c) Shapingba, and (d) Qingyuan.

Table 3. Same as Table 2 but for rectangle of ±1◦ lat and long. The distance of 1◦ lat and long is approximately 100 km in the regions we
studied.

                                       Aeolus vs. L                      Aeolus vs. ERA5                        ERA5 vs. L
                              Mie-cloudy     Rayleigh-clear        Mie-cloudy     Rayleigh-clear       Mie-cloudy     Rayleigh-clear
      R                               0.96              0.95              0.97              0.96              0.98              0.99
      N samples                      4482              8067              4482              8067              4482              8067
      Slope                           0.96              0.99              0.97              1.00              0.99              0.98
      Intercept (m s−1 )            −0.22             −0.02             −0.01               0.19            −0.22             −0.19
      MD (m s−1 )                   −0.24        2.5 × 10⁻³             −0.01               0.20            −0.23             −0.20
      SD (m s−1 )                     4.73              6.18              4.19              6.10              3.09              2.97
      Scaled MAD (m s−1 )             4.11              5.42              3.55              5.26              2.54              2.30

The blue data points represent the data of the Rayleigh-clear           tude decreased, the data quality declined; however, the data
group, and the red data points represent the data of the Mie-           quality of Baoshan is similar to that of Chifeng, which means
cloudy group. The colors of the linear fitting line and related         that this trend was not obvious.
parameters are consistent with the corresponding data points.              The data quality of the ERA5 and L-band RS wind data
Table 4 summarizes the results of this comparison. The con-             was further verified as the reference data. Previous studies
sistency of the Aeolus and L-band RS data in the Qingyuan               have shown that ERA5 and RS wind data are relatively reli-
area was worse than that of the other three groups, which               able in various wind field models and detection methods (In-
might be because Qingyuan is close to the tropics, where                gleby, 2017; Piasecki et al., 2019; Ramon et al., 2019; Molina
the atmospheric convection is active. In addition, from the             et al., 2021). The ERA5 data (matching the RS data) used in
perspective of the correlation coefficient R, the correlation           the present study were compared and verified with the RS
of the Rayleigh-clear group between the Aeolus and the L-               data in the vertical direction, and the results are shown in
band RS data was higher; however, the SD value was also                 Fig. 6. Except for the vertical height range of 14–19 km, the
relatively higher than that of the Mie-cloudy group, which              average error between the RS and ERA5 wind field data was
means that the data points were more scattered. As the lati-            between −0.5 and 0.5 m s−1 . However, Fig. 6b shows that

https://doi.org/10.5194/acp-21-11489-2021                                              Atmos. Chem. Phys., 21, 11489–11504, 2021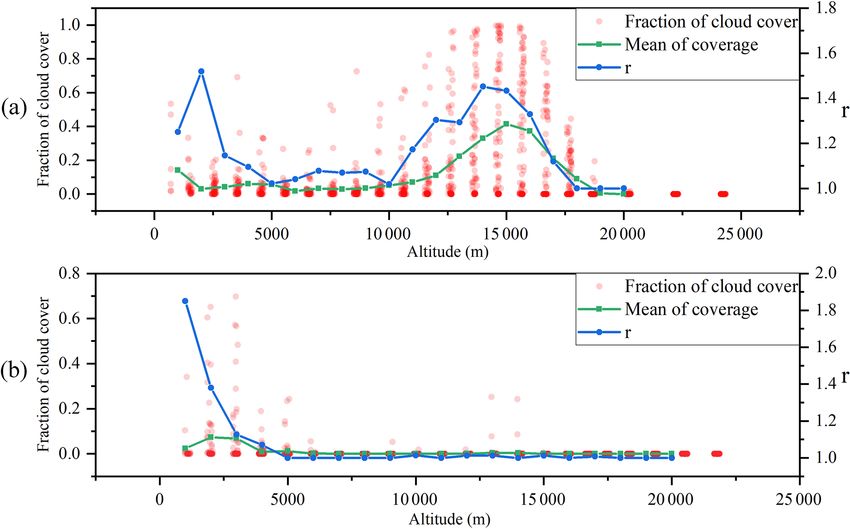
11496                         S. Chen et al.: Study of the seasonal variation in Aeolus wind product performance over China

Figure 6. Vertical comparison of ERA5 and RS wind data for four regions. (a) Error and (b) relative error.

Table 4. Comparison results of Aeolus and L-band RS in different regions.

                               Chifeng                       Baoshan                       Shapingba                       Qingyuan
                      Mie-cloudy   Rayleigh-clear   Mie-cloudy   Rayleigh-clear    Mie-cloudy   Rayleigh-clear     Mie-cloudy    Rayleigh-clear
 R                          0.94            0.94          0.94            0.95           0.90            0.93            0.82             0.89
 N samples                 7315           19 663         8380           15 162         13 595          22 006           8985            16 300
 Slope                      0.99            0.97          0.95            0.96           0.93            0.97            0.85             0.98
 Intercept (m s−1 )         0.19          −0.06           0.03          −0.02          −0.32             0.19            0.16           −0.36
 MD (m s−1 )                0.20            0.19        −0.19           −0.21          −0.30             0.20            0.28           −0.37
 SD (m s−1 )                7.19            7.74          6.74            7.64           6.18            7.64            5.83             7.38

the increase in the error between 14 and 19 km was caused                  Table 5. Percentiles of the relative error between Aeolus detection
by the increase in the wind speed value, and the relative error            and L-band RS data for four regions. P90 represents the boundary
between the RS and the ERA5 wind data was within 0.3. The                  value of the range where 90 % of the relative error falls. The mean
good consistency of the two datasets in the vertical direction             of P95 and P99 are similar to P90 .
indirectly verified the quality of the ERA5 and RS wind field
data in the present study.                                                                               P90     P95       P99
                                                                                          Chifeng        1.80    3.91   499.24
3.2   Seasonal variations in relative errors                                              Baoshan        2.45    5.24    41.75
                                                                                          Shapingba      2.96    5.92    26.55
                                                                                          Qingyuan       3.33    6.29    30.42
After the data quality was confirmed, the three wind field
datasets were introduced into Eqs. (3)–(9) to calculate the
errors. The representative statistical distribution of errors is
shown in Fig. 7a, which conforms to the Gaussian distribu-                 subsequent calculations and must be filtered. The threshold
tion law.                                                                  screening method was selected for filtering, and the relative
   However, the value of the relative error is affected by the             error that was greater than 3 (i.e., 300 %) was considered an
denominator in Eq. (7). When the value of the denominator                  invalid value. The statistical results of the relative error at the
is close to zero, the relative error has a larger outlier. The             four RS stations are summarized in Table 5. When we choose
occurrence of such an outlier was sporadic and random, as                  3 (300 %) as the relative error threshold, the most meaningful
shown in Fig. 7b. Although most of the relative errors were                data points in the four regions were within the threshold.
distributed in the interval [0, 3], sporadic outliers still ex-               Further, we used Eq. (8) to calculate the monthly average
isted in the range greater than 3. These outliers affect the               relative error for each month in each region. Then, Eq. (9)

Atmos. Chem. Phys., 21, 11489–11504, 2021                                                   https://doi.org/10.5194/acp-21-11489-2021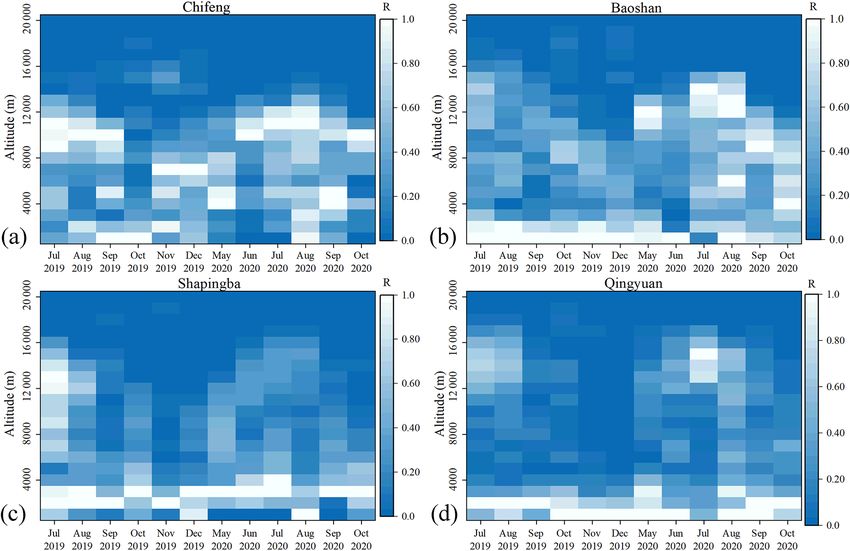
S. Chen et al.: Study of the seasonal variation in Aeolus wind product performance over China                                         11497

Figure 7. Statistical distribution of the error (a) and relative error (b) between Aeolus detection and L-band RS data. The data were from the
Rayleigh-clear group for 12 months in Chifeng.

Figure 8. Monthly mean values of the three groups of relative errors in different regions and months, (a) Chifeng, (b) Baoshan, (c) Shapingba,
and (d) Qingyuan.

was used to calculate the monthly average of the Aeolus                  in the Aeolus wind product performance. The same seasonal
relative error parameters. Finally, we obtained the changes              trend in the Rayleigh-clear data in the four regions (Fig. 9a)
in the three sets of relative errors (Aeolus & L, L & ERA5,              also confirmed this, as the mean relative error parameter in
and Aeolus & ERA5) from July 2019 to October 2020 (data                  July was over 174 % higher than that in December. The mean
missing from January to April 2020), as shown in Fig. 8.                 random error was also calculated and had a 0.97 m s−1 in-
For the Rayleigh-clear data, the relative error in the Aeo-              crease in July compared to December. We also found that
lus data was significantly larger in summer. Although the                as the latitude decreased, the month in which the relative
D r (L & ERA5), which represents the error caused by im-                 error peak appeared was delayed. Over the 2 years (2019–
perfect space–time matching, also increased in summer, the               2020), the peaks of the relative errors for Chifeng were in
increase in D r (Aeolus & L) and D r (Aeolus & ERA5) in the              July, whereas for Baoshan and Shapingba they were in Au-
summer months was much larger than that of D r (L & ERA5).               gust and Qingyuan was delayed to September. The relative
This increase in the relative error was caused by the variation          errors in the summer of 2020 were higher to varying de-

https://doi.org/10.5194/acp-21-11489-2021                                                Atmos. Chem. Phys., 21, 11489–11504, 2021
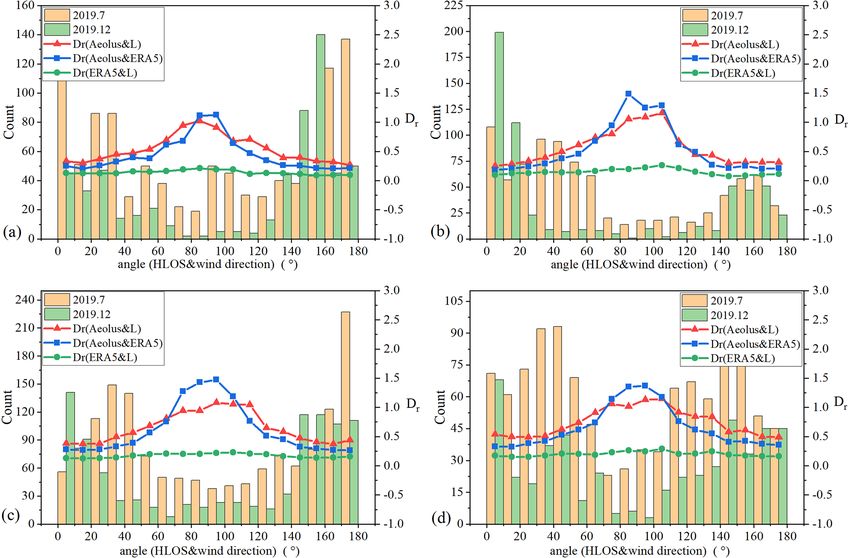
11498                      S. Chen et al.: Study of the seasonal variation in Aeolus wind product performance over China

Figure 9. Changes in the monthly average of DAeolus in different months, (a) Rayleigh-clear and (b) Mie-cloudy.

grees than those in 2019, which was mainly caused by the               cause of the seasonal variation in the Aeolus wind product
decrease in the output laser energy of Aeolus. This effect is          performance, we analyzed the statistical distribution of the
less pronounced for Mie-cloudy winds because they are not              angle between the real horizontal wind and the Aeolus HLOS
as strongly dependent on the laser energy.                             direction.
   We also calculated the monthly average value of DAeolus                Based on the previous data-matching work, we calculated
in the Mie-cloudy group, as shown in Fig. 9b. The monthly              the angle α between the real horizontal wind direction (pro-
mean value of DAeolus in the Mie-cloudy group did not show             vided by the ERA5 data) and the Aeolus HLOS direction
a significant seasonal trend, similarly to the Rayleigh-clear          (provided by the L2B data) of each Aeolus valid data point.
group. The mean relative error parameter in July was only              Figure 10 was obtained from the Rayleigh-clear group data.
39 % higher than that in December. Its seasonal fluctuations           When the angle α was between 70 and 110◦ , the relative er-
were relatively random for the different regions; however, the         ror in the Aeolus data increased significantly. The proportion
summer relative error was slightly larger overall.                     of data points with angles between 70 and 110◦ in July was
   The ECMWF proposed that varying temperature gradients               8.14 % higher than that in December. Most of the data points
across the instrument’s mirror M1 caused seasonal fluctua-             in December were concentrated in the vicinity of 0 and 180◦ .
tions in the quality of the Aeolus detection data (Rennie and          Theoretically, this would significantly increase the average
Isaksen, 2020). After applying corrections for the mirror ef-          relative error in Aeolus in July, which might be one of the
fects, the seasonal variation caused by the thermal structure          reasons for the increase in the relative error in Aeolus during
of the system itself theoretically became very small. Seasonal         the summer. For the Mie-cloudy group (Fig. 11), the propor-
variations in relative errors may be partly due to seasonal            tion of data points with angles between 70 and 110◦ in July
variations in atmospheric conditions.                                  was 5.86 % higher than that in December; therefore, there
   Considering the difference in the detection range be-               was the same order of magnitude for the angle difference dis-
tween the Rayleigh-clear and Mie-cloudy groups (Mie-                   tribution of the Rayleigh-clear and Mie-cloudy data. How-
cloudy mainly detects the aerosol layer), this seasonal dif-           ever, the seasonal variation in the relative error in the Mie-
ference might be caused by seasonal changes in the real at-            cloudy group was much smaller than that in the Rayleigh-
mospheric environment. Therefore, we proposed and verified             clear group; therefore, this conjecture cannot explain the sea-
two conjectures based on the Aeolus working principle.                 sonal performance of the Mie-cloudy group.

3.2.1   Seasonal variations in atmospheric wind direction              3.2.2   Seasonal variations in upper cloud cover

Because Aeolus detects only a single line-of-sight wind vec-           During the actual work process, the spaceborne wind lidar is
tor, the detection wind vector is a component of the real wind         susceptible to the influence of cloud aerosols. When the laser
vector. When the angle between the detection and real wind             passes through the cloud aerosol layer, it is subjected to a
vectors approaches 90◦ , the real wind vector contributes al-          strong attenuation effect, resulting in a decrease in the energy
most nothing to the detection wind vector and the detection            of the laser beam and signal-to-noise ratio (SNR). Simultane-
error is the largest. The closer the angle between the two is          ously, for the Rayleigh channel, the cloud aerosol layer will
to 0 or 180◦ , the smaller the detection error.                        cause strong Mie scattering, which will pollute the signal of
   The wind direction of the atmospheric wind field exhib-             the Rayleigh channel and increase its detection error (Rennie
ited an obvious seasonal trend. In China, the northwest mon-           et al., 2020).
soon prevails in the winter and the southeast in the summer               Because the Rayleigh channel has comprehensive cover-
(Chang, 2004; Huang et al., 2004; He et al., 2007). To ver-            age in altitude, we took the effective data of the Rayleigh
ify whether the seasonal variation in wind direction was the           channel (both Rayleigh-clear and Rayleigh-cloudy) and

Atmos. Chem. Phys., 21, 11489–11504, 2021                                               https://doi.org/10.5194/acp-21-11489-2021
S. Chen et al.: Study of the seasonal variation in Aeolus wind product performance over China                                         11499

Figure 10. Statistical distribution at different angles (HLOS and wind direction) about the data points and mean relative errors from the
Rayleigh-clear group data. The relative error Dr in the figure was calculated from the 12-month data of the region; (a) Chifeng, (b) Baoshan,
(c) Shapingba, and (d) Qingyuan.

Figure 11. Statistical distribution at different angles (HLOS and wind direction) about the data points and mean relative errors from the
Mie-cloudy group data. The relative error Dr in the figure was calculated from the 12-month data of the region; (a) Chifeng, (b) Baoshan,
(c) Shapingba, and (d) Qingyuan.

https://doi.org/10.5194/acp-21-11489-2021                                               Atmos. Chem. Phys., 21, 11489–11504, 2021
11500 S. Chen et al.: Study of the seasonal variation in Aeolus wind product performance over China
Figure 12. Vertical distribution of R values in different regions and months. (a) Chifeng, (b) Baoshan, (c) Shapingba, and (d) Qingyuan.
counted the number of samples (Nclear , Ncloudy ) based on the seasonal variation rule of cloud top height in East Asia (Zhao
month and altitude and then defined the parameter r that rep- et al., 2020).
resented the backscatter ratio: When the satellite-borne wind lidar worked, the high-
Nclear + Ncloudy altitude cloud layer attenuated the laser beam and reduced
r= . (10) the energy of the laser beam passing through the cloud layer.
Nclear
Thus, the SNR of the echo signal in the area below the high
r was normalized to obtain the parameter R. The larger the cloud decreased, and the detection error increased. Simulta-
value of the parameter R, the stronger the scattering of Mie neously, the Rayleigh signal from the cloudy area was inter-
in the altitude layer. We calculated the R value of 12 months fered with by the Mie scattering signal, which affected the
in different regions with a height resolution of 1000 m to ob- calculation of its Doppler shift. Although the Aeolus data
tain Fig. 12. Obvious high-altitude Mie scattering layers ex- processing algorithm uses a strict backscatter ratio thresh-
isted for the four areas during summer, whereas during au- old to remove the Rayleigh channel data elements that may
tumn and winter, this Mie scattering layer moved to areas contain Mie scattering from the Rayleigh-clear group (Ren-
with lower altitudes, with the Mie scattering intensity weak- nie et al., 2020), the signal interference still affects the final
ened. In Qingyuan, the high-altitude Mie scattering layer in inversion result.
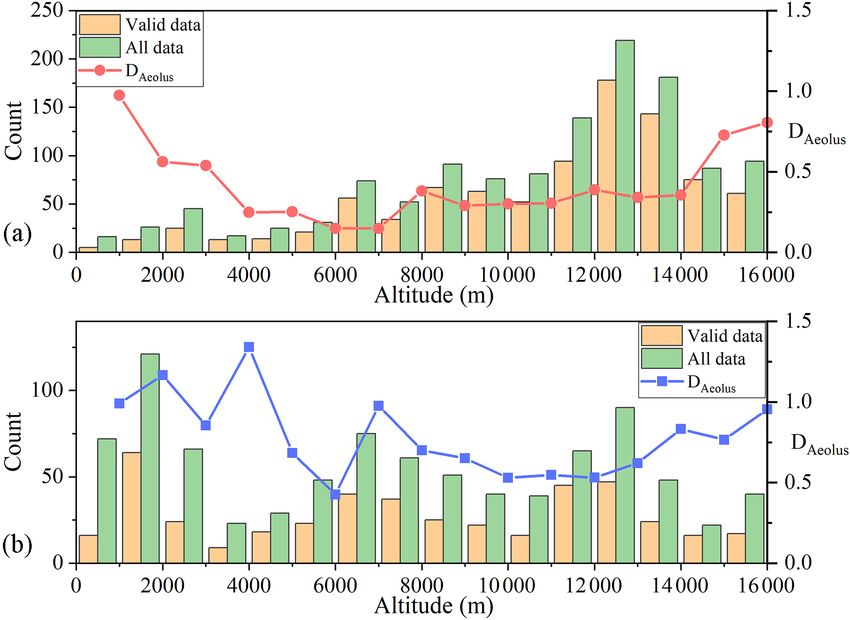
November and December 2019 was very weak (Fig. 12d). Finally, we attempted to use this conjecture to explain why
The ERA5 cloud coverage information matching with the the relative error seasonal variation in the Mie-cloudy group
Aeolus data points is shown in Fig. 13. The r value in Fig. 13 was not obvious (Fig. 9b). There are two special data points
represents the backscattering ratio, defined by Eq. (10). The in Fig. 9b: July and August 2020 in Baoshan. These were
mean cloud coverage and r values had a similar trend in the both during the summer; however, the average relative error
vertical direction; however, they were different in the near- in August was significantly higher than that in July. The ver-
ground area because the main reason for the Mie scatter- tical distribution of the valid data points and all data points of
ing here was aerosols rather than clouds. Taken together, the the Mie-cloudy group in the 2 months are shown in Fig. 14.
high-altitude Mie scattering layer in Fig. 12 in summer was The data points in July were mainly distributed in the high-
caused by the presence of clouds in the area. altitude cloud area, which might be due to the dense clouds
Therefore, the height of the cloud tops in summer in- in the upper air in July making it difficult for the Mie chan-
creased significantly within the Aeolus detection height nel to detect the area below the clouds. The Mie scattering
range. Combining the results (Figs. 12 and 13), the cloud top signal of the high-altitude cloud layer close to the satellite,
height in July was approximately 3–5 km higher than that in i.e., small optical thickness and high SNR, improved the
December for the four regions, which was consistent with the
Atmos. Chem. Phys., 21, 11489–11504, 2021 https://doi.org/10.5194/acp-21-11489-2021S. Chen et al.: Study of the seasonal variation in Aeolus wind product performance over China 11501 Figure 13. ERA5 cloud coverage of the valid Rayleigh channel data in the vertical direction. Data in (a) are from Qingyuan in July 2019, and data in (b) are from Qingyuan in December 2019. The green line is the mean value of cloud coverage at different distance gates. Figure 14. Distribution of Mie-cloudy data points and DAeolus in altitude. (a) July 2020 and (b) August 2020. Data are from Baoshan. Aeolus data quality. In addition, the Mie channel discrim- Mie-scattered echo signal generated by the laser beam prop- inator was not sensitive to the Rayleigh scattering signal; agated through the upper atmosphere and attenuated again. therefore, it was unnecessary to consider the Rayleigh sig- Therefore, it became very weak when it reached the Aeolus nal interference (Rennie et al., 2020). In August, the data receiving telescope, which was not conducive to subsequent points were evenly distributed in the vertical direction, and signal processing and reduced the quality of the Mie-cloudy the number of low-altitude data accounted for a consider- data. DAeolus was significantly higher in August than in July able proportion. Before the laser beam reached a low altitude, when the altitude was lower than 8 km, which supports the it was attenuated by high-altitude clouds. The low-altitude above explanation (Fig. 14). Therefore, in summer, a consid- https://doi.org/10.5194/acp-21-11489-2021 Atmos. Chem. Phys., 21, 11489–11504, 2021
11502                     S. Chen et al.: Study of the seasonal variation in Aeolus wind product performance over China

erable part of the data in the Mie-cloudy group came from a        of the echo signal received by Aeolus and interfered with the
high altitude; however, the low-altitude and the high-altitude     signal analysis and processing of the Rayleigh channel. This
Mie scattering signals contributed to the overall relative error   conjecture is also reasonable and can explain the seasonal
in the opposite way, which might be why the seasonal varia-        variation in the relative error in the Mie-cloudy channel of
tion in the Aeolus relative error in the Mie-cloudy group was      Aeolus.
not obvious.                                                          In the present study, the analysis of the Aeolus data quality
                                                                   and its seasonal changes in four regions (Chifeng, Baoshan,
                                                                   Shapingba, and Qingyuan) of China will help in the bet-
4   Conclusion                                                     ter understanding and use of the Aeolus detection data over
                                                                   China. Besides, this study is helpful for figuring out the in-
In the present study, the seasonal variation in the Aeolus         fluence of clouds and wind direction on the detection per-
wind product performance in China was analyzed using Ae-           formance of Aeolus, which will provide a reference for the
olus detection data, L-band RS detection data, and ERA5            follow-up development of spaceborne wind lidar.
data from July to December 2019 and May to October 2020.
First, the difference between the Aeolus and L-band RS data
was discussed, and the selection threshold of the Aeolus           Data availability. The Aeolus L2B data used in this study
data estimation error was clarified, which was 8 m s−1 for         can be downloaded from https://aeolus-ds.eo.esa.int/oads/access/
the Rayleigh-clear data and 4 m s−1 for the Mie-cloudy data.       collection (last access: 27 July 2021) (ESA, 2021). The L-band
After the valid data were filtered, a comparative analysis of      RS data can be provided for non-commercial research purposes
                                                                   upon request (Yinchao Zhang – ychang@bit.edu.cn). The ERA5
the three wind field datasets was undertaken. The R value of
                                                                   data can be downloaded from https://cds.climate.copernicus.eu/
Aeolus’s Rayleigh-clear (Mie-cloudy) data and ERA5 data
                                                                   cdsapp#!/dataset/10.24381/cds.bd0915c6?tab=overview (last ac-
was 0.96 (0.97), and the R value of the L-band RS data             cess: 27 July 2021) (Hersbach et al., 2018).
was 0.92 (0.94). Therefore, the Aeolus detection data were
in good agreement with the ERA5 and L-band RS data, and
the quality of the data used in the present study was reliable.    Author contributions. SC and RC conceived the idea for verifying
   These three datasets were then used to calculate the            the seasonal variation in Aeolus wind product performance over
monthly mean value of the relative error. The calculation re-      China. RC and YX conducted the data analyses and co-wrote the
sults showed that the relative error in the summer Rayleigh-       manuscript. YZ, WT, HC, PG, and PZ discussed the experimental
clear data in the four regions increased significantly, and the    results. All coauthors helped in reviewing the manuscript.
average relative error in July was 174 % higher than that in
December. In the Mie-cloudy group, this seasonal trend was
not obvious and the performance was more random. Combin-           Competing interests. The authors declare that they have no conflict
ing the working principle of Aeolus, we proposed two con-          of interest.
jectures to explain the seasonal variation in the relative error
in the Aeolus data. One was the variation in the angle be-
tween the actual horizontal wind direction and Aeolus HLOS         Disclaimer. Publisher’s note: Copernicus Publications remains
                                                                   neutral with regard to jurisdictional claims in published maps and
direction, which might have affected the extent of the Aeolus
                                                                   institutional affiliations.
single-vector data to reflect the true wind vector. The other
was the seasonal variation in the altitude of the high-altitude
clouds and cloud tops, which might have affected the SNR of        Special issue statement. This article is part of the special issue “Ae-
the echo signals in different channels.                            olus data and their application (AMT/ACP/WCD inter-journal SI)”.
   For the first conjecture, we calculated the distribution of     It is not associated with a conference.
the angle between the actual horizontal wind direction and
the Aeolus HLOS direction of different regions in July and
December. There were more data points distributed in the           Acknowledgements. We are very grateful to the China Meteorolog-
high error interval of 70–110◦ in July than in December;           ical Administration for the L-band RS data in China, the ESA for
therefore, this conjecture was reasonable. However, the first      the Aeolus data, and the ECMWF for ERA5.
conjecture encountered problems in explaining the situation
of the Mie-cloudy data. For the second conjecture, we set
the parameter R to represent the backscattering ratio and cal-     Review statement. This paper was edited by Geraint Vaughan and
culated the distribution of R at different altitudes in differ-    reviewed by two anonymous referees.
ent months. There was a strong high-altitude Mie scattering
layer in summer. Combined with the cloud coverage informa-
tion, the Mie scattering layer was caused by the high-altitude
clouds in summer. The high-altitude clouds reduced the SNR

Atmos. Chem. Phys., 21, 11489–11504, 2021                                            https://doi.org/10.5194/acp-21-11489-2021
S. Chen et al.: Study of the seasonal variation in Aeolus wind product performance over China 11503
References Ishii, S., Okamoto, K., Baron, P., Ishibashi, T., Tanaka, T.,
Sekiyama, T., Maki, T., Kubota, T., Satoh, Y., Sakaizawa,
Baars, H., Herzog, A., Heese, B., Ohneiser, K., Hanbuch, K., D., Yamashita, K., Gamo, K., Ochiai, S., Yasui, M., Oki,
Hofer, J., Yin, Z., Engelmann, R., and Wandinger, U.: Valida- R., Satoh, M., and Iwasaki, T.: Study on measurement per-
tion of Aeolus wind products above the Atlantic Ocean, At- formance of future space-based Doppler wind lidar in Japan,
mos. Meas. Tech., 13, 6007–6024, https://doi.org/10.5194/amt- in: 2017 IEEE International Geoscience and Remote Sens-
13-6007-2020, 2020. ing Symposium (IGARSS), July 2017, Japan, 4238–4245,
Belova, E., Kirkwood, S., Voelger, P., Chatterjee, S., Satheesan, https://doi.org/10.1109/IGARSS.2017.8127938, 2017.
K., Hagelin, S., Lindskog, M., and Körnich, H.: Validation Liu, B., Guo, J., Gong, W., Zhang, Y., Shi, L., Ma, Y., Li, J., Guo,
of Aeolus winds using ground-based radars in Antarctica and X., Stoffelen, A., de Leeuw, G., and Xu, X.: Intercomparison of
in northern Sweden, Atmos. Meas. Tech. Discuss. [preprint], wind observations from ESA’s satellite mission Aeolus, ERA5
https://doi.org/10.5194/amt-2021-54, in review, 2021. reanalysis and radiosonde over China, Atmos. Chem. Phys. Dis-
Chang, C.-P.: East Asian Monsoon, World Scientific, Singapore, cuss. [preprint], https://doi.org/10.5194/acp-2021-41, in review,
2004. 2021.
ESA – European Space Agency: ESA Aeolus Online Dissem- Lux, O., Lemmerz, C., Weiler, F., Marksteiner, U., Witschas, B.,
ination System, available at: https://aeolus-ds.eo.esa.int/oads/ Rahm, S., Geiß, A., and Reitebuch, O.: Intercomparison of
access/collection, last access: 27 July 2021. wind observations from the European Space Agency’s Aeolus
European Space Agency, Andersson, E., and Clissold, P. (Eds.): satellite mission and the ALADIN Airborne Demonstrator, At-
ADM-Aeolus: science report, ESA Communication Production mos. Meas. Tech., 13, 2075–2097, https://doi.org/10.5194/amt-
Office, Noordwijk, the Netherlands, 121 pp., 2008. 13-2075-2020, 2020.
Frehlich, R.: Estimation of velocity error for Doppler lidar measure- Martin, A., Weissmann, M., Reitebuch, O., Rennie, M., Geiß,
ments, J. Atmos. Ocean. Tech., 18, 1628–1639, 2001. A., and Cress, A.: Validation of Aeolus winds using ra-
Guo, J., Miao, Y., Zhang, Y., Liu, H., Li, Z., Zhang, W., He, J., Lou, diosonde observations and numerical weather prediction
M., Yan, Y., Bian, L., and Zhai, P.: The climatology of plan- model equivalents, Atmos. Meas. Tech., 14, 2167–2183,
etary boundary layer height in China derived from radiosonde https://doi.org/10.5194/amt-14-2167-2021, 2021.
and reanalysis data, Atmos. Chem. Phys., 16, 13309–13319, Molina, M. O., Gutiérrez, C., and Sánchez, E.: Comparison of
https://doi.org/10.5194/acp-16-13309-2016, 2016. ERA5 surface wind speed climatologies over Europe with ob-
Guo, J., Liu, B., Gong, W., Shi, L., Zhang, Y., Ma, Y., Zhang, J., servations from the HadISD dataset, Int. J. Climatol., 1–15,
Chen, T., Bai, K., Stoffelen, A., de Leeuw, G., and Xu, X.: Tech- joc.7103, https://doi.org/10.1002/joc.7103, 2021.
nical note: First comparison of wind observations from ESA’s Piasecki, A., Jurasz, J., and Kies, A.: Measurements and reanalysis
satellite mission Aeolus and ground-based radar wind profiler data on wind speed and solar irradiation from energy generation
network of China, Atmospheric Chem. Phys., 21, 2945–2958, perspectives at several locations in Poland, SN Appl. Sci., 1, 865,
https://doi.org/10.5194/acp-21-2945-2021, 2021. https://doi.org/10.1007/s42452-019-0897-2, 2019.
Hauchecorne, A., Khaykin, S., Wing, R., Mariscal, J.-F., Ramon, J., Lledó, L., Torralba, V., Soret, A., and Doblas-
Porteneuve, J., Cammas, J.-P., Marquestaut, N., Payen, G., and Reyes, F. J.: What global reanalysis best represents near-
Duflot, V.: Validation of ESA Aeolus wind observations using surface winds?, Q. J. Roy. Meteorol. Soc., 145, 3236–3251,
French ground-based Rayleigh Doppler lidars at midlatitude and https://doi.org/10.1002/qj.3616, 2019.
tropical sites, EGU General Assembly Conference Abstracts, 22, Reitebuch, O.: The Spaceborne Wind Lidar Mission ADM-Aeolus,
19786, https://doi.org/10.5194/egusphere-egu2020-19786, 2020. in: Atmospheric Physics: Background – Methods – Trends,
He, J., Ju, J., Wen, Z., Lü, J., and Jin, Q.: A review of recent ad- edited by: Schumann, U., Springer, Berlin, Heidelberg, 815–827,
vances in research on Asian monsoon in China, Adv. Atmos. Sci., https://doi.org/10.1007/978-3-642-30183-4_49, 2012.
24, 972–992, 2007. Reitebuch, O., Lemmerz, C., Lux, O., Marksteiner, U., Rahm, S.,
Hersbach, H., Bell, B., Berrisford, P., Biavati, G., Horányi, A., Weiler, F., Witschas, B., Meringer, M., Schmidt, K., Huber, D.,
Muñoz Sabater, J., Nicolas, J., Peubey, C., Radu, R., Rozum, Nikolaus, I., Geiss, A., Vaughan, M., Dabas, A., Flament, T.,
I., Schepers, D., Simmons, A., Soci, C., Dee, D., and Thé- Stieglitz, H., Isaksen, L., Rennie, M., de Kloe, J., Marseille, G.-
paut, J.-N.: ERA5 hourly data on pressure levels from 1979 to J., Stoffelen, A., Wernham, D., Kanitz, T., Straume, A.-G., Fehr,
present, Copernicus Climate Change Service (C3S) Climate Data T., von Bismarck, J., Floberghagen, R., and Parrinello, T.: Initial
Store (CDS) [data], available at: https://cds.climate.copernicus. Assessment of the Performance of the First Wind Lidar in Space
eu/cdsapp#!/dataset/10.24381/cds.bd0915c6?tab=overview (last on Aeolus, in: EPJ Web of Conferences, ILRC29, Heifei, China,
access: 27 July 2021), 2018. 1–4, 2019.
Hersbach, H., Bell, B., Berrisford, P., Hirahara, S., Horányi, A., Rennie, M. and Isaksen, L.: Aeolus L2B status, monitoring and
Muñoz-Sabater, J., Nicolas, J., Peubey, C., Radu, R., and Schep- NWP impact assessment at ECWMF, in: Aeolus NWP Impact
ers, D.: The ERA5 global reanalysis, Q. J. Roy. Meteorol. Soc., Assessment Workshop, Darmstadt, Germany, 2019.
146, 1999–2049, 2020. Rennie, M. and Isaksen, L.: The NWP impact of Aeolus Level-
Huang, R., Huang, G., and Wei, Z.: Climate variations of the sum- 2B winds at ECMWF, ECMWF Technical Memo 864, ECMWF,
mer monsoon over China, in: East Asian Monsoon, World Scien- Shinfield Park, Reading, UK, 2020.
tific, Singapore, 213–268, 2004. Rennie, M., Tan, D., Andersson, E., Poli, P., and Dabas,
Ingleby, B.: An assessment of different radiosonde A.: Aeolus Level-2B Algorithm Theoretical Basis Document
types 2015/2016, European Centre for Medium Range Weather (Mathematical Description of the Aeolus Level-2B Proces-
Forecasts, ECMWF Technical Memorandum, ECMWF, 2017.
https://doi.org/10.5194/acp-21-11489-2021 Atmos. Chem. Phys., 21, 11489–11504, 202111504 S. Chen et al.: Study of the seasonal variation in Aeolus wind product performance over China sor), AE-TN-ECMWF-L2BP.0023, V.3.21, ECMWF, avail- Witschas, B., Lemmerz, C., Geiß, A., Lux, O., Marksteiner, able at: https://earth.esa.int/eogateway/documents/20142/37627/ U., Rahm, S., Reitebuch, O., and Weiler, F.: First valida- Aeolus-L2B-Algorithm-ATBD.pdf (last access: 27 July 2021), tion of Aeolus wind observations by airborne Doppler wind 2020. lidar measurements, Atmos. Meas. Tech., 13, 2381–2396, Shin, H., Ahn, M.-H., Kim, J., and Chung, C.-Y.: Aeolus/ALADIN https://doi.org/10.5194/amt-13-2381-2020, 2020. data analysis in Korea, EGU General Assembly Conference Ab- Zhang, C., Sun, X., Lu, W., Shi, Y., Dou, N., and Li, S.: Rela- stracts, 22, 19595, https://doi.org/10.5194/egusphere-egu2020- tionship between wind observation accuracy and the ascending 19595, 2020. node of the sun-synchronous orbit for the Aeolus-type space- Stoffelen, A., Pailleux, J., Källén, E., Vaughan, J. M., Isak- borne Doppler wind lidar, Atmos. Meas. Tech., 14, 4787–4803, sen, L., Flamant, P., Wergen, W., Andersson, E., Schy- https://doi.org/10.5194/amt-14-4787-2021, 2021. berg, H., Culoma, A., Meynart, R., Endemann, M., and In- Zhao, M., Zhang, H., Wang, H.-B., Zhou, X.-X., Zhu, L., An, gmann, P.: The Atmospheric Dynamics Mission For Global Q., and Chen, Q.: The change of cloud top height over East Wind Field Measurement, B. Am. Meteorol. Soc., 86, 73–88, Asia during 2000–2018, Adv. Clim. Change Res., 11, 110–117, https://doi.org/10.1175/BAMS-86-1-73, 2005. https://doi.org/10.1016/j.accre.2020.05.004, 2020. Atmos. Chem. Phys., 21, 11489–11504, 2021 https://doi.org/10.5194/acp-21-11489-2021
You can also read