Geospatial epidemiology of Staphylococcus aureus in a tropical setting: an enabling digital surveillance platform - Nature
←
→
Page content transcription
If your browser does not render page correctly, please read the page content below
www.nature.com/scientificreports

            OPEN            Geospatial epidemiology
                            of Staphylococcus aureus
                            in a tropical setting: an enabling
                            digital surveillance platform
                            T. M. Wozniak1,10*, W. Cuningham1,10, S. Buchanan1, S. Coulter2, R. W. Baird3, G. R. Nimmo4,
                            C. C. Blyth5,6,7, S. Y. C. Tong1,8, B. J. Currie1,9 & A. P. Ralph1,9

                            Delivery of information to clinicians on evolving antimicrobial susceptibility needs to be accurate
                            for the local needs, up-to-date and readily available at point of care. In northern Australia, bacterial
                            infection rates are high but resistance to first- and second-line antibiotics is poorly described and
                            currently-available datasets exclude primary healthcare data. We aimed to develop an online
                            geospatial and interactive platform for aggregating, analysing and disseminating data on regional
                            bacterial pathogen susceptibility. We report the epidemiology of Staphylococcus aureus as an
                            example of the power of digital platforms to tackle the growing spread of antimicrobial resistance
                            in a high-burden, geographically-sparse region and beyond. We developed an online geospatial
                            platform called HOTspots that visualises antimicrobial susceptibility patterns and temporal trends.
                            Data on clinically-important bacteria and their antibiotic susceptibility profiles were sought from
                            retrospectively identified clinical specimens submitted to three participating pathology providers
                            (96 unique tertiary and primary healthcare centres, n = 1,006,238 tests) between January 2008 and
                            December 2017. Here we present data on S. aureus only. Data were available on specimen type, date
                            and location of collection. Regions from the Australian Bureau of Statistics were used to provide
                            spatial localisation. The online platform provides an engaging visual representation of spatial
                            heterogeneity, demonstrating striking geographical variation in S. aureus susceptibility across
                            northern Australia. Methicillin resistance rates vary from 46% in the west to 26% in the east. Plots
                            generated by the platform show temporal trends in proportions of S. aureus resistant to methicillin
                            and other antimicrobials across the three jurisdictions of northern Australia. A quarter of all, and
                            up to 35% of methicillin-resistant S. aureus (MRSA) blood isolates in parts of the northern Australia
                            were resistant to inducible-clindamycin. Clindamycin resistance rates in MRSA are worryingly high in
                            regions of northern Australia and are a local impediment to empirical use of this agent for community
                            MRSA. Visualising routinely collected laboratory data with digital platforms, allows clinicians, public
                            health physicians and guideline developers to monitor and respond to antimicrobial resistance in a
                            timely manner. Deployment of this platform into clinical practice supports national and global efforts
                            to innovate traditional disease surveillance systems with the use of digital technology and to provide
                            practical solutions to reducing the threat of antimicrobial resistance.

                            1
                             Menzies School of Health Research, Global & Tropical Health, Charles Darwin University, Darwin,
                            Northern Territory, Australia. 2Queensland Health, Communicable Diseases Branch, Brisbane,
                            Queensland, Australia. 3Territory Pathology, Northern Territory Government, Darwin, Northern Territory,
                            Australia. 4Pathology Queensland Central Laboratory, Griffith University School of Medicine, Brisbane, Queensland,
                            Australia. 5Wesfarmers Centre of Vaccines and Infectious Diseases, Telethon Kids Institute, University of Western
                            Australia, Perth, Western Australia, Australia. 6Department of Infectious Diseases, Perth Children’s Hospital, Perth,
                            Western Australia, Australia. 7PathWest Laboratory Medicine, Perth, Western Australia, Australia. 8Victorian
                            Infectious Disease Service, The Royal Melbourne Hospital and Doherty Department University of Melbourne, at
                            the Peter Doherty Institute for Infection and Immunity, Melbourne, Victoria, Australia. 9Department of Infectious
                            Diseases, Royal Darwin Hospital, Darwin, Northern Territory, Australia. 10These authors contributed equally:
                            T. M. Wozniak and W. Cuningham. *email: Teresa.wozniak@menzies.edu.au

Scientific Reports |   (2020) 10:13169                | https://doi.org/10.1038/s41598-020-69312-4                                             1

                                                                                                                                          Vol.:(0123456789)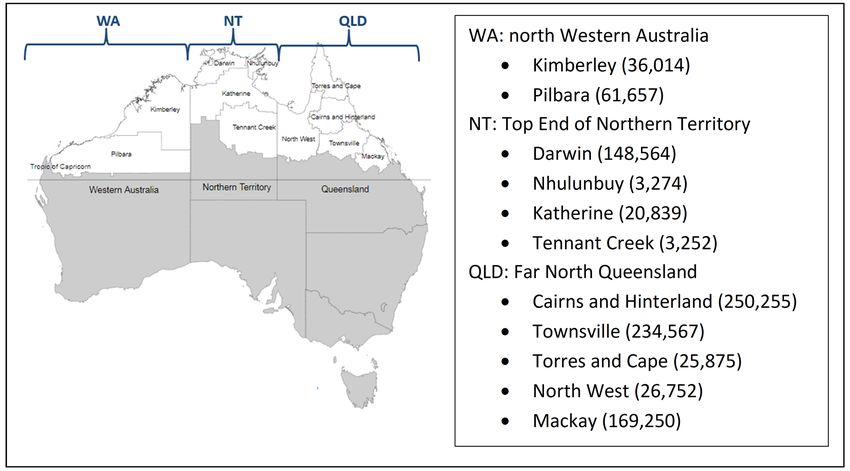
www.nature.com/scientificreports/
Figure 1. Selected geographical regions and population density in 2017. Map generated by HOTspots platform
https://amrhotspots.com.au/.
Antimicrobial resistance (AMR) imposes a substantial burden including poorer clinical outcomes and higher
healthcare costs for patients infected with resistant compared to susceptible o rganisms1–3. Quantifying the
magnitude of AMR over time and space is essential to better target public health priorities. Despite the high
ssoverall health status of many Australians, rural and regional areas within this country continue to experience
comparatively poor health o utcomes4. Northern Australia comprises half the Australian landmass but includes
only 5% (1.3 million) of the total Australian population. This region has a tropical climate and is home to 30% of
Australia’s Aboriginal and Torres Strait Islander people4. It spans three separate jurisdictions, each with its own
health program and multiple electronic health record systems, limiting cross-jurisdictional information flow.
Despite the sparse population it has some of the highest burden of infectious diseases including methicillin-
resistant Staphylococcus aureus (MRSA)5–7.
Current efforts to track and respond to AMR systematically in northern Australia and other regional settings
are insufficient8–10. In addition, many regional and remote hospitals also do not have the specialist services that
support antimicrobial stewardship11. Combined, this leaves a significant gap in health services’ ability to initi-
ate appropriate, timely responses to changing AMR epidemiology. To achieve enhanced AMR surveillance in
Northern Australia, cross-jurisdictional collaboration with data sharing is required and the use of innovative
geospatial information systems, can support these efforts.
We developed an online AMR surveillance platform that integrates existing but fragmented susceptibility
data, for visualization and analysis across time and space. Northern Australia was selected due to the paucity
of existing data from this r egion12 especially from primary care settings, the unique endemic pathogens, and
concerns about high rates of antibiotic resistance in S. aureus in this region. We describe, using geospatial epi-
demiology of S. aureus as an example, a digital platform used as a disease surveillance tool. The intent of the
HOTspots surveillance platform is to be a dynamic and collaborative platform used by healthcare practitioners,
policy makers and therapeutic guideline developers.
Methods
Setting. The four major laboratories serving primary and tertiary institutions in northern tropical Australia,
defined as areas north of latitude 23 degrees, were invited to participate. Northern Australia includes three sepa-
rate jurisdictions: Western Australia, Northern Territory and Queensland. The Australian Bureau of Statistics
(ABS) boundaries were categorised as Statistical Area Level 3, with populations of 30,000 to 130,000 people13.
Participating regions comprised two northern regions of north Western Australia (hereafter referred to as WA),
four regions of the Top End of Northern Territory (hereafter referred to as NT) and five regions of far north
Queensland (hereafter referred to as QLD) (Fig. 1).
HOTspots surveillance platform. The HOTspots platform (https://amrhotspots.com.au/) is based on
geo-coordinates providing spatial localization of resistance information. It is a custom-built platform with
Hypertext Preprocessor (PHP), Hypertext Markup Language (HTML), and JavaScript with D3.js visualisation
library for the frontend and MySQL (a programming language) for the backend. It is delivered on a Linux Server
Scientific Reports | (2020) 10:13169 | https://doi.org/10.1038/s41598-020-69312-4 2
Vol:.(1234567890)www.nature.com/scientificreports/
Organism Antibiotic class Antibiotic
Amoxicillin and enzyme inhibitor
Cefazolin
Beta-lactam
Ceftazidime
Ceftriaxone
Escherichia coli and Klebsiella pneumoniae Quinolone Ciprofloxacin
Carbapenem Meropenem
Gentamicin
Aminoglycoside Amikacin
Tobramycin
Beta-lactam Ceftazidime
Quinolone Ciprofloxacin
Pseudomonas aeruginosa Gentamicin
Aminoglycoside Amikacin
Tobramycin
Carbapenem Meropenem
Beta-lactam Methicillin
Macrolide Erythromycin
S. aureus
Lincosamide Clindamycin
Folate inhibitor Sulfamethoxazole-trimethoprim (SXT)
Table 1. List of organisms and antibiotics included in the HOTspots tool.
and is accessible on any world wide web search engine. Microbiological data provided from the participating
laboratories include: year of test, location of sample collection, sample type (blood, urine or swab), organism
isolated and susceptibility to a list of pre-specified antibiotics (Table 1). These data are entered as a line listing of
individual de-duplicated isolates.
A multifunctional search toolbar allows quick and direct searching of the year, organism and antibiotic of
interest for visualization. Data can be visualized on a map, or as a plot of percent resistance to a given antibiotic
over time. The map displays raw proportions for a given year whilst the line plot displays temporal trends using a
3-year moving average. The region of interest can be expanded or contracted. For years with few isolates collected
and tested (< 15 tests), these data within the region of interest are aggregated or excluded if all years have < 15
tests. Deployment of HOTspots into clinical practice in 2020 will permit 6-monthly data updates entered auto-
matically into the platform.
Microbiological data. Organisms and antibiotics were selected for inclusion in HOTspots through discus-
sion with the study team and local experts to represent those of greatest clinical relevance (Table 1). Participating
laboratories provided data on all clinical specimens where susceptibility testing was performed during the study
period. Since clinical information or additional specimen information (e.g. swab site; Gram stain and micros-
copy) was unavailable, the classification as community or nosocomial-onset and clinical significance of bacterial
isolates could not be determined. Information on sample type (i.e. blood, swab and urine) was available for all
organisms in NT and QLD and in WA for S. aureus isolates only. Results were restricted to the first bacterial
isolate per patient per year and missing or erroneous entries were excluded. All resistant and intermediate results
were combined as ‘Resistant’ for purposes of resistance phenotype analysis.
Participating laboratories are accredited under regularly audited national testing guidelines (National Associa-
tion of Testing Authorities); and are members of the National Quality Assurance and Quality Control program
run by the Royal College of Pathologists of Australasia External Quality Control Assurance program. These
programs have been in place for over 30 years and ensure a high concordance with reproducibility of microbiol-
ogy susceptibility results between different laboratories.
Two widely used international susceptibility method systems, Clinical and Laboratory Standards Institute
(CLSI) and European Committee on Antimicrobial Susceptibility Testing (EUCAST), were used by the participat-
ing laboratories. Susceptibility results were determined by VITEK 2 (bioMerieux, France). Data from WA were
provided with CLSI-interpreted values (Susceptible, Intermediate and Resistant). Data from QLD was provided
with CLSI-interpreted values (Susceptible, Intermediate and Resistant) for years 2008 to 2012, and EUCAST
interpreted values for years 2012 onwards. For isolates from NT, we applied the 2017 CLSI M100-S27 Perfor-
mance Standards for Antimicrobial Susceptibility Testing (27th Edition) to the provided minimum inhibitory
concentration values for each organism. In all laboratories, clindamycin resistance was inferred from erythro-
mycin resistance and a D-test only performed upon request (referred to as inducible-clindamycin). Methicil-
lin resistance in S. aureus was inferred from resistance to oxacillin in laboratories in the WA, cefoxitin in NT
laboratories and flucloxacillin and cefoxitin in QLD.
Analysis. We used Stata 15.1 for data management and descriptive statistics. Proportion resistant was calcu-
lated as the number of samples resistant to the antibiotic divided by number of susceptibility tests. The validity
of a subset of HOTspots susceptibility data was assessed by comparing MRSA reported in the Top End Health
Service (TEHS, Northern Territory) antibiogram as a reference14. The TEHS antibiogram included all isolates
Scientific Reports | (2020) 10:13169 | https://doi.org/10.1038/s41598-020-69312-4 3
Vol.:(0123456789)www.nature.com/scientificreports/
WA NT QLD
Years of analysis 2014–2017 2012–2017 2008–2017
Number of tests 94,919 173,909 737,410
Unique locations 6 4 86
Blood 9,868 31,998
Urine Not specified except for S. aureus 81,527 255,886
Swab 80,776 392,753
CLSI (2008–2012)
Laboratory standards CLSI CLSI EUCAST (2012–
current)
Table 2. Database characteristics for HOTspots surveillance tool. WA, north Western Australia; NT, top
end of Northern Territory; QLD, far north Queensland; CLSI, Clinical and Laboratory Standards Institute;
EUCAST, European Committee on Antimicrobial Susceptibility Testing.
tested during November 2016 to April 2017. An agreement statistic15 was calculated for MRSA where M denotes
percent agreement, R denotes the reference susceptibility and A denotes the HOTspot susceptibility.
M = 1− [(sum|R − A|) /sumR)].
Ethics. The study was conducted and approved by provided by the Human Research Ethics Committee of the
Northern Territory Department of Health and Menzies School of Health Research (HREC-2018-3084) as well as
the Queensland Health Public Health Act 2005 (Section 280). All data were analysed in strict compliance with
the requirements of the National Statement on Ethical Conduct in Human Research (2007) guidelines.
Results
The contributing pathology providers collectively have 96 specimen collection sites (hospitals and primary
healthcare centers) and provided 1 006 238 susceptibility tests. Resulting data were derived from primary and
tertiary care for the WA and QLD and tertiary care only for the NT. Characteristics of the databases which form
the basis of the HOTspots platform are described in Table 2.
HOTSpots platform development and validation. Surveillance data sent to the HOTspots surveil-
lance team were coordinated and cleaned. Deidentified data are sent in a format which is directly extracted from
the Laboratory Information System from each of the pathology providers. These data are managed through
a pipeline described in Fig. 2. To cross-check a subset of data, agreement between the proportion of MRSA
bloodstream isolates in NT was compared with the 2017 hospital antibiogram. This was calculated as 94·9%
(1 − [(34·6 − 32·85)/34·6)] and interpreted as showing strong agreement.
Epidemiology of S. aureus and methicillin‑resistance by geographic region. During the study
period, we obtained 137 723 S. aureus isolates for analysis, 90% of these were from swabs (n = 125 740) and the
remainder were blood (n = 3 462), urine (n = 2 696) and unspecified (n = 3 823) (Table 3). Methicillin resistance
was identified in 35% (n = 48 203) of S. aureus isolates overall and was highest in blood cultures (37%) compared
to other isolates (Table 3). There was variation between (Table 3) and within jurisdictions (Table 3, Fig. 3) in the
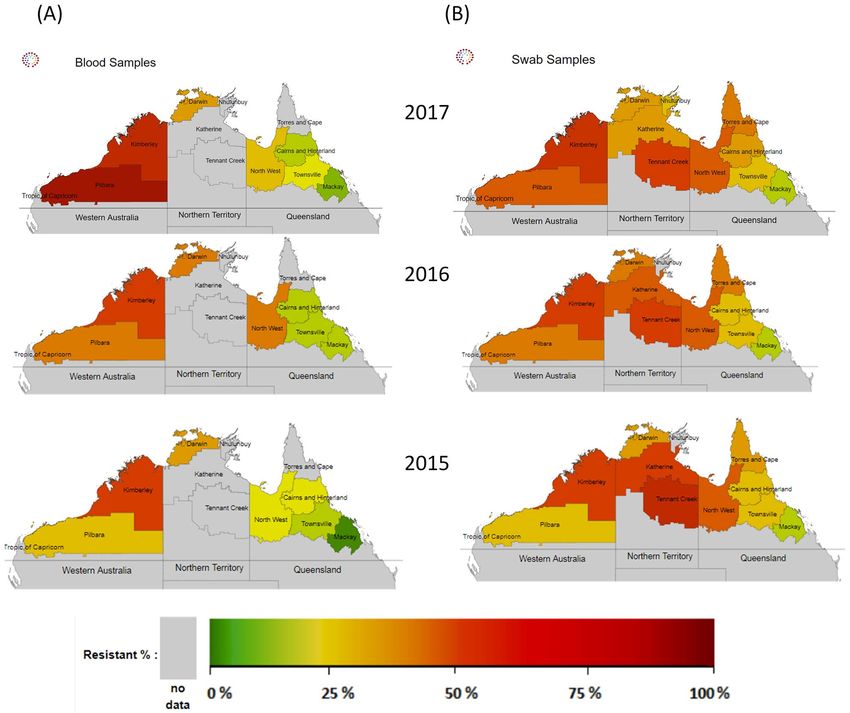
patterns of MRSA. Between jurisdictions, MRSA was highest in WA (46.8%), compared to NT (34%) and QLD
(26%) (Table 3). Within jurisdictions, WA data demonstrates an increase in MRSA in the Pilbara region blood
(25% in 2015 to 75% in 2017, Fig. 3A) and swab isolates (29% in 2015 to 41% in 2017, Table 3). With the avail-
able data we could not determine NT intra-jurisdictional patterns of resistance in blood cultures of S. aureus
(Fig. 3A). However, data from swab isolates suggests a decline in methicillin resistance in both Darwin (35% in
2015 to 24% in 2017) and Tennant Creek (55% in 2015 to 34% in 2017) regions of NT (Table 4, Fig. 3B). In QLD,
proportion of swab isolates resistant to methicillin has remained stable since 2015, except for ‘Torres and Cape’
and ‘Cairns and Hinterland’ regions, where MRSA has increased by 5% (Table 4).
Second‑line S. aureus antibiotic resistance. S. aureus resistance to inducible-clindamycin and sul-
famethoxazole-trimethoprim (SXT) was higher in WA and NT and lower in QLD (Fig. 4, Table 5). Resistance to
these second-line agents was more common in S. aureus isolates that were methicillin resistant than methicillin
sensitive (Table 5). Resistance to inducible-clindamycin among MRSA isolates was 10% in QLD compared to
26% in NT and 20% in WA. MRSA resistant to SXT was the same in QLD and NT (5% of all isolates) and almost
three times higher in WA (14%, n = 1 345 resistant isolates). There were 27 MRSA blood cultures tested for SXT
between 2014 and 2017 in WA, and none were found to be resistant to SXT.
Longitudinal trends in S. aureus antimicrobial resistance. The proportion of S. aureus resistant to
methicillin increased overall during the study period. However in blood, MRSA was stable or decreasing over
time for QLD and NT where the data are available (Figs. 3, 4). The increase in MRSA in QLD swab samples likely
Scientific Reports | (2020) 10:13169 | https://doi.org/10.1038/s41598-020-69312-4 4
Vol:.(1234567890)www.nature.com/scientificreports/
Figure 2. Data flow and processes of the HOTspots surveillance tool.
WA NT QLD
(2014–2017) (2012–2017) (2008–2017) All regions
S. aureus, N (% MRSA)
All sites 21,223(46%) 17,685 (34%) 98,815 (26%) 137,723 (35%)
Blood 144 (54%) 575 (36%) 2,743 (21%) 3,462 (37%)
Swab 21,079 (46%) 16,763 (34%) 87,898 (26%) 125,740 (35%)
Urine ·· 347 (33%) 2,349 (16%) 2,696 (18%)
Unspecified ·· ·· 3,823 (23%) 3,823 (23%)
Table 3. Staphylococcus aureus isolates with available susceptibility data and proportion resistant to
methicillin, 2008–2017. WA, north Western Australia; NT, top end of Northern Territory; QLD, far north
Queensland; N: number tested.
Scientific Reports | (2020) 10:13169 | https://doi.org/10.1038/s41598-020-69312-4 5
Vol.:(0123456789)www.nature.com/scientificreports/
Figure 3. HOTspots output for resistance among Staphylococcus aureus isolates to methicillin in blood cultures
(A) and swab samples (B), northern Australia, 2015–2017. Maps generated by HOTspots platform https://amrho
tspots.com.au/.
Number tested (% MRSA) 2015 2016 2017
Kimberley 3,871 (50%) 3,698 (52%) 3,826 (53%)
WA
Pilbara 1,373 (29%) 1,513 (39%) 1,412 (41%)
Darwin 2,276 (35%) 2,649 (37%) 1,899 (24%)
NT Katherine 179 (45%) 85 (42%) 16 (44%)
Tennant Creek 198 (55%) 230 (49%) 175 (34%)
Torres and Cape 2,206 (33%) 2,929 (37%) 2,947 (38%)
Cairns & Hinterland 2,554 (26%) 2,847 (28%) 2,906 (31%)
QLD Townsville 2,316 (27%) 2,412 (27%) 2,652 (27%)
North West 1,125 (44%) 1,331 (45%) 1,196 (44%)
Mackay 1,057 (17%) 1,072 (16%) 1,200 (16%)
Table 4. Susceptibility patterns of MRSA swab isolates in northern Australia by region,* 2015–2017. WA,
north Western Australia; NT, Top End of Northern Territory; QLD, far north Queensland. *Data were not
available for Nhulunbuy region in NT.
Scientific Reports | (2020) 10:13169 | https://doi.org/10.1038/s41598-020-69312-4 6
Vol:.(1234567890)www.nature.com/scientificreports/
A B C
proportion resistant (%)
50 50 50
45 45 45
40 40 40
35 35 35
30 30 30
All
25 25 25
20 20 20
15 15 15
10 10 10
5 5 5
0 0 0
09
17
09
08
10
11
12
13
14
12
13
14
15
16
08
10
14
15
17
11
09
10
16
08
11
12
13
15
16
17
20
20
20
20
20
20
20
20
20
20
20
20
20
20
20
20
20
20
20
20
20
20
20
20
20
20
20
20
20
20
50 50 50
proportion resistant (%)
proportion resistant (%)
45 45 45
40 40 40
35 35 35
30 30 30
Blood
Blood
25 25 25
20 20 20
15 15 15
10 10 10
5 5 5
0 0 0
09
08
10
11
14
15
08
13
08
09
10
12
13
09
16
17
10
16
17
12
14
15
16
14
15
11
11
12
13
17
20
20
20
20
20
20
20
20
20
20
20
20
20
20
20
20
20
20
20
20
20
20
20
20
20
20
20
20
20
20
50 50 50
proportion resistant (%)
proportion resistant (%)
45 45 45
40 40 40
35 35 35
30 30 30
Swab
Swab
25 25 25
20 20 20
15 15 15
10 10 10
5 5 5
0 0 0
08
09
10
11
14
09
13
12
15
13
15
16
17
14
17
08
09
10
11
12
14
15
16
17
08
10
11
12
16
13
20
20
20
20
20
20
20
20
20
20
20
20
20
20
20
20
20
20
20
20
20
20
20
20
20
20
20
20
20
20
Methicillin Clindamycin Sulfamethoxazole−trimethoprim
Figure 4. Proportion of S. aureus isolates resistant to given antibiotics in the WA (A), NT (B) and QLD (C).
Top panel: all samples; middle panel: blood cultures and lower panel: swab samples, 2008–2017.
Clindamycin, number tested (% resistant) SXT, number tested (% resistant)
All isolates Swab Blood All isolates Swab Blood
All isolates 20,871 (18%) 20,871 (18%) ·· 20,922 (7%) 20,873 (7%) 49 (0%)
WA MSSA 11,299 (19%) 11,299 (19%) ·· 11,311 (1%) 11,289(1%) 22 (0%)
MRSA 9,572 (20%) 9,572 (20%) ·· 9,611 (14%) 9,584 (14%) 27 (0%)
All isolates 17,680 (21%) 16,758 (21%) 575 (25%) 17,683 (7%) 16,761 (2%) 575 (9%)
NT MSSA 11,628 (19%) 11,032 (19%) 365 (19%) 11,629 (1%) 11,033 (2%) 365 (1%)
MRSA 6,052 (26%) 5,726 (25%) 210 (35%) 6052 (5%) 5,726 (16%) 210 (25%)
All isolates 96,967 (8%) 86,629 (8%) 2,743 (9%) 90,960 (2%) 80,820 (2%) 2,728 (3%)
QLD MSSA 71,798 (7%) 63,720 (7%) 2,160 (7%) 65,918 (1%) 58,007 (1%) 2,146 (1%)
MRSA 25,169 (10%) 22,909 (9%) 583 (19%) 25,042 (5%) 22,813 (4%) 582 (11%)
Table 5. Second-line antibiotic resistance rates according to methicillin susceptibility in Staphylococcus aureus
isolates, northern Australia, 2008–2017. WA, north Western Australia; NT, Top End of Northern Territory;
QLD, far north Queensland; SXT, sulfamethoxazole-trimethoprim; MSSA, methicillin-sensitive S. aureus;
MRSA, methicillin-resistant S. aureus.
originates from either the ‘Torres and Cape’ or ‘Cairns and Hinterland’ region (Fig. 3B, Table 4). The proportion
of all S. aureus resistant to other major antibiotics was stable or decreased (Fig. 4).
Discussion
We demonstrate the feasibility and utility of a digital geospatial surveillance platform for displaying antimicrobial
resistance data. This prototype forms the basis of a platform that will be able to host increasingly comprehensive
microbiological data. It offers a mechanism to support clinical and public health decision-making and guideline
Scientific Reports | (2020) 10:13169 | https://doi.org/10.1038/s41598-020-69312-4 7
Vol.:(0123456789)www.nature.com/scientificreports/
development. The urgent need to improve antimicrobial stewardship in the remote and disadvantaged regions
of central and northern Australia has been recently h ighlighted8.
A comprehensive epidemiology of S. aureus across tropical north of Australia has not previously been
reported. These findings show striking geographical variation in S. aureus susceptibility across northern Australia
with the proportion of MRSA ranging from 46% in WA to 26% in QLD and an overall 35% across this tropical
region. This is a two-fold higher proportion of MRSA than has been reported from southern parts of Australia
(range from 9.5 to 20.5%)16. To fulfil Australia’s first National AMR Strategy and implementation p lan17, a high-
quality evidence-base is needed to support geospatially-representative data collection, coordinated surveillance
activities and targeted policy decisions. Repeated calls for a new Australian national coordinating centre on
AMR have to date gone unheeded18.
Australia has already invested heavily in understanding the epidemiology of AMR, with some key national
initiatives12. From these combined efforts, it is evident that AMR is increasing across Australia, however avail-
able data tells us little about interjurisdictional variation and the complexity of AMR in community settings.
S. aureus provides an example of an organism with patterns of resistance that are geographically heterogenous,
yet publications have only focused on specific regions in individual studies5,6,19–21. These studies report rates of
community-associated MRSA incidence ranging from 16 per 100,000 population to 81 per 100,000 population,
depending on the study population and region. This does not reflect the heterogeneity that can occur between
urban and remote settings and the distribution of factors that likely determine transmission of infectious dis-
eases. The distinction is important because it helps determine the most appropriate level for clinical and policy
intervention. Spatial epidemiology can fill the gaps in traditional surveillance and equip healthcare profes-
sional with the data analytics to effectively make decisions and policy recommendations to improve patient and
population-level outcomes22.
The temporal trends in S. aureus epidemiology seen across northern Australia relate to changes in dominant
MRSA clones both within and between j urisdictions16. The most common community-associated MRSA clone
in Australia is now ST93-MRSA, which most likely arose from northern Australia in the late 1980s23 and spread
east. In 2017, this strain accounted for 33% community-associated MRSA ranging from 0% in Tasmania to 74% in
the Northern T erritory16. Community-associated MRSA clones have emerged serially from strains of methicillin-
sensitive S. aureus (MSSA)6,23 and over the years have diversified and increased in frequency across the g lobe23.
Our data highlight the problem of MRSA resistant to inducible-clindamycin and SXT, commonly relied on
as oral second-line options for community MRSA skin and soft tissue infections, or as first-line agents for peo-
ple with MSSA infection with intolerance to beta-lactams. SXT was introduced in 2014 as an alternative agent
to intramuscular penicillin for the treatment of streptococcal skin infections, highly endemic in this s etting24.
Concerns about a subsequent rise in SXT resistance in S. aureus have been expressed25, but we did not find this in
our analysis. The SXT resistance rates we report from WA and NT are comparable to those previously r eported26.
Clindamycin (and related macrolide) resistance rates in MRSA are alarmingly h igh27. Twenty six percent
of all MRSA isolates (35% in blood and 25% in swab isolates) in our NT analysis were resistant to inducible-
clindamycin. This finding is a local impediment to empirical use of this agent for both community MRSA and as
a synergistic antibiotic for severe skin and soft tissue infections in hospital patients. While inducible clindamycin
rates were high, clindamycin may still have a broader efficacy than suggested, especially where macrolide use
is limited and therefore macrolide-related induction of clindamycin resistance is potentially minimized. This
is indeed the case for some regions, but the widespread use of azithromycin for therapy of particular infections
(i.e. sexually transmissible infection) across the regions and for trachoma in selected locations28 cautions against
routinely using clindamycin when inducible clindamycin resistance is reported. These data will be used to inform
revisions of local treatment g uidelines28. Higher clindamycin resistance rates still, at up to 44% among commu-
nity MRSA isolates, have been reported in the southern half of the NT, a region of the jurisdiction that did not
participate in this study29. Reassuringly however, a marginal decrease in inducible-clindamycin resistance was
seen over time and a more evident decrease occurred across all jurisdictions during the study period. While this
study was not designed to explain this trend, we speculate that, in contrast to key drivers of methicillin resistance,
this may reflect decreasing prescribing rates of erythromycin in community clinics and guideline-restriction of
azithromycin use.
Antibiotic resistance does not always inexorably increase over time but rather, fluctuates according to factors
including changing prescribing habits and transmission dynamics30,31. We found that changes in the proportion
of MRSA were regionally concentrated and did not follow a gradient across the geographical area included in
the study. This focal nature particularly, in the west part of Northern Australia is suggestive of MRSA outbreaks
with community transmission in confined niches and is less likely to suggest regional differences in prescribing
practices driving AMR. This is supportive of the growing body of evidence that points to contagion (i.e., spread)
being the major but frequently under-appreciated factor driving the increased prevalence of A MR32. That the NT
has by far the highest rates of overcrowding per household in A ustralia33 may in part explain why the Northern
Territory, despite using fewer prescriptions for some c onditions12, continues to demonstrate high rates of AMR
as we report in this study. Unpacking the social factors contributing to transmission and spread of AMR is
important both for clinical management of patients and to mitigate risks of further spread.
Limitations of this study include that not all regional pathology providers participated, and clinical informa-
tion for each isolate was unavailable. However, the data presented are more comprehensive, and inclusive of
primary care data, than any previous reports for this region that are published. Sampling bias may have favoured
sample collection (especially swabs) from treatment failure cases, hence may have over-estimated the proportion
with AMR. Smaller number of blood isolates in NT and WA may also incorrectly inflate AMR proportions in
those regions. Indeed, local treatment guidelines for remote settings with limited laboratory access recommend
swab testing of skin infections only if initial empirical therapy f ails28. Data have only been entered up to 2017
and further updates will follow in late 2020. The existing information provides regionally-specific figures from
Scientific Reports | (2020) 10:13169 | https://doi.org/10.1038/s41598-020-69312-4 8
Vol:.(1234567890)www.nature.com/scientificreports/
which current rates can be approximated. Lastly, comparison of data from participating laboratories should be
approached with some caution due to the use of either CLSI or EUCAST methods over time. However, both
methods are internationally recognised, and any differences are well documented.
We provide evidence using S. aureus as an example of a model of AMR disease surveillance delivered using
a digital platform, that is both feasible and operative. Our study describes geospatial epidemiology of infection
with S. aureus in a region that is under-served, suffers from a high disease burden and is geographically iso-
lated. Successful implementation of this platform and deployment into clinical practice planned for in 2020 is
turning data-rich systems into information-rich ones and innovating the way health services receive and act on
changing patterns of resistance. The HOTspots platform is currently being evaluated, updated to include more
sophisticated high-quality reports and is planned to have ongoing 6-monthly data updates from late 2020. The
challenge will be to sustain efforts already initiated and to percolate to next levels of government, underpinning
the critical need for coordinated AMR surveillance and response in Australia. This approach is scalable and
transferrable to other settings and other disease surveillance programs. Given the significant health burden of
AMR and infectious disease which continues to increase in this region and neighbouring low and middle-income
countries, the benefits of early detection, timely and appropriate response hold great promise to expand this
platform into other settings.
Received: 8 January 2020; Accepted: 3 July 2020
References
1. Cassini, A. et al. Attributable deaths and disability-adjusted life-years caused by infections with antibiotic-resistant bacteria in the
EU and the European Economic Area in 2015: a population-level modelling analysis. Lancet. Infect. Dis 19, 56–66. https://doi.
org/10.1016/s1473-3099(18)30605-4 (2019).
2. Laxminarayan, R. et al. Antibiotic resistance-the need for global solutions. Lancet. Infect. Dis 13, 1057–1098. https://doi.
org/10.1016/s1473-3099(13)70318-9 (2013).
3. Wozniak, T. M., Bailey, E. J. & Graves, N. Health and economic burden of antimicrobial-resistant infections in Australian hospitals:
a population-based model. Infect. Control Hosp. Epidemiol. 40, 320–327. https://doi.org/10.1017/ice.2019.2 (2019).
4. Australian Institute of Health and Welfare. Rural and remote health, https://www.aihw.gov.au/reports/rural-health/rural-remot
e-health/contents/rural-health (2017).
5. Maguire, G. P., Arthur, A. D., Boustead, P. J., Dwyer, B. & Currie, B. J. Emerging epidemic of community-acquired methicillin-
resistant Staphylococcus aureus infection in the Northern Territory. Med. J. Aust. 164, 721–723 (1996).
6. Tong, S. Y. et al. Community-associated strains of methicillin-resistant Staphylococcus aureus and methicillin-susceptible S. aureus
in indigenous Northern Australia: epidemiology and outcomes. J. Infect. Dis. 199, 1461–1470. https://doi.org/10.1086/598218
(2009).
7. Macmorran, E. et al. The rise of methicillin resistant Staphylococcus aureus: now the dominant cause of skin and soft tissue infec-
tion in Central Australia. Epidemiol. Infect. 145, 2817–2826. https://doi.org/10.1017/s0950268817001716 (2017).
8. Bowen, A. C., Daveson, K., Anderson, L. & Tong, S. Y. An urgent need for antimicrobial stewardship in Indigenous rural and
remote primary health care. Med. J. Aust. https://doi.org/10.5694/mja2.50216 (2019).
9. Australian Commission on Safety and Quality in Health Care. Australian Passive Antimicrobial Resistance Surveillance (APAS),
https://www.safetyandquality.gov.au/antimicrobial-use-and-resistance-in-australia/apas/
10. Turnidge, J. D. & Meleady, K. T. Antimicrobial use and resistance in Australia (AURA) surveillance system: coordinating national
data on antimicrobial use and resistance for Australia. Aust. Health Rev. Public. Aust. Hospital Assoc. 42, 272–276. https://doi.
org/10.1071/ah16238 (2018).
11. Bishop, J. L., Schulz, T. R., Kong, D. C. M., James, R. & Buising, K. L. Similarities and differences in antimicrobial prescribing
between major city hospitals and regional and remote hospitals in Australia. Int. J. Antimicrob. Agents 53, 171–176. https://doi.
org/10.1016/j.ijantimicag.2018.10.009 (2019).
12. Australian Commission on Safety and Quality in Health Care. AURA 2019: third Australian report on antimicrobial use and resist-
ance in human health. Sydney: ACSQHC; 2019, https://consultations.health.gov.au/ohpd-health-protection-policy-branch/consu
ltation-on-next-amr-strategy/user_uploads/aura-2019-report.pdf (2019).
13. Australian Bureau of Statistics. Statistical Area Level 3, https://www.abs.gov.au/websitedbs/D3310114.nsf/home/Australian+Stati
stical+Geography+Standard+(ASGS) (2018).
14. Northern Territory Department of Health. Top End AntiMicrobial Stewardship. Antibiogram https://health.nt.gov.au/health-gover
nance/top-end-health-service (2019).
15. Wang, A. et al. A platform for monitoring regional antimicrobial resistance, using online data sources: resistanceopen. J. Infect.
Dis. 214, S393–S398. https://doi.org/10.1093/infdis/jiw343 (2016).
16. Coombs, G. W., Daley, D. A., Lee, Y. T. & Pang, S. Australian group on antimicrobial resistance (AGAR) Australian Staphylococ-
cus aureus sepsis outcome programme (ASSOP) annual report 2017. Commun. Dis. Intell. 43, 2019. https://doi.org/10.33321/
cdi.2019.43.43 (2018).
17. Australian Department of Health. National Antimicrobial Resistance Strategy 2015–2019, https: //www.health .gov.au/intern
et/main/
publishing.nsf/Content/1803C433C71415CACA257C8400121B1F/$File/amr-strategy-2015-2019.pdf (2015).
18. Davis, J. S., Jones, C. A., Cheng, A. C. & Howden, B. P. Australia’s response to the global threat of antimicrobial resistance: past,
present and future. Med. J. Aust. 211, 106-108.e101. https://doi.org/10.5694/mja2.50264 (2019).
19. Udo, E. E., Pearman, J. W. & Grubb, W. B. Genetic analysis of community isolates of methicillin-resistant Staphylococcus aureus
in Western Australia. J. Hospital Infect. 25, 97–108. https://doi.org/10.1016/0195-6701(93)90100-e (1993).
20. Riley, T. V. & Rouse, I. L. Methicillin-resistant Staphylococcus aureus in Western Australia, 1983–1992. J. Hospital Infect. 29,
177–188. https://doi.org/10.1016/0195-6701(95)90327-5 (1995).
21. Nimmo, G. R. et al. Epidemiology of non-multiresistant methicillin-resistant Staphylococcus aureus infection in Queensland,
Australia: associations with indigenous populations and Panton-Valentine leukocidin. Eur. J. Clin. Microbiol. Infect. Dis. 29,
1253–1259. https://doi.org/10.1007/s10096-010-0994-z (2010).
22. Beard, R., Wentz, E. & Scotch, M. A systematic review of spatial decision support systems in public health informatics supporting
the identification of high risk areas for zoonotic disease outbreaks. Int. J. Health Geographics 17, 38. https://doi.org/10.1186/s1294
2-018-0157-5 (2018).
23. van Hal, S. J. et al. Global scale dissemination of ST93: a divergent Staphylococcus aureus epidemic lineage that has recently emerged
from remote Northern Australia. Front Microbiol https://doi.org/10.3389/fmicb.2018.01453 (2018).
Scientific Reports | (2020) 10:13169 | https://doi.org/10.1038/s41598-020-69312-4 9
Vol.:(0123456789)www.nature.com/scientificreports/
24. Bowen, A. C. et al. Short-course oral co-trimoxazole versus intramuscular benzathine benzylpenicillin for impetigo in a highly
endemic region: an open-label, randomised, controlled, non-inferiority trial. Lancet (London, England) 384, 2132–2140. https://
doi.org/10.1016/s0140-6736(14)60841-2 (2014).
25. Bowen, A. C. et al. Sulfamethoxazole-trimethoprim (Cotrimoxazole) for skin and soft tissue infections including impetigo, cel-
lulitis, and abscess. Open Forum Infect. Dis. 4, 232. https://doi.org/10.1093/ofid/ofx232 (2017).
26. Tong, S. Y., Varrone, L., Chatfield, M. D., Beaman, M. & Giffard, P. M. Progressive increase in community-associated methicil-
lin-resistant Staphylococcus aureus in Indigenous populations in northern Australia from 1993 to 2012. Epidemiol. Infect. 143,
1519–1523. https://doi.org/10.1017/s0950268814002611 (2015).
27. Prabhu, K., Rao, S. & Rao, V. Inducible clindamycin resistance in Staphylococcus aureus isolated from clinical samples. J. Lab.
Physicians 3, 25–27. https://doi.org/10.4103/0974-2727.78558 (2011).
28. Central Australian Rural Practitioners’ Association (CARPA) Editorial Committee. CARPA Standard Treatment Manual, 7th ed,
https://www.crh.org.au/the-manuals/carpa-standard-treatment-manual-7th-edition (2017).
29. Stevens, C. L., Ralph, A., McLeod, J. E. & McDonald, M. I. Community-acquired methicillin-resistant Staphylococcus aureus in
Central Australia. Commun. Dis. Intell. Q. Rep. 30, 462–466 (2006).
30. Bell, B. G., Schellevis, F., Stobberingh, E., Goossens, H. & Pringle, M. A systematic review and meta-analysis of the effects of
antibiotic consumption on antibiotic resistance. BMC Infect. Dis. 14, 13. https://doi.org/10.1186/1471-2334-14-13 (2014).
31. MacPherson, D. W. et al. Population mobility, globalization, and antimicrobial drug resistance. Emerg. Infect. Dis. 15, 1727–1732.
https://doi.org/10.3201/eid1511.090419 (2009).
32. Collignon, P., Beggs, J. J., Walsh, T. R., Gandra, S. & Laxminarayan, R. Anthropological and socioeconomic factors contributing to
global antimicrobial resistance: a univariate and multivariable analysis. Lancet Planet. Health 2, e398–e405. https: //doi.org/10.1016/
s2542-5196(18)30186-4 (2018).
33. Bailie, R., Stevens, M., McDonald, E., Brewster, D. & Guthridge, S. Exploring cross-sectional associations between common child-
hood illness, housing and social conditions in remote Australian Aboriginal communities. BMC Public Health 10, 147. https://doi.
org/10.1186/1471-2458-10-147 (2010).
Acknowledgements
We greatly thank Ms Laura Goddard for her contribution to supporting the development and evaluation of the
HOTspots surveillance platform. We thank Ms Rosanne Barnes for supporting the data extraction and review-
ing the article. We thank Dr Anthony Ryan for critically reviewing this article. TMW and WC are supported by
the Australian National Health and Medical Research Council (NHMRC)-funded ‘Improving Health Outcomes
in the Tropical North: A multidisciplinary collaboration (HOT NORTH)’, GNT1131932. APR, SYCT and CCB
are supported by NHMRC fellowships (#1142011, #1145033 and #1111596). The corresponding author had full
access to all the data in the study and had final responsibility for the decision to submit for publication.
Author contributions
T.M.W. contributed to the concept, design, data collection, data interpretation, writing of the article and coor-
dination of building the online platform. W.C. contributed to the data collection, data management and inter-
pretation and revising the article. S.B. contributed to software development and revising the article. S.C., R.W.B.,
G.R.N., C.C.B. contributed to the data extraction, data interpretation and revising the article. S.Y.C.T., B.J.C.
contributed to data interpretation and revising the article. A.P.R. contributed to the data interpretation, and
writing of the article.
Competing interests
The authors declare no competing interests.
Additional information
Correspondence and requests for materials should be addressed to T.M.W.
Reprints and permissions information is available at www.nature.com/reprints.
Publisher’s note Springer Nature remains neutral with regard to jurisdictional claims in published maps and
institutional affiliations.
Open Access This article is licensed under a Creative Commons Attribution 4.0 International
License, which permits use, sharing, adaptation, distribution and reproduction in any medium or
format, as long as you give appropriate credit to the original author(s) and the source, provide a link to the
Creative Commons license, and indicate if changes were made. The images or other third party material in this
article are included in the article’s Creative Commons license, unless indicated otherwise in a credit line to the
material. If material is not included in the article’s Creative Commons license and your intended use is not
permitted by statutory regulation or exceeds the permitted use, you will need to obtain permission directly from
the copyright holder. To view a copy of this license, visit http://creativecommons.org/licenses/by/4.0/.
© The Author(s) 2020
Scientific Reports | (2020) 10:13169 | https://doi.org/10.1038/s41598-020-69312-4 10
Vol:.(1234567890)You can also read