Australia Pacific LNG Project - Volume 2: Gas Fields Chapter 4: Climate and Climate Change Adaptation
←
→
Page content transcription
If your browser does not render page correctly, please read the page content below
Australia Pacific LNG Project
Volume 2: Gas Fields
Chapter 4: Climate and Climate Change Adaptation
Volume 2: Gas Fields
Chapter 4: Climate and Climate Change Adaptation

Contents

4.            Climate and climate change adaptation.................................................................................... 1

     4.1      Introduction ............................................................................................................................... 1

     4.2      Climate ...................................................................................................................................... 1

              4.2.1       Climate over the gas fields’ area.................................................................................. 1

              4.2.2       Wind speed and direction............................................................................................. 1

              4.2.3       Temperature and solar radiation .................................................................................. 2

              4.2.4       Rainfall ......................................................................................................................... 2

              4.2.5       Relative humidity .......................................................................................................... 2

              4.2.6       Surface pressure .......................................................................................................... 3

              4.2.7       Climate extremes ......................................................................................................... 3

              4.2.8       Impacts of weather patterns and extremes of climate on project ................................ 5

     4.3      Climate change ......................................................................................................................... 6

              4.3.1       Methodology................................................................................................................. 6

              4.3.2       Climate projections....................................................................................................... 6

              4.3.3       Climate change adaptation ........................................................................................ 10

              4.3.4       Cooperative approach to climate change adaptation................................................. 12

     4.4      Conclusion .............................................................................................................................. 13

              4.4.1       Assessment outcomes ............................................................................................... 13

              4.4.2       Commitments ............................................................................................................. 18

References ............................................................................................................................................. 19

  Australia Pacific LNG Project EIS                                      Page ii                                                           March 2010
Volume 2: Gas Fields Chapter 4: Climate and Climate Change Adaptation Figures Figure 4.1 Tropical cyclones within 200km of Roma from 1906 to 2006 (BOM 2009d) ........................ 4 Figure 4.2 Cities for which climate change predictions are presented by CSIRO ................................. 8 Tables Table 4.1 Summary of Bureau of Meteorology monitoring sites and parameters.................................. 1 Table 4.2 Project gas fields and gas pipeline areas – annual average thunder days, total lightning flash density and cloud-to-ground flash density ...................................................................................... 5 Table 4.3 Mean temperature change (°C)* ............................................................................................ 7 Table 4.4 Mean rainfall change (%)* ...................................................................................................... 9 Table 4.5 Percentile change in fire risk from average 1974-2007 levels*............................................ 10 Table 4.6 Summary of environmental values, sustainability principles, potential impacts and mitigation measures ............................................................................................................................................... 15 Australia Pacific LNG Project EIS Page iii March 2010
Volume 2: Gas Fields
Chapter 4: Climate and Climate Change Adaptation

4.         Climate and climate change adaptation

4.1        Introduction
This chapter provides information on the existing climate of the south central Queensland region and
explores predictions of climate change in the region in which the Australia Pacific LNG Project (the
Project) gas fields will be located. It describes the potential impacts of climate change on the Project's
gas fields and associated works, based on current knowledge.

Greenhouse gas emissions, their impacts and mitigation strategies specific to the gas fields are
discussed in detail in Volume 2 Chapter 14.

Sections 4.2 and 4.3 of this chapter address the environmental impact statement (EIS) terms of
reference sections 3.1.1 Climate and 3.1.2 Climate change adaptation, respectively.

Throughout the Project life, including site preparation, construction, operation, decommissioning and
rehabilitation, the Project will be influenced by the climate. The Australia Pacific LNG's sustainability
principles will be applied to the development of strategies for the gas fields to ensure that climate-
induced impacts do not cause conditions which adversely impact the Project or the environment. Of
Australia Pacific LNG's 12 sustainability principles, as discussed in the sustainability chapter Volume 1
Chapter 3, the relevant sustainability principles for climate in the gas fields are as follows:

     • Minimising adverse environmental impacts and enhancing environmental benefits associated
       with Australia Pacific LNG's activities, products or services; conserving, protecting, and
       enhancing where the opportunity exists, the biodiversity values and water resources in its
       operational areas

     • Identifying, assessing, managing, monitoring and reviewing risks to Australia Pacific LNG's
       workforce, its property, the environment and the communities affected by its activities.

Under these principles, climate and climate change values are addressed through the identification
and assessment of climate change risks and the mitigation of impacts on project assets and activities
through climate change strategies.

4.2        Climate

4.2.1      Climate over the gas fields’ area
Information in this section is for climate in the south central Queensland region and is based on long
term monitoring information. Meteorological monitoring data from the Bureau of Meteorology (BOM)
stations located at Roma, Dalby and Miles have been used to characterise the climate in the Australia
Pacific LNG gas fields' development area (BOM 2009a).

The Roma, Dalby and Miles monitoring stations have been selected for their close proximity to the
proposed gas fields and processing facilities and the availability of data. These monitoring stations
have been selected to provide a summary of the regional climate, where data collection has been
carried out for between 12 to 114 years. The meteorological parameters measured at the Roma,
Dalby and Miles monitoring stations include long term temperature, solar radiation, atmospheric
pressure, rainfall, relative humidity and wind speed and direction. The parameters used from each site
are summarised in Table 4.1. Refer to Volume 5 Attachment 28 for more details.

 Australia Pacific LNG Project EIS                Page 1                                       March 2010
Volume 2: Gas Fields
Chapter 4: Climate and Climate Change Adaptation
Table 4.1 Summary of Bureau of Meteorology monitoring sites and parameters
Region Location Latitude/ Record Parameters
longitude period
Roma Airport 26.54 °S 1985 – 2009 Temperature, solar exposure, relative humidity,
rainfall, surface pressure, wind speed and wind
148.78 °E
direction
Miles Post Office 26.66 °S 1885 – 2009 Temperature, solar exposure, relative humidity
and rainfall
150.18 °E
Constance St 26.66 °S 1997 – 2009 Surface pressure, wind speed and wind direction
150.18 °E
Dalby Airport 27.16 °S 1992 – 2009 Temperature, solar exposure, relative humidity
and rainfall
151.26 °E
The more extreme weather events include big storms, floods, heat waves and bushfires which may
cause impacts such as sedimentation, erosion, stormwater management, containment of waste in
bunding and tailings dams, health and safety risks to personnel and interruption to transportation.
These impacts are discussed further in Volume 2 Chapter 11 – Surface water and watercourses,
Volume 2 Chapter 5 – Topography, geomorphology, geology, soils and land contamination, and
Volume 2 Chapter 17 – Traffic and transport.
The construction methods and management strategies for these issues are dealt with in Volume 2
Chapter 24. These include plans for sediment and erosion control, geology and soils, transport,
surface water and health and safety.
4.2.2 Wind speed and direction
The wind fields in the Project area of southern central Queensland reflect the geographic situation and
physical environment of the region. The environment consists of relatively flat terrain on the lee side of
the Great Dividing Range, dry to semi-arid conditions with a mixture of agricultural, pastoral, and forest
land uses, dispersed with small rural towns and industries, all located a significant distance from the
Queensland coast. Consequently, the winds across the region are largely driven by synoptic scale
influences such as pressure gradients, convergence and convection, and subsidence of cool air from
aloft, rather than orographic affects and ocean-land interactions such as land-sea breezes.
The distributions of wind speed and direction observed at Roma and Miles have been used to
characterise the wind fields in the Project area.
The analysis of the distribution of winds across the Project Area has identified two dominant features
of the regional wind fields:
a) A large proportion of the winds blow from the north-eastern sectors (between the north and
east). These winds tend to be moderate (approximately 30% of the time) or strong
(approximately 3% to13% of the time).
b) There is a significant amount of calms (less than 2m/s) in the region, particularly at Miles.
The seasonal distribution of winds at Roma and Miles indicates that the winds from the northeast
quadrant, and in particular from the north and north-northeast direction, dominate all year round. The
Australia Pacific LNG Project EIS Page 1 March 2010Volume 2: Gas Fields Chapter 4: Climate and Climate Change Adaptation seasonal distribution also shows that winds from the south to southwest also make up another significant proportion of the winds across the region, particularly during the autumn and winter months, and to a lesser extent during the spring. The diurnal distribution of winds also illustrates the dominance of the winds from the northeast quadrant, and in particular from the north and north-northeast direction, and show that the wind blows from this direction at all times of the day. However, the north and north-northeasterly winds are particularly prevalent during the night and early morning periods and slightly less frequent during the late evening. The diurnal profile also indicates that the winds during the afternoon, the warmest time of the day, are more evenly distributed from all directions, particularly at Roma, with a higher proportion of the higher winds from the southwest occurring at that time. 4.2.3 Temperature and solar radiation The average maximum daily temperature recorded at the sites during summer ranges from 31.8°C at Dalby to 33.4°C at Roma. The average minimum daily temperature recorded at the sites during winter ranges from 4.5°C at Miles to 4.8°C at Dalby. On average, daily temperatures tend to increase to the west across the gas fields' development area, with Roma typically recording higher temperatures throughout the year than Miles to the east, and Dalby further to the east. The analysis identifies a seasonal temperature profile typical of the sub-tropical Queensland climate, with cooler winter months of June, July and August and warmer summer months of December, January and February. The amount of solar radiation at the surface is a primary driver for the weather patterns and climatic cycles that influence the Darling Downs and central Queensland region. The analysis illustrates the seasonal pattern whereby summertime solar exposure is twice that of the wintertime. As evident in the higher temperatures at Roma, solar exposure at Roma is marginally higher than at Miles and Dalby. 4.2.4 Rainfall The annual pattern of rainfall illustrates the sub-tropical climate in the region, where 50% (Roma), 51% (Miles) and 57% (Dalby) of the annual precipitation occurs during the monsoonal months of November to February. The annual average rainfall across the region ranges between 558mm at Roma and 649mm at Miles, with the maximum monthly average rainfall occurring in December, January and February for Dalby (99 mm), Miles (95 mm) and Roma (83 mm), respectively. While rainfall predominantly occurs during the monsoonal summer period illustrating its sub-tropical climate, the relatively low amount of annual rainfall shows that the region is still quite dry due to its inland, semi- arid setting, when compared to the tropical north of Australia. On average, the total rainfall during the monsoonal months is slightly more than twice that of the drier months. In comparison in Darwin, approximately ten times as much rainfall occurs during the monsoonal months (November to March) than in the drier months (April to October). 4.2.5 Relative humidity The seasonal availability of moisture is another important factor in influencing the climate, by affecting the transfer of heat in the atmosphere through the balance between sensible and latent heat fluxes, and the occurrence of precipitation. Relative humidity is one of several measures used to describe the amount of moisture in the atmosphere, and is the ratio of the actual amount of moisture in the atmosphere to the maximum amount that could be held, at a given temperature. Australia Pacific LNG Project EIS Page 2 March 2010
Volume 2: Gas Fields
Chapter 4: Climate and Climate Change Adaptation

Relative humidity has been analysed from long-term averages based on daily measurements collected
at 9am and 3pm at Roma, Miles and Dalby.

The analysis indicates that the cooler late autumn and winter months (May to July) tend to be
relatively more humid than the warmer spring and summer months (September to January). While this
may appear to contradict the suggestion that the summer months are wetter than the winter months in
terms of precipitation, it is an artefact of the measure of relative humidity, where it is the ratio of the
actual water vapour content and the maximum capacity of the atmosphere to hold water, at a given
temperature.

Considering the significant number of drought affected years during the recent measurement period,
rainfall has not significantly varied between seasons, while the amount of solar heating of the surface,
and subsequent temperature, has continued in its typical summer-winter cycle. As the air temperature
increases so too does its ability to hold water. However, if the amount of available water remains
relatively constant, the relative humidity is reduced.

Consequently, the seasonal temperature variation influences the atmosphere's ability to hold water
and, therefore, the relative humidity. As discussed in the rainfall section above, only twice the amount
of rainfall occurs in the wet season in comparison to the dry season, while twice the amount of solar
radiation occurs in the summer to that in the winter.

In regard to average daily variations, the analysis indicates that relative humidity is 60% higher at 9am
than at 3pm across the region on average.

4.2.6     Surface pressure
Long and short-term fluctuations in atmospheric pressure are important when describing climatic
patterns across the region. Monitoring data from Roma and Miles have been used to characterise the
mean sea-level pressure in the region during the period 2002 to 2009.

The longer term cycles are evident in the seasonal fluctuations of mean sea-level pressure, which
fluctuates around an average pressure of 1,020hPa during the drier winter months (May to August),
and 1,010hPa during the wetter summer months (November to February). Within this seasonal cycle,
mean sea-level pressure fluctuates on a diurnal basis between 3 to 4hPa, with solar heating of the
ground during the midday-afternoon period reducing the atmospheric pressure above the ground. At
night when the temperature falls, atmospheric pressure increases again.

The seasonal fluctuations are generated by the passage of high pressure systems across the low to
mid latitudes during the winter months and tend to produce relatively dry, clear, stable synoptic
conditions due to the subsidence of cool air from aloft. Conversely during the summer months, the
passage of low pressure systems across the low to mid latitudes associated with the development of
the Queensland trough and southward shift in the inter-tropical convergence zone, along with more
intense solar heating, tend to produce warmer conditions and the development of afternoon
thunderstorms.

4.2.7     Climate extremes

Droughts
Periodic drought is part of the Australian weather pattern. Major Australian droughts have included
1963–68, 1972–73, 1982–83 and 1991–95 (BOM 2009b).

 Australia Pacific LNG Project EIS                Page 3                                       March 2010
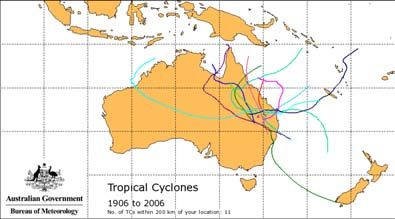
Volume 2: Gas Fields
Chapter 4: Climate and Climate Change Adaptation

Western Downs Regional Council, which includes Miles, and the Maranoa Regional Council, which
includes Roma, has been 'drought declared' with some areas drought declared since 2001
(Department of Primary Industries and Fisheries 2009).

Floods
The Condamine River is the major watercourse within the tenement study area. As a result, there is
significantly more information available with respect to historical flooding and stream flow data.
'Records of large floods along the Condamine extend back as far as 1887 at Warwick with extensive
records at several other locations on the mainstream. Major floods occur regularly, on average every
two years. The worst flooding recorded occurred in 1942, 1950, 1956, 1975, 1976, 1983 (twice), 1988
and 1996. Major floods generally only occur in the first half of the year although records indicate that
they may also occur in late spring' (BOM 2009c). For more information, refer to Volume 2 Chapter 11
– Surface Water and watercourses.

Tropical cyclones
Queensland is susceptible to cyclones which develop over tropical waters in northern Australia. The
gas fields region is within a 200km radius of Roma in south central Queensland. While there are more
cyclones over the coast, there were 11 tropical cyclones within a 200km radius of Roma from 1906 to
2006 (BOM 2009d). Figure 4.1 includes notable events such as cyclones Althea, Wanda, Cliff and
Gertie.

In the summer months, from January to March, tropical cyclones and tropical lows have an influence
on central Queensland weather patterns. These systems often interact with regions of high pressure
over southern Australia to produce strong pressure gradients over the whole of eastern Australia.
Cyclones occur rarely (
Volume 2: Gas Fields
Chapter 4: Climate and Climate Change Adaptation

Frequency of thunderstorms and lightning strikes
The frequency of thunderstorms has been estimated from maps developed by the BOM for Australia.
BOM has analysed ten years (1990 to 1999) of records of thunder-days, from 300 monitoring sites
around Australia, to produce a map of average annual thunder-days. A thunder-day is defined as 'an
observational day...during which thunder is heard at the station. Precipitation need not occur'
(Huschke 1959). An observational day is defined from midnight to midnight, local standard time.

The frequency of lightning activity has been estimated from maps of lightning flash density developed
by the BOM. Eight years of data has been analysed (1995 to 2002) from ground-based lightning
detectors and NASA satellite-based instruments. The lightning flash density is defined as the number
of flashes of a specific type occurring over unit area in unit time (Kuleshov et al. 2006). Total flash
density is made up of cloud-to-ground flashes and intracloud flashes. Total flash density and cloud-to-
ground flash densities are presented here.

Table 4.2 summarises the thunder-day and lightning flash density information for the Australia Pacific
LNG gas fields and gas pipeline.

Table 4.2 Project gas fields and gas pipeline areas – annual average thunder days, total
lightning flash density and cloud-to-ground flash density

                                  Parameter                                       Australia Pacific LNG gas-
                                                                                      field and pipeline

Thunder days (annual average – 1990-1999)                                       10 to 30 thunder-days per year

Total lightning flash density1 (annual average – 1995-2002)                     5 to 10 flashes per km2 per year

Cloud-to-ground lightning flash density2 (annual average – 1995-2002)           1 to 3 flashes per km2 per year
1
         Total lightning flash density: flashes per square kilometre per year
2
         Cloud-to-ground flash density: flashes per square kilometre per year

4.2.8        Impacts of weather patterns and extremes of climate on project
When designing and constructing the gas fields particular regard has been given to the historical
weather patterns and climate extremes. The south central Queensland region has a sub-tropical
climate, which is characterised by a moderately distinctive wet and dry season, high temperatures and
humidity.

Historical weather patterns show that summertime weather activity generates the wetter spring and
summer months, relative to the drier autumn and winter months, when the solar incidence is less
intense.

Construction methods and scheduling will be implemented to ensure personnel and the environment
are protected. Methods and timing of construction include ensuring erosion and sediment control
measures and stormwater management measures are appropriately constructed and sized to deal
with anticipated amount of rainfall, and that appropriate shelter is available for the workforce in
chances of severe weather. Appropriate weather protection will be provided for personnel.

Overall, south central Queensland does not experience a typical weather pattern that will restrict
construction or operation. The inclusion of appropriate measures, such as site stormwater
management systems and waste containment systems, will ensure personnel and the environment
are protected. Further information regarding mitigation measures can be found in Volume 2 Chapter 5,
Volume 2 Chapter 9, and Volume 2 Chapter 11.

    Australia Pacific LNG Project EIS                    Page 5                                        March 2010
Volume 2: Gas Fields
Chapter 4: Climate and Climate Change Adaptation
4.3 Climate change
While the inherent uncertainties surrounding predicted impacts are recognised, this section discusses
the gas fields' vulnerabilities to climate change and possible adaptation strategies.
4.3.1 Methodology
Effective climate change adaptation requires an awareness of the risks posed by climate change, and
an understanding of the relative significance of those risks.
A climate change adaptation risk assessment was conducted to assess how alterations to weather
patterns and rising sea level have the potential to impact on the gas fields. The climate change
predictions from Commonwealth Scientific and Industrial Research Organisation (CSIRO), which has
published the most comprehensive data to date, were compiled ahead of a climate change adaptation
risk assessment workshop.
The risk assessment process was conducted in accordance with the Risk Management Standard
AS/NZS ISO 31000:2009 and the Australian Government publication Climate Change Impacts and
Risk Management – A Guide for Business and Government (2006). Attendees at the workshop
included key decision makers on the Project, engineers and environmental specialists. Risks identified
were analysed and assessed using the Australia Pacific LNG risk matrix (refer Volume 1 Chapter 1)
and then screened for identification of mitigation measures. Existing measures were explored during
the risk assessment process and further mitigation actions were brought forward to be included into
the design criteria and operating strategies.
The climate change risk assessment process was conducted, as required by the EIS terms of
reference Section 3.1.2 Climate change adaptation, to assess the Project's vulnerabilities to climate
change and describe possible and preferred adaptation strategies. The climate projections used in the
risk assessment are provided in Section 4.3.2. Section 4.3.3 provides the risk mitigation measures
which treat the identified risks and have been incorporated into the design criteria and operating
strategies. Australia Pacific LNG cooperative approach to adaptation to climate change is described in
Section 4.3.4.
4.3.2 Climate projections
To assess the Project's vulnerability to climate change, predictions were gathered from the CSIRO
and the Queensland Government. These are referenced in the sections below.
CSIRO projects are available for years 2030, 2050 and 2070. The Project is estimated to operate for
30 years, starting in 2014 for LNG production train 1, making projections for 2050 the most appropriate
scenario. Where appropriate, 2050 projections have been used, but where predictions figures are
published only for 2030 and 2070 time horizons, both have been reported and used in the assessment
process.
The emissions scenarios referred to in this document include A1B, B1 and A1FI (CSIRO 2008), where:
• The B1 scenario refers to a global agreement that brings about dramatic reductions in global
emissions
• The A1B scenario refers to mid-range levels of global emission
• The A1FI scenario refers to high levels of emissions, in line with recent global emissions.
Changes in the climate of Australia by 2030 do not vary greatly from one emission scenario to
another. However, changes by 2070 are heavily dependent on the chosen emission scenario,
Australia Pacific LNG Project EIS Page 6 March 2010Volume 2: Gas Fields
Chapter 4: Climate and Climate Change Adaptation
because the scenarios are highly divergent beyond 2030. The best projections for the region have
been sought, but models are not all based upon the same emissions scenarios.
Several cities have climate change predictions presented in the Climate Change in Australia Cities
Summaries (CSIRO 2007) including St George, approximately 150km south of Roma, and Brisbane as
shown in Figure 4.2. For this study, predictions for St George have been considered as representative
of the geographical region of central south Queensland while predictions for Brisbane, Rockhampton
and Gladstone have been considered as representative of the region of the east coast of Queensland.
Temperature change
The information in Table 4.3 summarises the predicted mean temperature change for St George (in
the south central Queensland region). The table provides the 10th, 50th and 90th percentiles of the likely
change in the mean temperature. By 2050, the predicted increase in mean temperature is 3.6°C,
which was chosen as the basis for determining climate change impacts in the risk assessment. In
order to predict the average temperature in 2050, the predicted mean temperature change of 3.6°C is
added to the historical average temperature.
Table 4.3 Mean temperature change for St George (°C)1
2030 2050
Average (50%) Range (10%-90%) Average (50%) Range (10%-90%)
Annual 1.1 0.7 1.6 3.6 2.4 5.2
Dec-Feb 1.1 0.7 1.7 3.6 2.2 5.5
Mar-May 1.1 0.7 1.7 3.5 2.1 5.3
Jun-Aug 1.0 0.7 1.5 3.3 2.1 4.8
Sep-Nov 1.2 0.8 1.8 3.9 2.6 5.7
1
A1B predictions (2030) and A1FI (2050), 50% percentile and range (CSIRO 2007)
Australia Pacific LNG Project EIS Page 7 March 2010K:\ORIGIN\301001-00448\GIS\Maps\00448-00-EN-DAL-2330-Rev0(Vol2Chp4_Climate_MajorTowns).wor
LEGEND
Major town
Cities with climate change predictions
Major drainage and waterbodies
Major road
SOURCE INFORMATION
Major drainage and waterbodies (based on 250k topography) AUSTRALIA PACIFIC LNG PROJECT
Commonwealth of Australia (Geoscience
Australia) 2009
Roads and Towns Volume 2 Chapter 4
Department of Main Roads 2009
Figure 4.2 - Cities for which climate
change predictions are presented
by CSIRO
© Commonwealth of Australia (Geoscience Australia) 2010, © The State of Queensland (Department of Natural Resources and Water) 2010, © WorleyParsons Services Pty Ltd Users of the information recorded in this document (the Information) accept all responsibility and risk associated with the use of the Information and should seek independent professional advice in relation to dealings with property. Despite Department of Natural
Resources and Water (NRW)'s best efforts, NRW makes no representations or warranties in relation to the Information, and, to the extent permitted by law, exclude or limit all warranties relating to correctness, accuracy, reliability, completeness or currency and all liability for any direct, indirect and consequential costs, losses, damages and expenses incurred in any way (including but not limited to that arising from negligence) in connection
with any use of or reliance on the Information.Volume 2: Gas Fields
Chapter 4: Climate and Climate Change Adaptation
Precipitation change
The information in Table 4.4 summarises the predicted percentage of rainfall change for St George, in
the south central Queensland region. The table provides the 10 th, 50 th and 90th percentiles of the likely
change in precipitation. By 2070, the predicted decrease in mean rainfall is 10% annually, which has
been chosen as the basis for determining climate change impacts in the risk assessment. In order to
predict the average precipitation in 2050, the predicted mean precipitation change 10% is subtracted
from the historical average precipitation (CSIRO 2007).
As well as a decrease in annual rainfall, an increase in daily precipitation intensity (rain per rain-day)
and the number of dry days is also predicted. The future precipitation regime will have longer dry
spells interrupted by heavier precipitation events. Changes to extreme events would have the potential
to increase erosion and flood frequency, with implications for agriculture, forestry, river flow, water
quality, and the design standards of infrastructure. Drought occurrence is projected to increase over
most of Australia (CSIRO 2007).
Table 4.4 Mean rainfall change for St George (%)1
2030 2050
Average (50%) Range (10%-90%) Average (50%) Range (10%-90%)
Annual -3 -12 5 -10 -35 17
Dec-Feb -1 -12 10 -3 -33 33
Mar-May -3 -16 10 -11 -44 32
Jun-Aug -6 -19 6 -17 -49 18
Sep-Nov -6 -18 5 -18 -47 17
1
A1B Predictions (2030) and A1FI (2050), 50% percentile and range (CSIRO 2007)
Sea level rise
Sea level rise is not anticipated to affect the gas fields, as they are around 400km inland and 200
metres above sea level.
Cyclones
There are three components of tropical cyclones that combine to make the total hazard – strong
winds, intense rainfall and induced ocean effects including extreme waves. Climate change may affect
the frequency, severity and position of cyclones. There is some indication that precipitation rates may
increase by 20% to 30% during tropical cyclones (CSIRO 2007). Precipitation change has been
discussed in Section 4.3.2, exhibiting similar effects as during existing cyclonic events. Extreme waves
will have no material impact on the gas fields region of the Project.
Projections of tropical cyclones in the Australian region are limited, but the available studies suggest
there maybe an increase in the number of tropical cyclones in the more intensive categories
(categories 3-5) but a possible decrease in the total number of cyclones (Department of Climate
Change 2009).
Australia Pacific LNG Project EIS Page 9 March 2010Volume 2: Gas Fields Chapter 4: Climate and Climate Change Adaptation Bushfires Projections of fire risk have been undertaken for the gas fields region (Charleville) for 2020 and 2050. Fire risk is a rating calculated based on observations of temperature, relative humidity and wind speed combined with an estimate of the fuel state to predict the fire behaviour (Lucas et al. 2007). Changes in the risk of fire are summarised as percentile differences from 1974 to 2007 levels in Table 4.5. The authors of this study have used two global warming scenarios, low (Mark2) and high (Mark3). These scenarios are consistent with, but not the same as, Intergovernmental Panel on Climate Change models (B1, A1B and A1FI) (CSIRO 2008). Projections for 2050 indicate that when the global warming scenario is low, the fire risk rises +39% above 1974–2007 levels. When the global warming scenario is high, the fire risk increases by 205% above 1974–2007 levels. These percentage changes are relative to small baseline frequencies, where at present (1973–2007) the annual average number of extreme fire danger days at Charleville is 6.8 days and in a high global warming scenario the prediction is 20.9 days by 2050. Table 4.5 Percentile change in fire risk from average 1974-2007 levels* Global warming scenario 2020 2050 Low (Mark2) 19.0 39.4 High (Mark3) 49.6 204.9 *Source: Lucas et al. 2007 4.3.3 Climate change adaptation The following sections describe the climate change risk mitigation measures that have been incorporated into the design criteria and operating strategies. Alternative and further adaptation measures have been considered and documented in the risk assessment process and will be taken forward into the design phases of the Project. Climate change risk will continue to be reviewed during project implementation. Elevated temperatures Design for flexibility in relation to operating temperatures is part of the design considerations. Higher temperatures will affect the energy demand for cooling and compressor efficiency. Compressor operating ranges will be designed for predicted higher ambient temperatures. Air conditioning and shading of work areas, critical plant and equipment, and temporary accommodation facilities has been, and will continue to be, included in the design of the gas fields' construction and to protect against elevated temperatures. Water pipes will be buried, preventing temperatures increasing beyond desirable levels. These measures, which are included in the design of the gas fields and associated infrastructure, assist in adapting to climate change. The residual risk to the gas fields component of the Project was determined to be negligible. Precipitation change During heavy rainfall intensity events, safe systems of work are to be implemented. This will include managing travel plans, considering the storm warning and weather forecasts of BOM, and providing safe driver training to personnel. Design of water crossing, pond walls, roads and other water affected Australia Pacific LNG Project EIS Page 10 March 2010
Volume 2: Gas Fields
Chapter 4: Climate and Climate Change Adaptation

infrastructure will be designed to standards which include safety contingencies for increased intensity
of precipitation events.

Changes in precipitation frequency may cause groundwater levels to decrease. The use of treated
associated water is designed to be used by the Project for all project water needs where possible, to
prevent increased pressure on groundwater resources.

Erosion which may result from precipitation intensity and frequency change will be treated with
engineering solutions, in accordance with erosion control guidelines. These measures, which are
included in the design of the gas fields and associated infrastructure, assist in adapting to climate
change.

The residual risk to the gas fields and associated infrastructure was determined to be negligible.

Humidity
The impacts of changed humidity are considered to be low, because the decrease is still well within
the operating range of the equipment. Any impacts due to changes in humidity will be mitigated by a
maintenance program and use of corrosion inhibitors.

The residual risk to the gas fields and the associated infrastructure was determined to be negligible.

Cyclones
Interruptions to normal business operation may occur during cyclone events, if wind and dust storms
occur in the vicinity of the gas fields. Back up control systems and uninterrupted power supply will be
included in the project design. Back up diesel supplies will be provided for the temporary
accommodation facilities to maintain emergency power generation.

Structural elements for the gas fields will follow the building code for the appropriate cyclonic activity
applicable to the gas fields' geographical region and the predicted change due to climate change.

To preserve the health and safety of project personnel, the implementation of a journey management
system, emergency response plans, safe driver training and storm warnings will be included in the
operations systems.

These measures, which are included in the design of the gas fields, assist in adapting to climate
change. Further alternative adaptation measures which may be considered include extended journey
management plans to include contact with onsite personnel about weather warnings and maintain
updates to BOM weather forecasts, and design temporary accommodation facilities and enclosures for
extreme wind events.

The residual risk to the gas fields and the associated infrastructure was determined to be low. This is
due to the potential for more intense cyclones to present a health and safety risk to personnel.

Flooding
The change in precipitation intensity may result in increased localised flooding.

Water ponds and watercourse crossings will be designed to include a safety factor for the contingency
of higher water levels.

Pipes and critical power cables will be buried to accommodate erosion.

To preserve the health and safety of personnel, the implementation of a journey management system,
emergency response plans, safe driver training and storm warnings will be included in the operations
systems.

 Australia Pacific LNG Project EIS                Page 11                                       March 2010
Volume 2: Gas Fields
Chapter 4: Climate and Climate Change Adaptation

These measures, which are included in the design of the gas fields, assist in adapting to climate
change. Further alternative adaptation measures which may be considered include multiple exit roads
for critical plant and infrastructure to prevent road closures affecting access.

The residual risk to the gas fields and the associated infrastructure was determined to be low. This is
due to the potential for flooding to affect access to critical plant and infrastructure.

Bushfires
Bushfire breaks have been designed to maintain clearance around the well heads and surrounding
plant and equipment. Emergency shutdowns will be employed and sprinkler systems will be designed
for the temporary accommodation facilities. For more detail refer to Volume 2 Chapter 22 – Hazard
and risk.

Weather forecasting services and bushfire warnings will inform the withdrawal of personnel from
unsafe areas. It is also the intention to continue to work cooperatively with the rural fire service to
share information and receive advice. Controlled burning will be used where appropriate.

These measures, which are included in the design of the gas fields, assist in adapting to climate
change. Further alternative adaptation measures which may be considered include multiple exit roads
for critical plant and infrastructure to prevent road closures effecting access and extended journey
management plans to include a fire danger strategy.

The residual risk to the gas fields and the associated infrastructure was determined to be low. This is
due to the potential for bushfires to affect infrastructure in the gas fields or personnel working in the
gas fields.

4.3.4     Cooperative approach to climate change adaptation
Both Origin and ConocoPhillips work through the Australian Petroleum Production & Exploration
Association (APPEA) as an industry body. APPEA aims to work with governments to achieve credible
industry actions and governmental greenhouse policies that address greenhouse concerns in an
economically and commercially viable way. APPEA and its member companies are committed to
taking action on climate change, including the promotion of natural gas as apart of the Asia-Pacific
Economic Cooperation energy work.

APPEA member companies are also committed to reviewing (and if necessary adapting) their risk
management strategies (encompassing engineering design, safety and environmental assessments)
to reflect new learnings on the likely impacts of climate variability, to complement government action,
to give the community greater confidence about how the greenhouse issue is being addressed
(APPEA 2003).

Australia Pacific LNG is involved in regular engagement with key governmental agencies. The aim of
meeting with these stakeholders is to share project information as it comes to hand, seek guidance
about regulators' requirements and expectations for the EIS and approvals process, and to achieve
the proposed project assessment and approval schedule.

As part of this dialogue, the Project has met with the Gladstone Ports Corporation and Maritime Safety
Queensland. A cooperative relationship has been established and will continue with these
organisations and, where relevant, will involve discussions on climate change adaptation.

Australia Pacific LNG actively engaged with Department of Infrastructure and Planning (DIP) and
Department of Employment, Economic Development and Innovation (DEEDI) through a number of
forums, including:

 Australia Pacific LNG Project EIS                Page 12                                       March 2010
Volume 2: Gas Fields
Chapter 4: Climate and Climate Change Adaptation

   • LNG Executive Group (DEEDI) – meetings, approximately bi-monthly, with other LNG
     proponents and senior departmental officers to discuss strategic policy matters

   • Common Issues Forum (DEEDI) – fortnightly meetings with other LNG proponents to discuss
     operational issues of a common nature to the industry, such as co-location of gas pipeline
     common-user corridors established by the Queensland Government

   • LNG Industry Unit (DEEDI) – separate meetings with proponents are organised where
     instances of commercial confidentiality is required

   • Australia Pacific LNG EIS Project Group Meeting – EIS facilitation is provided through a DIP
     project manager and DERM representative each fortnight, to ensure that industry is provided
     with prompt advice on any issues raised

   • Input into DIP's Water Futures for the CSG water management policy being developed by the
     Coal Taskforce Unit.

Australia Pacific LNG undertakes to continue its cooperative approach with government, other industry
and other sectors to address adaptation to climate change. Australia Pacific LNG will take into account
climate change risks of flooding, temperature change and sea level rise in the design process.

4.4       Conclusion

4.4.1     Assessment outcomes
Based on the currently available data, climate change during the lifespan of the Project is expected to
be minor, in the context of the extremes in climate already experienced within the south central
Queensland region.

Gas fields' infrastructure will be designed and constructed to cope with the existing climate and future
potential climate change. Predicted changes in temperature, precipitation, cyclones and bushfires
have been considered, and the vulnerabilities of the gas fields have been assessed using the
appropriate risk assessment process.

Potential consequences of climate change that have been considered include:

   • Exposure to higher temperatures

   • Flooding from intense rainfall

   • Reduction in rainwater availability

   • Erosion

   • Damage from cyclonic conditions

   • Damage from bushfires.

Design features for wind action, flooding and bushfires have been incorporated into the design criteria
and will continue to be considered during the detailed design phase. Strategies to mitigate climate
change impacts during the construction and operation phases of the Project have been identified.

It was concluded from the risk assessment discussed above that there is currently adequate design
controls and strategies in place or planned for to adequately mitigate climate change risk. Climate
change risk will continue to be assessed during further stages of project implementation.

 Australia Pacific LNG Project EIS               Page 13                                     March 2010
Volume 2: Gas Fields Chapter 4: Climate and Climate Change Adaptation A summary of the environmental values, sustainability principles, potential impacts and mitigation measures in relation to climate and climate change associated with the gas fields are presented in Table 4.6. This table also includes the residual risk levels for climate and climate change. A risk assessment has been undertaken to identify the potential risks, causes and consequences from the climate and climate change. Mitigation measures to reduce the risk have been nominated and the residual risk has been calculated. Further details on the risk assessment methodology are provided in Volume 1 Chapter 4. Australia Pacific LNG Project EIS Page 14 March 2010
Volume 2: Gas Fields
Chapter 4: Climate and Climate Change Adaptation

Table 4.6 Summary of environmental values, sustainability principles, potential impacts and mitigation measures

 Environmental values                Sustainability principles                  Potential impacts             Possible         Mitigation and management                 Residual
                                                                                                               causes                   measures                         risk level

Life, health and well-being of   Minimising adverse environmental           Sedimentation, erosion,         Extreme         Refer to construction methods as             Low
people.                          impacts and enhancing                      stormwater management,          climate         outlined in Volume 2 Chapter 11 –
                                 environmental benefits associated          containment of waste in         events:         Water Resources and Volume 2
Diversity of ecological
                                 with Australia Pacific LNG's activities,   bunding and tailings dams,                      Chapter 5 – Topography,
processes and associated                                                                                    Droughts
                                 products or services; conserving,          health and safety risks to                      geomorphology, geology, soils and
ecosystems.
                                 protecting, and enhancing where the        personnel and interruption to   Floods          land contamination and Volume 2
                                 opportunity exists, the biodiversity       transportation                                  Chapter 17 – Traffic and transport.
                                                                                                            Tropical
                                 values and water resources in its
                                                                                                            Cyclones
                                 operational areas.

Life, health and well-being of   Identifying, assessing, managing,          Increased health and safety     Elevated        Shading and air-conditioning of work         Low
people.                          monitoring and reviewing risks to          risk to personnel               Temperatures    areas, critical plant and equipment,
                                 Australia Pacific LNG's workforce, its                                                     temporary accommodation facilities
Diversity of ecological                                                     Heat damage to
                                 property, the environment and the                                                          and waiting areas.
processes and associated                                                    infrastructure
                                 communities affected by its activities
ecosystems.                                                                                                                 Safe work procedures for hot
                                                                            Higher cooling and energy
                                                                                                                            conditions.
                                                                            demand
                                                                                                                            Water pipes buried to prevent
                                                                                                                            unnecessary temperature increase.

                                                                                                                            Design for increased cooling loads.

Life, health and wellbeing of                                               Drought                         Precipitation   Allowance for increased precipitation        Low
people.                                                                                                     Change          intensity in the existing design of water
                                                                            Decreased water quality
                                                                                                                            affected infrastructure.
Diversity of ecological
                                                                            Impacts on rivers and
processes and associated                                                                                                    Erosion management measures.
                                                                            wetlands
ecosystems.

 Australia Pacific LNG Project EIS                                                      Page 15                                                                         March 2010
Volume 2: Gas Fields
Chapter 4: Climate and Climate Change Adaptation
Environmental values Sustainability principles Potential impacts Possible Mitigation and management Residual
causes measures risk level
Dust due to dry windy Journey management plans
conditions incorporating storm warnings and
weather forecasts.
Erosion and sedimentation
Safe driver training.
Increased overland flow
runoff
Life, health and wellbeing of Impact on corrosion rates Humidity Gas fields inspection and maintenance Low
people. program.
Increase risk of heat stress
Diversity of ecological and dehydration Safe work procedures for hot
processes and associated conditions.
ecosystems.
Life, health and wellbeing of High wind speeds effecting Cyclones Operational systems to include journey Low
people. structures management plans, safe driver
training and storm warnings.
Diversity of ecological Tree fall impact on structures
processes and associated Follow the building code for
Health and safety risk to
ecosystems. appropriate cyclone category.
personnel
Back up control systems and
uninterrupted power supply.
Back up diesel supply in permanent
and temporary accommodation
facilities for emergency power
generation.
Australia Pacific LNG Project EIS Page 16 March 2010Volume 2: Gas Fields
Chapter 4: Climate and Climate Change Adaptation
Environmental values Sustainability principles Potential impacts Possible Mitigation and management Residual
causes measures risk level
Life, health and wellbeing of Loss of site access Flooding Water storage ponds and water course Low
people. crossings will be designed to include a
Erosion and sedimentation
safety margin for climate change.
Diversity of ecological
Wash away of personnel,
processes and associated Operations systems to include journey
pipelines or associated
ecosystems. management plans, safe driver
infrastructure
training and storm warnings.
Pipes and critical power cables will be
buried to accommodate erosion.
Life, health and wellbeing of Bushfire encroaching on the Bushfires Bushfire buffer areas. Low
people. gas fields or personnel
Emergency response plan to address
Diversity of ecological bushfire risk.
processes and associated
Bushfire warnings incorporated in
ecosystems.
journey management plans.
.
Australia Pacific LNG will continue to
work cooperatively with the rural fire
service to share information and
receive advice.
Australia Pacific LNG Project EIS Page 17 March 2010Volume 2: Gas Fields
Chapter 4: Climate and Climate Change Adaptation
4.4.2 Commitments
In order to manage potential impacts of climate and climate change associated with the gas fields and
associated infrastructure, Australia Pacific LNG will:
• Incorporate adaptive management approach to climate change throughout the life of the Project
• Incorporate the agreed preferred climate change strategies which resulted from the risk
assessment into the design process
• Cooperate with government, other industry and other sectors to address adaptation to climate
change.
Australia Pacific LNG Project EIS Page 18 March 2010Volume 2: Gas Fields Chapter 4: Climate and Climate Change Adaptation References Australian Petroleum Production & Exploration Associated Limited (APPEA) 2003, Greenhouse Response Strategy, Commitments of the Upstream Oil and Gas Industry, Public Policy Response: A Government/Industry Partnership, viewed November 2009, Bureau of Meteorology (BOM) 2009a, Bureau of Meteorology, viewed November 2009, Bureau of Meteorology (BOM) 2009b, Living with Drought, viewed November 2009, Bureau of Meteorology (BOM) 2009c, Flood Warning System for the Condamine River to Cotswold, viewed November 2009, http://www.bom.gov.au/hydro/flood/qld/brochures/condamine_cotswold/condamine_cotswold.shtml#Pr eviousFlooding Bureau of Meteorology (BOM) 2009d, Previous Tropical Cyclones, viewed November 2009, Bureau of Meteorology (BOM) 2009e, Tropical cyclones, viewed November 2009, Commonwealth Scientific and Industrial Research Organisation (CSIRO) 2007, Climate Change in Australia, Technical Report, developed by Commonwealth Scientific and Industrial Research Organisation and the Bureau of Meteorology in partnership with the Australian Greenhouse Office, Canberra. Commonwealth Scientific and Industrial Research Organisation (CSIRO) 2008, Climate Change Projections for the Townsville Region, report prepared by Hennessy K, Webb L, Ricketts J and Macadam I, report prepared for Townsville City Council. Department of Climate Change 2009, Climate Change Risks to Australia's Coast, Department of Climate Change, Commonwealth of Australia, Canberra. Department of Primary Industries and Fisheries 2009, Queensland Drought Situation as at 31st October 2009, viewed November 2009, Huschke RE (eds.) 1959, Glossary of Meteorology American Meteorological Society, Boston, Massachusetts. Kuleshov, Y, Mackerras, D and Darveniza, M 2006, Spatial distribution and frequency of lightning activity and lightning flash density maps for Australia, J.Geophys.Res., Vol. 111, D19105, doi:10.1029/2005JD006982. Lucas, C, Hennessy, KJ, Mills, G and Bathols, JM 2007, Bushfire Weather in Southeast Australia: Recent Trends and Projected Climate Change Impacts. A report prepared by the Bushfire Cooperative Research Centre, Australian Bureau of Meteorology and CSIRO Marine and Atmospheric Research for The Climate Institute of Australia. Australia Pacific LNG Project EIS Page 19 March 2010
You can also read