2019 Half Year Results Presentation - 21 February 2019 - Growthpoint Properties Australia

Page created by Darlene Joseph
 
CONTINUE READING
2019 Half Year Results Presentation - 21 February 2019 - Growthpoint Properties Australia
2019
Half Year Results
Presentation
21 February 2019

Growthpoint Properties Australia
Growthpoint Properties Australia Trust ARSN 120 121 002
Growthpoint Properties Australia Limited ABN 33 124 093 901 AFSL 316409
www.growthpoint.com.au
2019 Half Year Results Presentation - 21 February 2019 - Growthpoint Properties Australia
Agenda.

1.   HY19 Highlights and Conditions

2.   Financial Management

3.   Property, Strategy and Summary
2019 Half Year Results Presentation - 21 February 2019 - Growthpoint Properties Australia
HY19
                                         Highlights and
                                         Conditions

                                         Timothy Collyer
                                         Managing Director

75 Dorcas Street, South Melbourne, VIC
2019 Half Year Results Presentation - 21 February 2019 - Growthpoint Properties Australia
Highlights for HY19.

         Office and
         Industrial/Logistics                                                      12.5cps                                     11.4cps
         remain favoured                                                               HY19 FFO                                  HY19 DPS
         property sectors in                                                          No change                                 +3.6% vs HY18
         Australia                                                                     on HY18

                                          69%                                          $3.36                                     35.0%
                                           Office
                                                                                           NTA                                    Gearing

                                                      31%                               +5.3%
                                                                                   vs 30 June 2018
                                                                                                                                   +110bps
                                                                                                                               vs 30 June 2018
                                                    Industrial

Growthpoint Properties Australia Half Year Results Presentation for the six months ended 31 December 2018 | 21 February 2019                     4
2019 Half Year Results Presentation - 21 February 2019 - Growthpoint Properties Australia
CBD fringe acquisitions
complement existing office portfolio.

                                                                      Newstead, QLD office                                     Property details
        Inaugural office                                              acquisition and successful
        investment in Perth, WA                                       equity raising
                                                                                                                               Property type                Office

                                                                                                                               Purchase price              $250m1
        tt Acquisition of modern, A-Grade                             tt Acquisition of modern, A-Grade
           office building for $91.3 million1                            office building for $250 million1
                                                                                                                               Occupancy                    100%

                                                                                                                               Major tenant     Bank of Queensland
        tt 100% leased to Commonwealth                                tt Partly funded by $135 million
           of Australia                                                  Rights Offer which achieved                           WALE                      7.4 years

        tt Long WALE of 8.1 years                                        substantial support from new                          Car parks               195 spaces
                                                                         and existing Securityholders
        tt Annual rent reviews of 3.75%                                                                                        Site area                5,157 sqm

1. Prior to acquisition costs.

Growthpoint Properties Australia Half Year Results Presentation for the six months ended 31 December 2018 | 21 February 2019                                         5
2019 Half Year Results Presentation - 21 February 2019 - Growthpoint Properties Australia
Good progress on internal development
and expansion opportunities.

     Construction of new                                                                      Expansion of
     19,300 sqm office                                                                        Woolworths
     building underway in                                                                     Distribution Centre in
     Richmond, VIC                                                                            Gepps Cross, SA
     tt Construction currently                                                                tt $57 million expansion,
        tracking ahead of schedule                                                               including an extension of the
        with completion expected in                                                              existing temperature controlled
        first half of 2020                                                                       and ambient warehouses, construction of
                                                                                                 a new recycling facility and other ancillary
     tt Feedback from prospective tenants positive,
                                                                                                 improvements
        with interest expressed in modern design
        specifications and convenient location of new                                         tt GOZ to receive coupon for project
        building                                                                                 costs at yield of 6.75% per annum
     tt Expected to deliver a fully let yield on                                              tt Planning includes 1.5 MW solar installation
        development cost of between 7.5% and
                                                                                              tt Lease over existing and expanded buildings
        8.5% with opportunity for capital gain above
                                                                                                 resets for 15 years from practical completion,
        development cost
                                                                                                 expected mid 2020

Growthpoint Properties Australia Half Year Results Presentation for the six months ended 31 December 2018 | 21 February 2019                      6
2019 Half Year Results Presentation - 21 February 2019 - Growthpoint Properties Australia
Financial
                                        Management

                                        Dion Andrews
                                        Chief Financial Officer

836 Wellington Street, West Perth, WA
2019 Half Year Results Presentation - 21 February 2019 - Growthpoint Properties Australia
HY19 P&L analysis.

                                                                                                                               Contribution from new acquisitions
                                                                                                                               (+$2.8m) offset by lost income from
                                                                                                                               sold properties (-$2.4m), transition
Components of Funds from Operations (FFO)                                          HY19             HY18          Change       to new lease with Country Road/
                                                                                                                               David Jones (-$1.4m) and loss of
Net Property Income                                                 $’000       111,274          108,823            2.3%       income from Building 3, Richmond
                                                                                                                               (-$0.4m). Remaining uplift (+$3.8m)
Add back amortisation of incentives                                 $’000          9,247            7,464         23.9%        driven by rental increases and new
                                                                                                                               leasing
Net Property Income excluding amortisation of incentives $’000                  120,521           116,287           3.6%

Net finance costs                                                   $’000       (27,252)          (27,941)        (2.5%)       Introduction of Country Road/David
                                                                                                                               Jones lease incentive which was
                                                                                                                               incurred in 2H18. Bulk of remaining
Operating and trust expenses (less depreciation)                    $’000        (6,081)           (5,998)          1.4%
                                                                                                                               incentive incurred in 1H19
Income tax (expense) / gain excluding deferred tax expense          $’000           (619)              128       583.6%
                                                                                                                               Higher tax due to development
FFO                                                                 $’000         86,569           82,476           5.0%       management fees being earned in
                                                                                                                               the Company
Weighted average securities                                           No. 690,594,953        661,716,369            4.4%
                                                                                                                               Uplift driven by acquisitions but FFO
FFO per security                                                    cents           12.5              12.5               –     per security flat due to increased
                                                                                                                               number of shares on issue
Distributions per security                                          cents           11.4              11.0          3.6%
                                                                                                                               Increase driven by new shares on
                                                                                                                               issue from DRP (13,046,823) and
                                                                                                                               Rights Offer (39,023,227)

Growthpoint Properties Australia Half Year Results Presentation for the six months ended 31 December 2018 | 21 February 2019                                    8
2019 Half Year Results Presentation - 21 February 2019 - Growthpoint Properties Australia
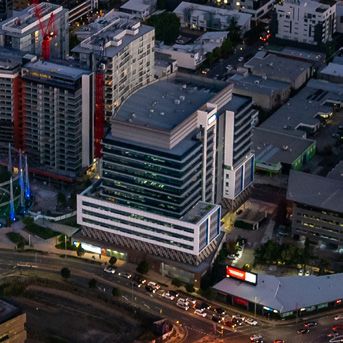
Movements in gearing.

tt Gearing uplift from                               Items influencing gearing
   acquisitions over the half                        for the six months ended 31 December 2018
   offset by equity raised via
   DRP and well-supported
   Rights Offer and positive                                                              +1.7%        +0.1%       +0.3%
   revaluations                                                               +2.3%
tt Preference for gearing to
                                                                  +0.8%                                                         -2.2%                            35.0%
   remain close to bottom of                         33.9%                                                                                -1.0%
   target range (35% to 45%)                                                                                                                          -0.9%

tt Items likely to influence
   gearing in 2H19 include;
   development funding of
   Botanicca 3 in Richmond,
                                                                                                      110bps
                                                                                                  increase since 30 June 2018
   VIC and Gepps Cross, SA
   expansion offset by the
   sale of two small assets
                                                    30 Jun 18   Distribution Acquisition Acquisition Development    Net         Equity    Earnings Revaluations 31 Dec 18
                                                                    paid     West Perth, Newstead,     funding   incentives     raised        for
                                                                                WA          QLD      Botanicca 3   given                 distribution

Growthpoint Properties Australia Half Year Results Presentation for the six months ended 31 December 2018 | 21 February 2019                                             9
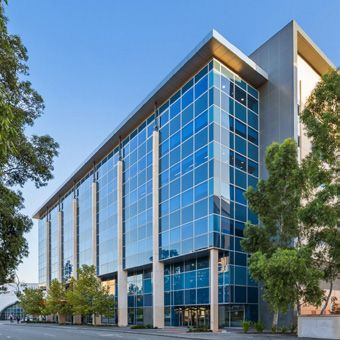
2019 Half Year Results Presentation - 21 February 2019 - Growthpoint Properties Australia
Movements in NTA.

Uplift driven by:                                  Movements in NTA
                                                   per stapled security ($)
tt 21 bps fall in weighted                                                                                                          +$0.02            $3.36
   average capitalisation rate                                                                               +$0.01
   of property portfolio since                                                       +$0.14
   30 June 2018 to 6.04%
tt Improvement in market
   rents contributed to
   approximately a quarter of
   uplift in property valuations
tt Raising equity at a                                        $3.19
   price above NTA also
   contributed to the HY19
   uplift
                                                                                                           5.3%
                                                                                                   increase since 30 June 2018

                                                             30 Jun 2018              Property               Financial            Equity raising     31 Dec 2018
                                                                                    revaluations           instruments         & retained earnings
                                                                                                           revaluations

Growthpoint Properties Australia Half Year Results Presentation for the six months ended 31 December 2018 | 21 February 2019                                       10
Balance sheet in excellent shape.

Summary of debt facilities                                                    Change in gearing and cost of debt (%)
                                                                                                                                                                    Weighted
Secured bank loans                          Limit          Drawn   Maturity                                                                                        average debt
                                                                              55%                                                        Gearing            7.0%     maturity
                                                $m            $m
                                                                                     6.7
                                                                                                                                                                   4.2yrs
                                                                                                                                       target range
Syndicated Facility
- Facility B                                  100            100    Mar-23
                                                                              50%                                                      35 - 45%             6.5%
                                                                                    46.8
- Facility C                                  245            245    Dec-21    45%                                                                           6.0%
- Facility D                                    70            70    Dec-21
- Facility E                                  150            117    Jun-23    40%                                                                           5.5%     Gearing
- Facility G
- Facility I
                                              150
                                                75
                                                              89
                                                               –
                                                                    Sep-21
                                                                    Nov-20    35%
                                                                                                                                                   35.0
                                                                                                                                                            5.0%
                                                                                                                                                                   35.0%
- Facility H                                    75             –    Sep-20
                                                                              30%                                                                           4.5%
- Facility J                                  150            150    Feb-20
Loan note 1                                   200            200    Mar-25                                                                            4.1
                                                                              25%                                                                           4.0%
Loan note 2                                   100            100    Dec-22                                                                                          All-in cost
Loan note 3                                     60            60    Dec-22                                                                                           of debt

                                                                                                                                                                     4.1%
                                                                              20%                                                                           3.5%
Fixed bank facility 1                           90            90    Dec-22
                                                                                    June 13    June 14   June 15   June 16   June 17    June 18    Dec 18
USPP 1                                        130            130    Jun-27
USPP 2                                          52            52    Jun-29                    Balance Sheet Gearing (LHS)      All-in cost of debt (RHS)
USPP 3                                          26            26    Jun-29
Total loans                                 1,673          1,429

As at 31 December 2018, the Group had debt headroom
of $244 million. The incremental cost of deploying it would
be an additional 2.72% per annum1 on the amount drawn
as line and upfront fees have already been paid.

1. Based on a floating rate of 1.96% at 11 January 2019.

Growthpoint Properties Australia Half Year Results Presentation for the six months ended 31 December 2018 | 21 February 2019                                                      11
Summary.

nnFFO guidance upgraded during the half to at least 24.8 cps

nnPositioned for growth following accretive acquisitions and lowered debt costs

nnEvidence of strong Securityholder support following recent equity raising

nnBalance sheet in good shape with substantial headroom to debt covenants and
  gearing at bottom of target range

nnConsidering further debt capital market issuance to further diversify and extend
  funding profile

Growthpoint Properties Australia Half Year Results Presentation for the six months ended 31 December 2018 | 21 February 2019   12
Property,
                                                           Strategy and
                                                           Summary

                                                           Timothy Collyer
                                                           Managing Director

Hugh Edwards Drive & Tarlton Crescent, Perth Airport, WA
Portfolio Summary.

Sector diversity (%)                                                                   Geographic diversity (%)                          Occupancy (%)
by property value, as at 31 December 2018                                              by property value, as at 31 December 2018         by income, as at 31 December 2018

                                                                                       NSW 24%
                                                                                                             WA 8%
Office 69%                                                                                                                                                      Occupied 99%
                                                                                                                  SA 6%
                                                                                                                   ACT 4%
                                                                                                                   TAS 1%                                          Vacant 1%

                                                                                                               QLD 30%
                                                                                       VIC 27%
                                         Industrial 31%

Tenant type (%)                                                                        Tenant use (%)                                    Annual rent review type (%)
by income, as at 31 December 2018                                                      by income, as at 31 December 2018                 by income value, as at 31 December 2018
                                                                                                         Logistics /
                                             Private Company                                             Distribution 29%
                                             & Other 19%                                                                                                       Fixed over 4.00% 12%
                                                                                                                      Manufacturing 2%
                                                                                                                      Retail 2%                                    CPI 6%
                                                                                                                      Car parking 1%             WARR
                                                                                                                                                                    CPI+1.00% 1%
                                                                                                                      Other 1%                   3.3%1

                                                                                                                                                                 Fixed 2.00-2.99% 15%
                                                Government
  Listed                                        24%
  Company 57%                                                                                            Office 65%                                     Fixed 3.00-3.99% 66%

1. Assumes CPI change of 1.8% per annum as per Australian Bureau of Statistics release for CY18.

Growthpoint Properties Australia Half Year Results Presentation for the six months ended 31 December 2018 | 21 February 2019                                                            14
High quality tenants and
manageable near-term expiries.
Top ten tenants                                                               Portfolio lease expiry profile (%)
by passing rent, as at 31 December 2018                                       per financial year, by income
                                                                    WALE
                                                    %                (yrs)       Major lease expiries (>1% of portfolio income)
Woolworths                                         14                 4.0        Office
NSW Police                                           8                5.4        Industrial

Commonwealth of Australia                            7                7.6                                                                                     NSW Police 8.1%
                                                                                                                                  Woolworths 9.9%                 Lion 2.3%
Bank of Queensland                                   4                8.1                                                          Samsung 2.4%                  Linfox 1.5%
                                                                                                                                    Downer 1.5%                 Peabody 1.5%
Country Road/ David Jones                            4               13.5                                                                                      Tas Hydro 1.1%
Linfox                                               4                4.4
                                                                                                        ANZ 2.2%
                                                                                                       Optus 1.6%                                                               36%
Samsung Electronics                                  2                3.2
                                                                                                       Linfox 1.2%
Lion                                                 2                5.3
                                                                                                                                               Central SEQ 1.9%
ANZ Banking Group                                    2                1.2                                                                      Fox Sports 1.8%
Jacobs Group                                         2                7.8                                            Monash Uni 1.4%
TOTAL / Weighted Average                           49                 5.8                                                              19%                         20%
Balance of portfolio                               51                 4.3
Total portfolio                                   100                 5.1                                 10%
                                                                                                                                                     8%
Like-for-like NPI growth:                                                                                                 5%
HY19 vs HY18                                    Office Industrial    Total       1%          1%
                                                    %          %        %
                                                                               Vacant       FY19         FY20            FY21          FY22         FY23          FY24          FY25+
NPI                                               1.3        2.6      1.8
NPI - FFO                                         2.7        3.9      3.1
Distributions from equity related investments                         3.7

Growthpoint Properties Australia Half Year Results Presentation for the six months ended 31 December 2018 | 21 February 2019                                                            15
Simple business model – strong track record of returns.

        Property                                                                   Capital Management                                     Returns
                                                                                   nn Considering further debt capital markets issuance   Total Securityholder
                                                                                      to further diversify and extend funding profile     return (%)1

                                                                                   nn Maintain prudent gearing settings                   16.7
                                                                                                                                                              13.7
       nn Continue to seek well-leased, well-                                      nn Aim to match long WADM with long WALE
          located commercial real estate                                           nn Raise equity to support accretive acquisitions                                  7.6
          in established areas and in close
          proximity to CBDs, major transport                                       nn Investment grade credit rating of Baa2                       3.3
          linkages and significant infrastructure                                     with stable outlook
                                                                                                                                          1 year             3 year
       nn Consider internal development and
          expansion opportunities where                                                                                                   16.1                16.8

          value can be added to property we                                        Sustainability                                                  12.5
          own                                                                                                                                                         10.7

       nn Review listed market opportunities                                       nn We recognise the relationship between
                                                                                      providing great spaces to work and securing
       nn Act early on upcoming lease expiries                                        long-term returns for our Securityholders
                                                                                                                                          5 year             10 year
       nn Not considering investment in retail at                                  nn Focus for 2019 is on progressing solar projects        Growthpoint
          this time                                                                   and lowering energy costs for our tenants              S&P/ASX 300 A-REIT accumulation index

                                                                 Generate sustained value for our investors,
                                                                      our tenants and the community
1. Source: UBS Investment Research: Annual compound returns to 31 December 2018.

Growthpoint Properties Australia Half Year Results Presentation for the six months ended 31 December 2018 | 21 February 2019                                                    16
Summary.

nnStrong operational result in HY19 driven by accretive acquisitions – FFO guidance
  increased during the half

nnOversubscribed equity raising evidence of strong Securityholder support

nnFavoured office and industrial sectors continue to display superior growth prospects

nnBalance sheet strength

nnFocus on returns:
    –– Successful execution of Richmond development and Gepps Cross expansion
    –– Early action on upcoming lease expiries
    –– Acquiring further well leased, well located assets

Growthpoint Properties Australia Half Year Results Presentation for the six months ended 31 December 2018 | 21 February 2019   17
Appendices

100 Skyring Terrace, Newstead, QLD
State of key                                                                                                                                                                   3% of
                                                                                                                                                                            Growthpoint
                                                                                                                                                                              Portfolio   Brisbane - CBD                            Brisbane - Fringe
                                                                                                                                                                                                                                                          20% of
                                                                                                                                                                                                                                                        Growthpoint
                                                                                                                                                                                                                                                          Portfolio

office markets.                                                                                                                                                                           Vacancy 13.2%
                                                                                                                                                                                         Prime    Secondary
                                                                                                                                                                                                                                     Vacancy 16.3%
                                                                                                                                                                                                                                   Prime    Secondary
                                                                                                                                                                                 R    $729 gross $564 gross               R     $ 548 gross $443 gross
R   Average face rent per sqm per annum
                                                                                                                                                                                 I       38%        40%                   I        38%         38%
I   Average incentives
Y   Average core market yield                                                                                                                                                    Y    5.25-6.75% 5.75-7.75%               Y     5.75-7.75% 6.25-8.75%

                                                                                                                                                                                                                                                          9% of
                                                                                                                                                                                                                                 Sydney - Parramatta Growthpoint
                                                                                                                                                                                                                                                         Portfolio
                                                                                                                                                                                                                                    Vacancy 3.9%
    Rents                                Rents                                                                                                                                                                                   Prime    Secondary
 decreasing                           increasing                                                                                                                                                                      R        $518 net   $385 net
/ incentives                         / incentives
increasing /                         decreasing /                                                                                                                                                                     I          17%        19%
    yields            Stable             yields                                                                                                                                                                       Y       5.13-6.25% 5.50-7.25%
  softening                             firming
                                                                                                                                                                                                                                                          7% of
                                                                                                                                                                                                                                Sydney Olympic Park Growthpoint
               Ma                                                                                                                                                                                                                                        Portfolio
                    rket pendu lum
                                                                                                      0% of                                                                                                                   Vacancy 15.8%
                                                                                                   Growthpoint    Adelaide - CBD                                                  Brisbane
                                                                                                     Portfolio                                                                                                                   Prime
                                                                                                                  Vacancy 13.7%                                                                                       R         $390 net
         0% of                                                                                                                                                                                                        I           19%
      Growthpoint
                                                                                                                Prime    Secondary
                           Perth - CBD                                                                                                                                                                                Y       5.75 - 6.75%
        Portfolio                                                                                        R   $500 gross $346 gross
                         Vacancy 21.1%                                                                   I      37%        36%                                                                                                                             0% of
                        Prime    Secondary                        Perth                                  Y   6.00-7.50% 7.50-8.75%                                                                                                  Sydney - CBD        Growthpoint
               R      $621 net   $375 net                                                                                                                                       Sydney                                                                    Portfolio
                                                                                                                                                                                                                                    Vacancy 4.1%
               I        48%        51%                                                                                                                               Canberra
               Y     5.75-7.75% 7.75-9.50%
                                                                                                                                        Adelaide                                                                                 Prime    Secondary
                                                                                                                                                                                                                      R       $1,122 net  $837 net
                                                                                                                                                                                                                      I          19%        16%
         2% of
                                                                                                                                                           Melbourne                                                  Y       4.50-5.00% 4.75-5.25%
      Growthpoint       Perth - West Perth
        Portfolio
                         Vacancy 19.7%
                                                                                                                                                                                                                                    4% of
                        Prime    Secondary             0% of                                14% of                                    3% of
                                                                                                                                                                                                           Canberra              Growthpoint
                                                    Growthpoint      Melbourne - CBD      Growthpoint     Melbourne - Fringe       Growthpoint   Melbourne - SE Suburbs
               R      $353 net   $251 net                                                                                                                                                                                          Portfolio
                                                      Portfolio                             Portfolio                                Portfolio                                                        Vacancy 10.9%
               I        35%        36%                                Vacancy 3.7%                           Vacancy 5.5%                            Vacancy 7.5%
               Y     7.00-8.25% 8.00-9.25%                                                                                                                                                          Prime    Secondary
                                                                     Prime    Secondary                    Prime    Secondary                       Prime    Secondary
                                                                                                                                                                                             R   $446 gross $381 gross
                                                           R       $580 net   $433 net            R      $441 net   $363 net               R      $396 net   $290 net
                                                                                                                                                                                             I      20%         24%
                                                           I         29%        27%               I        19%        23%                  I        21%        25%
                                                                                                                                                                                             Y   6.00-7.50% 7.00-12.50%
Sources: JLL, Knight Frank,                                Y      4.63-5.50% 4.75-6.00%           Y     5.00-5.50% 5.00-6.00%              Y     5.25-6.00% 5.50-7.50%
Growthpoint research

Growthpoint Properties Australia Half Year Results Presentation for the six months ended 31 December 2018 | 21 February 2019                                                                                                                                19
State of key
industrial markets.
R   Average face rent per sqm per annum
I   Average incentives
Y   Average core market yield

                                                                                                                                                                                    7% of
    Rents                                Rents                                                                                                                    Brisbane       Growthpoint
 decreasing                           increasing                                                                                                                                   Portfolio
/ incentives                         / incentives                                                                                                               466,082 sqm*
increasing /                         decreasing /
    yields            Stable             yields                                                                                                                Prime    Secondary
  softening                             firming                                                                                                         R    $111 net    $85 net
                                                                                                                                                        I      5-15%     10-15%
               Ma                                                                                                                                       Y   5.75-6.75% 7.25-8.50%
                    rket pendu lum
                                                                                                                                             Brisbane

                   6% of                                          3% of
                Growthpoint            Perth           Perth   Growthpoint          Adelaide
                  Portfolio                                      Portfolio                                                                 Sydney                                 5% of
                                   694,978 sqm*                                   Not Available                                                                    Sydney      Growthpoint
                                                                                                                                                                                 Portfolio
                                  Prime    Secondary                            Prime    Secondary                Adelaide                                      347,545 sqm*
                         R       $98 net    $84 net                   R        $88 net     $64 net
                                                                                                                                                               Prime    Secondary
                         I        5-20%     10-20%                    I        10-20%     10-20%
                         Y     6.00-6.75% 7.50-8.25%                  Y      6.50-8.75% 8.75-10.50%
                                                                                                                               Melbourne                R    $150 net   $138 net
                                                                                                                                                        I      5-15%     8-15%
                                                                                                                                                        Y   4.75-6.00% 5.25-7.00%
                                                                                           10% of
                                                                                         Growthpoint         Melbourne
                                                                                           Portfolio
                                                                                                           661,026 sqm*
                                                                                                          Prime    Secondary
                                                                                                  R      $93 net    $71 net
                                                                                                  I      10-25%     10-25%
Sources: JLL, Knight Frank, Growthpoint research.
                                                                                                  Y    5.25-6.50% 6.00-7.50%
*Total market vacancy.

Growthpoint Properties Australia Half Year Results Presentation for the six months ended 31 December 2018 | 21 February 2019                                                        20
Geographic
diversity.                                                                                                                   86% of properties
                                                                                                                             located on Eastern
                                                                                                                             seaboard
by property value,
as at 31 December 2018

Number of assets:                                                                                                                           30%
                                                                                                                                            Queensland
     Office properties ($2.7bn)
                                                                                                                                            $1,153.0m
     Industrial properties ($1.2bn)                                                                                                         – Office $899.5m
                                                                                                                                            – Industrial $253.5m

                                                                                                                                            24%
                                                                                                                                            New South Wales
                                                                                                                                            $950.9m
                                                                                                                    8    4                  – Office $745.3m
                                                                                                                                            – Industrial $205.7m

                                             1      2
                                                                                          2    4                    6    5
                                                                                                                                            4%
                                                                                                                                            Australian Capital
                                                                                                                2                           Territory
                                                                                                                                            $170.5m

                             8%
                             Western Australia                     6%
                                                                                                   8   16
                                                                                                                                            – Office $170.5m

                             $310.2m
                             – Office $91.3m
                                                                   South Australia
                                                                   $214.4m
                                                                                                                                            27%
                                                                                                                                            Victoria
                             – Industrial $218.9m                  – Office $82.2m
                                                                                                                1
                                                                                              1%
                                                                   – Industrial $132.2m                                                     $1,036.8m
                                                                                                                                            – Office $661.7m
                                                                                                                                            – Industrial $375.0m
                                                                                              Tasmania
                                                                                              $25.0m
                                                                                              – Office $25.0m

Growthpoint Properties Australia Half Year Results Presentation for the six months ended 31 December 2018 | 21 February 2019                                       21
Top five office properties/
property groups by value.

                                  SW1 Complex,                    1 Charles St,                 Sydney Olympic Park,          100 Skyring Terrace,            Bldgs 1, 2, & 3, 572-576
                                  South Brisbane, QLD             Parramatta, NSW               NSW (4 properties)            Newstead, QLD                   Swan St, Richmond, VIC

55%                               (5 properties)                                                                                                              (4 properties, incl. car park)

of office portfolio               Book value          $369.5m     Book value        $346.0m     Book value        $269.3m     Book value          $250.0m     Book value          $229.2m

                                  Cap rate               6.0%     Cap rate             5.3%     Cap rate             6.0%     Cap rate               5.8%     Cap rate               5.3%

$ 1,464.0m                        WALE

                                  % of office
                                                      4.9 years   WALE

                                                                  % of office
                                                                                    5.4 years   WALE

                                                                                                % of office
                                                                                                                  3.5 years   WALE

                                                                                                                              % of office
                                                                                                                                                  7.4 years   WALE

                                                                                                                                                              % of office
                                                                                                                                                                                13.4 years

total value of top five           portfolio               14%     portfolio             13%     portfolio             10%     portfolio                9%     portfolio                9%
properties / property
groups                            Occupancy2              96%     Occupancy2           100%     Occupancy2            94%     Occupancy     2
                                                                                                                                                     100%     Occupancy2            100%

                                  Lettable area    37,536 sqm     Lettable area   32,356 sqm    Lettable area   36,081 sqm    Lettable area     24,665 sqm    Lettable area    23,156 sqm

6.0yrs                            Site area

                                  Major tenant
                                                   23,247 sqm

                                                  Jacobs Group
                                                                  Site area

                                                                  Major tenant
                                                                                   6,460 sqm

                                                                                  NSW Police
                                                                                                Site area       22,229 sqm

                                                                                                                  Samsung
                                                                                                                              Site area          5,157 sqm

                                                                                                                                                   Bank of
                                                                                                                                                              Site area        29,034 sqm

                                                                                                                                                                              Country Road
weighted average                                                                                Major tenant    Electronics   Major tenant      Queensland    Major tenant           Group
                                  No. tenants               29    No. tenants              1
lease expiry                                                                                    No. tenants             15                                    No. tenants                4
                                                                                                                              No. tenants                7

3.6%
weighted average
rent review1

1. Assumes CPI change
   of 1.8% per annum as
   per Australian Bureau of
   Statistics release for CY18.
2. Occupancy is for office
   space and may exclude
   a small number of vacant
   cars.

Growthpoint Properties Australia Half Year Results Presentation for the six months ended 31 December 2018 | 21 February 2019                                                          22
Top five industrial properties/
property groups by value.

                                  Woolworths                     Linfox properties,             Melbourne Airport              Knoxfield industrial            Perth Airport industrial
                                  Distribution Centres           Erskine Park, NSW              industrial properties,         properties, VIC                 properties, WA

79%                               (4 properties)                 (3 properties)                 VIC (6 properties)             (3 properties)                  (4 properties)

of industrial portfolio           Book value         $556.2m     Book value         $158.5m     Book value         $105.3m     Book value           $69.7m     Book value          $47.9m

                                  Cap rate               6.4%    Cap rate              5.6%     Cap rate              8.0%     Cap rate               5.9%     Cap rate              7.6%

$ 937.6m                          WALE

                                  % of office
                                                     4.0 years   WALE

                                                                 % of office
                                                                                    4.4 years   WALE

                                                                                                % of office
                                                                                                                   5.8 years   WALE

                                                                                                                               % of office
                                                                                                                                                  5.5 years    WALE

                                                                                                                                                               % of office
                                                                                                                                                                                 5.3 years

total value of top five           portfolio              47%     portfolio              13%     portfolio                9%    portfolio                6%     portfolio               4%
properties / property
groups                            Occupancy             100%     Occupancy             100%     Occupancy             100%     Occupancy              100%     Occupancy              81%

                                  Lettable area   282,041 sqm    Lettable area    58,077 sqm    Lettable area   139,679 sqm    Lettable area    37,694 sqm     Lettable area   32,018 sqm

4.5yrs                            Site area

                                  Major tenant
                                                  928,336 sqm

                                                   Woolworths
                                                                 Site area

                                                                 Major tenant
                                                                                 195,490 sqm

                                                                                       Linfox
                                                                                                Site area       250,660 sqm

                                                                                                                 Australian
                                                                                                                               Site area        68,389 sqm

                                                                                                                                                    Brown &
                                                                                                                                                               Site area       57,617 sqm

                                                                                                                                                                               Mainfreight
weighted average                                                                                                     Postal                          Watson    Major tenant    Distribution
                                  No. tenants               4    No. tenants               5    Major tenant    Corporation    Major tenant
lease expiry                                                                                                                                   International
                                                                                                                                                               No. tenants                5
                                                                                                No. tenants               7    No. tenants                4

2.6%
weighted average
rent review1

1. Assumes CPI change
   of 1.8% per annum as
   per Australian Bureau of
   Statistics release for CY18.

Growthpoint Properties Australia Half Year Results Presentation for the six months ended 31 December 2018 | 21 February 2019                                                          23
Summary Financials.

                                                                                                    HY19                   HY18       Change     % Change

Net Property Income                                                         $'000                111,274                108,823         2,451         2.3
Like-for-like Net Property Income                                           $'000                107,625                105,679         1,946         1.8
Statutory accounting profit                                                 $'000                188,757                207,291       (18,534)       (8.9)
Statutory accounting profit per security                                        ¢                     27.3                     31.3      (4.0)      (12.8)
Funds From Operations (FFO)                                                 $'000                  86,569                 82,476        4,093         5.0
FFO per security                                                                ¢                     12.5                     12.5       0.0         0.0
Distributions per security                                                      ¢                     11.4                     11.0       0.4         3.6
Payout ratio to FFO                                                            %                      95.8                     88.3                   7.6

Calendar year ICR                                                           times                      4.0                      4.2      (0.2)       (4.5)
Calendar year MER                                                              %                      0.38                     0.40                 (0.02)

                                                                                     As at 31 Dec 2018       As at 30 Jun 2018        Change     % Change
NTA per stapled security                                                        $                     3.36                     3.19      0.17         5.3
Gearing                                                                        %                      35.0                     33.9                   1.1

Details about distribution components under the attribution managed investment trust or “AMIT” regime (only relevant for the full year distribution) and
Fund Payment amounts (only relevant for foreign holders) will be made available on Growthpoint’s website on or before the relevant distribution date.
For more information got to http://growthpoint.com.au/investor-centre/distributions/

Growthpoint Properties Australia Half Year Results Presentation for the six months ended 31 December 2018 | 21 February 2019                          24
Reconciliation from statutory profit to FFO.

                                                                                                     HY19                      HY18    Change     Change
                                                                                                      $’000                    $’000      $’000        %

Profit after tax                                                                                  188,757                207,291       (18,534)     (8.9)

Less non-FFO items:
- Straight line adjustment to property revenue                                                      (2,937)               (2,903)          (34)
- Net changes in fair value of investment property                                               (101,407)             (102,893)        (1,486)
- Profit on sale of investment property                                                                   0              (24,401)       24,401
- Net change in fair value of investment in securities                                              (2,370)               (6,517)        4,147
- Net change in fair value of derivatives                                                           (5,324)                4,177        (9,501)
- Depreciation                                                                                         147                      86          61
- Amortisation of incentives                                                                         9,247                 7,464         1,783
- Deferred tax benefit                                                                                 456                     172         284

FFO                                                                                                 86,569                82,476         4,093       5.0

Growthpoint Properties Australia Half Year Results Presentation for the six months ended 31 December 2018 | 21 February 2019                        25
Financial position.

                                                                                                                   as at 31 December 2018    as at 30 June 2018
                                                                                                                                     $’000                $’000

Assets
Cash and cash equivalents                                                                                                          40,955               31,463
Investment properties                                                                                                            3,815,575           3,291,800
Other assets                                                                                                                      136,008              151,306
Total assets                                                                                                                     3,992,538           3,474,569

Liabilities
Borrowings                                                                                                                       1,424,119           1,197,555
Distributions payable                                                                                                              82,963               75,643
Derivative financial instrument liabilities                                                                                          2,299               6,892
Other liabilities                                                                                                                  39,413               37,506
Total liabilities                                                                                                                1,548,794           1,317,596

Net assets                                                                                                                       2,443,744           2,156,973

Securities on issue (No.)                                                                                                      727,748,545         675,384,368
NTA per security ($)                                                                                                                 $3.36               $3.19
Balance sheet gearing (%)                                                                                                           35.0%                33.9%

Growthpoint Properties Australia Half Year Results Presentation for the six months ended 31 December 2018 | 21 February 2019                                26
Lease incentives.

Lease incentives for leasing completed in HY19 averaged 10% (26% office                                                                                                            Average lease incentives (%)
and 7% industrial). This includes fit-out, rent free, rental abatement and cash                                                                                                           HY18           HY19
payments.

Financial impact of lease incentives and leasing costs¹                                                                                                                                                        26            26
                                                                                                                                                                                    25
The impact of lease incentives on Growthpoint’s HY19 financial statements are:                                                                                                                                                            23

• Consolidated Cash Flow Statement
    –– Reduction in “cash generated by operating activities” by $20.2 million as incentives were
       paid2
• Consolidated Statement of Profit or Loss and Other Comprehensive Income
                                                                                                                                                                                                 10
    –– Reduction in “Property revenue” by $9.2 million due to the amortisation of tenant incentives
       granted                                                                                                                                                                                                                                       7
    –– Reduction in Net changes in fair value of investment properties by $20.7 million which
       represents the net value of tenant incentives recognised during the period
• Consolidated Statement of Financial Position
    –– Unamortised lease incentives of $72.2 million recognised within investment property as a                                                                                          Total                      Office                  Industrial

       reconciling item
    –– Unamortised leasing costs of $3.5 million3 recognised within investment property as a
       reconciling item
1. The financial impact includes all relevant historical impacts but not necessarily all future ones. For example, a cash payment would be captured here regardless of when a lease commences but rent free for a future period would not be captured until the
   relevant period.
2. Includes cash incentives and fit-out incentives only. Other non-cash tenant incentives provided for HY19 were rent abatement of $2.7 million and rent free incentives of $5.3 million. These two amounts form part of the unamortised lease incentives balance
   in the Consolidated Statement of Financial Position.
3. Includes establishment costs such as legal costs and agent fees.

Growthpoint Properties Australia Half Year Results Presentation for the six months ended 31 December 2018 | 21 February 2019                                                                                                                               27
Operating and capital expenses.

Operating expenses
                                                                                               CY18                CY17

Total operating expenses                                                   $'000              13,506              13,066
Average gross assets value                                                 $'000          3,526,881           3,295,858            Expected to
                                                                                                                                 remain around
Operating expenses to average gross assets                                     %                 0.38               0.40           0.40%
                                                                                                                                based on current
                                                                                                                                    portfolio
Capital expenditure
                                                                                               CY18                CY17

Total portfolio capex                                                      $'000               9,045              15,889
                                                                                                                                   Expected
Average property asset value                                               $'000          3,449,335           3,083,095           to average

Capital expenditure to average property portfolio value                        %                 0.26               0.52       0.3%-0.5%
                                                                                                                               over medium-term
                                                                                                                                based on current
                                                                                                                                    portfolio

Growthpoint Properties Australia Half Year Results Presentation for the six months ended 31 December 2018 | 21 February 2019                       28
Debt maturity profile ($m)
At 31 December 2018

      Bank debt             Institutional term loan      USPP        Bridge Facility   Undrawn bank debt

                                                                                                                      Bank debt /             Weighted
500
                                                                                                                     non-bank debt1          average debt
                                                                                 33                                                            maturity

400
                                                                61              217                                  61%/39%                 4.2yrs
                                                                404

300

200                                                                             250
                                                                                                       200
100                                   150         150
                                                                                                                           130
                                                                                                                                                   78
0
                  FY19                FY20        FY21          FY22            FY23       FY24        FY25   FY26         FY27       FY28        FY29

1. Includes drawn and undrawn facilities.

Growthpoint Properties Australia Half Year Results Presentation for the six months ended 31 December 2018 | 21 February 2019                                29
Target fixed/hedged debt 65% to 100%.
Weighted average fixed debt

                                                 Time          Fixed     Face value
Maturity date                               to maturity          rate      of Swap
                                                                                                 Weighted
Interest Rate Swaps (IRS)                                                                      average fixed
                                                                                                debt (term)
Jun-2020                                         1.5yrs       2.36%           $25m
Jun-2020                                         1.5yrs       2.36%           $25m             5.0yrs
Dec-2020                                         2.0yrs       2.42%           $50m
May-2021                                         2.4yrs       2.10%           $50m
Jun-2021                                         2.5yrs       2.48%           $50m
Jun-2021                                         2.5yrs       2.33%           $50m               Weighted
                                                                                               average fixed
Nov-2021                                         2.9yrs       2.20%           $75m              debt (rate)
Weighted Average IRS                             2.3yrs       2.30%          $325m
                                                                                                3.96%
Fixed Rate Debt Facilities (FRDF)
Mar-2025                                         6.2yrs       4.67%          $200m
Dec-2022                                         4.0yrs       4.39%           $90m
Dec-2022                                         4.0yrs       4.45%          $100m
Dec-2022                                         4.0yrs       4.40%           $60m
Jun-2027                                         8.5yrs       5.28%          $130m
Jun-2029                                        10.5yrs       5.46%           $52m
Jun-2029                                        10.5yrs       5.35%           $26m
Weighted Average FRDF                            6.3yrs       4.78%          $658m
Weighted Average Fixed Debt                      5.0yrs       3.96%          $983m
Debt fixed at 31 December 2018                    69%

Growthpoint Properties Australia Half Year Results Presentation for the six months ended 31 December 2018 | 21 February 2019   30
Portfolio overview –
Five year performance summary.
As at 31 December                                                                         2018            2017                  2016         2015         2014

Number of properties                                                           no.           59              56                    59          57           51
Total value                                                                   $m        3,860.8        3,285.0                 3,194.7     2,611.5      2,233.6
Occupancy                                                                       %            99              98                    99           97           98
HY like-for-like value change                                $m / % of asset value   163.4 / 4.9    124.6 / 4.0            59.6 / 2.2    77.0 / 3.2   95.2 / 4.5
Total lettable area                                                          sqm     1,038,683       1,003,529            1,065,623      1,085,041    1,023,681
Weighted average property age                                               years          10.7            10.1                    9.1         8.4          7.8
Weighted average valuation cap rate                                             %           6.0             6.4                    6.7         7.1          7.6
WALE                                                                        years           5.1             5.6                    6.3         6.6          6.5
WARR                                                                            %           3.3             3.3                    3.3         3.1          3.1
Average value (per sqm)                                                         $         3,717          3,273                  2,998        2,407        2,182
Average rent (per sqm, per annum)                                               $           256             239                   227          188          182
HY Net Property Income                   1
                                                                              $m          108.8          106.4                  113.5         87.4         85.4
Number of tenants                                                              no.          151             139                   144          108           93

1. Excludes distributions from equity related investments.

Growthpoint Properties Australia Half Year Results Presentation for the six months ended 31 December 2018 | 21 February 2019                               31
Leasing.
Leases completed in HY19
                                                                                                                                             Term     Annual rent    NLA Car      At 31 Dec 2018
Address                                                               Sector       Tenant                                       Start date    (yrs)    increases    (sqm) Parks
Building C, 211 Wellington Road Mulgrave                        VIC   Office       Huili Group P/L T/A The Taste Corner          Q1, FY19      5.0    Fixed 3.25%    145      2
102 Bennelong Parkway                        Sydney Olympic Park NSW Office        True Health Spines and Sports Chiropractic    Q1, FY19      3.0    Fixed 3.50%     69      1   Industrial portfolio
333 Ann Street
333 Ann Street
                                             Brisbane
                                             Brisbane
                                                                QLD
                                                                QLD
                                                                      Office
                                                                      Office
                                                                                   Terracom
                                                                                   Bluebook Insurance
                                                                                                                                 Q1, FY19
                                                                                                                                 Q2, FY19
                                                                                                                                               3.0
                                                                                                                                               5.0
                                                                                                                                                      Fixed 3.75%
                                                                                                                                                      Fixed 3.50%
                                                                                                                                                                      83
                                                                                                                                                                     218      1
                                                                                                                                                                                  99%
                                                                                                                                                                                  Occupied
109 Burwood Road                             Hawthorn           VIC   Office       Green Energy Trading                          Q2, FY19      7.0    Fixed 4.00%    518     10
                                                                                                                                                                                  Unit 1, 58 Tarlton
A1, 32 Cordelia Street                       South Brisbane     QLD   Office       Jacobs Group (Australia)                      Q2, FY19      7.9    Fixed 3.75%   1,311    11   Crescent, Perth Airport –
                                                                                                                                                                                  3,359 sqm available for
Building C, 211 Wellington Road Mulgrave                        VIC   Office       Endress & Hauser Australia                    Q2, FY19      7.0    Fixed 3.25%    362     10   lease
58 Tarlton Crescent                          Perth Airport      WA    Industrial   Perth Inflight Catering Services              Q2, FY19      1.0            n/a   1,013         Unit 4, 58 Tarlton
                                                                                                                                                                                  Crescent, Perth Airport –
333 Ann Street                               Brisbane           QLD   Office       Brisbane Education Services                   Q2, FY19      5.2    Fixed 3.25%    291          3,638 sqm available for
                                                                                                                                                                                  lease
75 Dorcas Street                             South Melbourne    VIC   Office       Mondelez Australia                            Q3, FY19      3.0    Fixed 3.75%    248
A1, 32 Cordelia Street                       South Brisbane     QLD   Office       Sabre Travel Network (Australia)              Q3, FY19      5.0    Fixed 3.75%    210      7
A4, 52 Merivale Street                       South Brisbane     QLD   Office       Topcon Positioning Systems (Aust)             Q3, FY19      7.3    Fixed 3.75%    622
A4, 52 Merivale Street                       South Brisbane     QLD   Office       Ramen Danbo Surfers Paradise                  Q3, FY19      5.0    Fixed 4.00%    108
                                                                                                                                                                                  Office portfolio
Weighted average / Total                                                                                                                       6.3          3.7%    5,198    42
                                                                                                                                                                                  98%
                                                                                                                                                                                  Occupied
Leases completed since 31 December 2018
                                                                                                                                             Term     Annual rent    NLA Car      CB1, Level 4, 22 Cordelia
Address                                                               Sector       Tenant                                       Start date    (yrs)    increases    (sqm) Parks   Street, South Brisbane –
                                                                                                                                                                                  1,382 sqm available for
                                                                                                                                                                                  lease
599 Main North Road                          Gepps Cross        SA    Industrial   Woolworths Limited                           Q4, FY201     15.0    Fixed 2.50% 67,238    520
                                                                                                                                                                                  Quads 2 & 3, Sydney
                                                                                                                                                                                  Olympic Park – six
Weighted average / Total                                                                                                                      15.0 Fixed 2.50% 67,238       520   vacancies across both
                                                                                                                                                                                  buildings
1. Estimated date of practical completion.

Growthpoint Properties Australia Half Year Results Presentation for the six months ended 31 December 2018 | 21 February 2019                                                                          32
Equity capital overview.

Market capitalisation and free float ($m)                                                           Location of Growthpoint                            Growthpoint
                                                                                                    Securityholders* (%)                               Securityholders* (%)
    Market Capitalisation                                                                           as at 31 December 2018                             as at 31 December 2018
    Free float                                                                    2,721.8
                                                                                                                11                                                        0.7
                                                                2,438.1                                                                                            8.0

                                              2,076.6                                                                                                  25.3
                                                                                                    16
              1,781.1           1,836.8

1,323.3
                                                                                                                                             73
                                                                                            925.4
                                                                          840.0                                                                                                          66.0
                                                        724.4
                        623.9         633.7                                                                 South Africa                                       GRT
      409.2                                                                                                 Australia                                          Institutional
                                                                                                            Rest of World                                      Retail
                                                                                                    * Figures are approximate and based on
                                                                                                                                                               Directors and Employees
  Jun 2014       Jun 2015        Jun 2016       Jun 2017          Jun 2018          Dec 2018        beneficial ownership.

                                                                                                    New securities issued in HY19
                                                                                                                                                    Number          Issue price            Value
                                                                                                                                                                                  $             $
                                                                                                    Employee incentive plan                         294,127                    3.84     1,129,448
                                                                                                    Equity raising                                39,023,227                   3.46   135,020,365
                                                                                                    Distribution Reinvestment plan                13,046,823                   3.58    46,707,774
                                                                                                    Total                                         52,364,177                          182,857,587

Growthpoint Properties Australia Half Year Results Presentation for the six months ended 31 December 2018 | 21 February 2019                                                                        33
Growthpoint Properties Limited – South Africa.1

Growthpoint Properties Limited of South Africa (“GRT”) owns 66.0% of                                         Key Facts (as at 30 June 2018)1
the securities of Growthpoint and is its major Security holder.
                                                                                                             Listing             GRT is listed on the Johannesburg Stock
Other information                                                  • Well capitalised and conservatively                         Exchange (JSE)
                                                                     geared
about GRT                                                                                                    Ranking on the      23 by market capitalisation
                                                                   • Best Practice corporate governance      JSE
• Included in the JSE Top 40 Index                                                                           Closing exchange    AUD:ZAR=10.16
                                                                   • Transparent reporting
• Top ten constituent of FTSE EPRA /                                                                         rate used
                                                                   • Dynamic and proven management
  NAREIT Emerging Index                                                                                      Market              R79.3 / AU$7.8bn
                                                                     track record
• Included in the FTSE/JSE                                                                                   capitalisation
                                                                   • Recipient of multiple sustainability,
  Responsible Investment Index,                                                                              Gross assets        R132.9bn / AU$13.1bn
                                                                     governance and reporting awards
  FTSE4Good Index and the Dow                                                                                Net assets          R83.2bn / AU$8.2bn
  Jones Sustainability Index                                       • Baa3 global scale rating from
                                                                     Moody’s                                 Gearing (SA only)   35.4%
• Underpinned by high-quality,
  physical property assets, diversified                                                                      Distributable       R6.1bn / AU$612m (for the 12 month using an
  across sectors (Retail, Office and                               As of 30 June 2018                        Income              average exchange rate of R9.97 / AUD)
  Industrial) and geography (South                                 Growthpoint represents:                   ICR (SA only)       3.6 times
  Africa, Australia, Poland and                                                                              No. of employees    610
  Romania)                                                         • 18.2% of GRT’s gross property           (SA only)
                                                                     assets
• 15-year track record of                                                                                    Properties          455 properties in South Africa, including 50%
  uninterrupted dividend growth                                    • 16.6% of GRT’s net property                                 ownership of the prestigious V&A Waterfront.
                                                                     income                                                      47 Properties in Eastern Europe, 20 in Romania
• Sustainable quality of earnings that                                                                                           and 27 in Poland, through its 29% holding of
  can be projected with a high degree                              • 14.2% of GRT’s total distributable
                                                                                                                                 AIM listed Globalworth Real Estate Investments
  of accuracy                                                        income                                                      Ltd and its 21.6% holding of Warsaw listed
                                                                                                                                 Globalworth Poland Real Estate N.V.

1. All information supplied by GRT (figures as at 30 June 2018).

Growthpoint Properties Australia Half Year Results Presentation for the six months ended 31 December 2018 | 21 February 2019                                               34
Board of Directors.
                                                       1. Geoffrey Tomlinson (71)                3. Maxine Brenner (56)                    5. Grant Jackson (52)                 7. Norbert Sasse (54)
                                                       BEC                                       BA, LLB                                   Assoc. Dip. Valuations, FAPI          BCom (Hons) (Acc), CA (SA)
                                                       Independent Chairman (since               Independent Director (since               Independent Director (since           Director4 (since 5 August 2009)
                                                       1 July 2014) and Director (since          19 March 2012)                            5 August 2009)                        Over 23 years’ experience in
                                                       1 September 2013)                         Maxine has over 28 years’                 Over 32 years’ experience in the      corporate finance and over
                                                       Over 46 years’ experience in the          experience in corporate advisory,         property industry, including 29       15 years’ experience in the listed
                                                       financial services industry.              mergers and acquisition, financial        years as a qualified valuer.          property market.
                     1                         2
                                                       Committees: Audit, Risk &                 and legal advisory work.                  Committees: Audit, Risk &             Committees: Nomination,
                                                       Compliance and Nomination,                Committees: Audit, Risk &                 Compliance                            Remuneration & HR (Chair)
                                                       Remuneration & HR                         Compliance (Chair)                        Current Australian directorships of   Current Australian directorships of
                                                       Current Australian directorships          Current Australian directorships          listed public companies1: Nil         listed public companies: Nil
                                                       of listed public companies1: IRESS        of listed public companies1: Orica
                                                       Limited                                   Limited, Origin Energy Limited and        6. Francois Marais (64)               8. Josephine Sukkar AM (55)
                                                                                                 Qantas Airways Limited
                                                                                                                                           BCom, LLB, H Dip (Company Law)        BSc (Hons), Grad Dip Ed
                                                       2. Timothy Collyer (50)
                                                                                                                                           Director (since 5 August 2009)
                                                                                                                                                   3
                                                                                                                                                                                 Independent Director (since
                                                       B.Bus (Prop), Grad Dip Fin & Inv,         4. Estienne de Klerk (49)
                                                                                                                                           Over 28 years’ experience in the      1 October 2017)
                     3                          4      AAPI, F Fin, MAICD                        BCom (Industrial Psych), BCom
                                                                                                 (Hons) (Marketing), BCom (Hons)           listed property market.               Over 29 years’ experience in the
                                                       Managing Director (since 12 July
                                                                                                 (Acc), CA (SA)                            Committees: Nomination,               construction industry.
                                                       2010)
                                                                                                                                           Remuneration & HR                     Committees: Nomination,
                                                       Over 30 years’ experience in              Director2 (since 5 August 2009)
                                                                                                                                           Current Australian directorships of   Remuneration & HR
                                                       A-REITs and unlisted property             Over 22 years’ experience in              listed public companies: Nil          Current Australian directorships of
                                                       funds, property investment,               banking and property finance and                                                listed public companies: Nil
                                                       development and valuations.               over 17 years’ in the listed property
                                                       Current Australian directorships of       market.
                                                       listed public companies1: Nil             Committees: Audit, Risk &
                     5                         6
                                                                                                 Compliance
                                                                                                 Current Australian directorships of
                                                                                                 listed public companies: Nil

                                                       1. In addition to Group entities.
                                                       2. Not deemed independent as South African CEO of Growthpoint Properties Limited (GRT).

                     7                          8
                                                       3. Not deemed independent as Chairman of GRT.
                                                       4. Not deemed independent as Group CEO of GRT.

Growthpoint Properties Australia Half Year Results Presentation for the six months ended 31 December 2018 | 21 February 2019                                                                                   35
2019 Securityholder calendar.*

21 February 2019                                               30 August 2019
• Results for the half year ended 31 December                  • Distribution paid for the half year ending 30 June
  2018 announced to ASX                                          2019
                                                               • FY19 Annual Report sent to Securityholders
28 February 2019
• Distribution paid for the half year ending 31                31 October 2019
  December 2018
                                                               • Investor Update released to ASX

4 March 2019                                                   21 November 2018
• HY19 interim report sent to Securityholders
                                                               • Annual General Meeting

1 May 2019
• Investor Update released to ASX

22 August 2019
• Results for the full year ended 30 June 2019
  announced to ASX

* Dates indicative and subject to change by the Board.

Growthpoint Properties Australia Half Year Results Presentation for the six months ended 31 December 2018 | 21 February 2019   36
Glossary of terms.
A-REIT Australian Real Estate Investment Trust                    FY15, FY16, FY17 and FY18 the 12 months ended on 30                  NTA net tangible assets
                                                                  June in the year listed i.e. “FY18” means the 12 months ended
ASX Australian Securities Exchange                                                                                                     m million
                                                                  30 June 2018
bn billion                                                                                                                             MW megawatt
                                                                  FY19, FY20, FY21, FY22 and FY23 the 12 months ending
Baa2 a debt rating issued by Moody’s equivalent to BBB issued     on 30 June in the year listed i.e. “FY19” means the 12 months        MER management expense ratio comprising all the Group’s
by S&P. The Moody’s system runs from highest to lowest Aaa        ending 30 June 2019                                                  costs other than interest divided by the average gross assets for
Aa A Baa Ba B Caa Ca C with the numbers 1-3 denominating                                                                               the year
                                                                  freefloat securities considered available for trading on the ASX.
modifiers of this rating i.e. Baa2 is higher than Baa3 or Ba1.
                                                                  For Growthpoint, this is the market capitalisation less securities   REIT real estate investment trust
bps one hundredth of one percentage point (used chiefly in        held by GRT in accordance with S&Ps released guidelines
                                                                                                                                       Securityholder an owner of Growthpoint securities
expressing differences of interest rates)
                                                                  Gearing interest bearing liabilities less cash divided by total
                                                                  assets less cash                                                     S&P Standard & Poor’s
Board the board of directors of the Company
                                                                  GOZ the ASX trading code that Growthpoint trades under               sqm square metres
CAGR compound annual growth rate
                                                                  Growthpoint or the Group Growthpoint Properties Australia            Trust Growthpoint Properties Australia Trust
CY17, CY18 the calendar year ended 31 December in the year
listed i.e. “CY18” means the calender year ended 31 December      comprising the Company, the Trust and its controlled entities        USPP United States Private Placement
2018
                                                                  Growthpoint SA or GRT Growthpoint Properties Limited of              WADM weighted average debt maturity
Capex capital expenditure                                         South Africa (Growthpoint’s majority Securityholder) which
                                                                  trades on the JSE under the code “GRT”                               WALE weighted average lease expiry
Cap rate in full, “capitalisation rate”. Refers to the market
income produced by an asset divided by its value or cost          ICR Interest coverage ratio                                          WARR weighted average rent review

Company Growthpoint Properties Australia Limited                  IRR internal rate of return. Provides the annual return of a
                                                                  property before gearing and corporate costs
CPI consumer price index
                                                                  JSE Johannesburg Stock Exchange
cps cents per security
                                                                  kW kilowatt
dps distribution per security
                                                                  NABERS National Australian Built Environment Rating System
DRP Distribution Reinvestment Plan                                (a national system for measuring environmental performance of
Funds From Operations (FFO) the net profit available              buildings)
for distribution from the Group which excludes accounting         NLA net lettable area
adjustments such as fair value movements to the value of
investment property, investment in securities and interest rate   NPI Net Property Income plus distributions from equity related
swaps, depreciation, profits or losses on sale of investment      investments
properties, deferred tax and amortisation of tenant incentives.

Growthpoint Properties Australia Half Year Results Presentation for the six months ended 31 December 2018 | 21 February 2019                                                                      37
Important information.
Disclaimer                                                                        as amended. These measures include Funds From Operations (FFO), FFO             invested. Growthpoint does not guarantee any particular rate of return or the
This presentation and its appendices (“Presentation”) is dated February           per security, distributions per Security, Gearing, net tangible assets, net     performance of Growthpoint nor do they guarantee the repayment of capital
2019 and has been prepared by Growthpoint Properties Australia Limited            tangible assets per Security, EPS yield, DPS yield, capitalisation rates and    from Growthpoint or any particular tax treatment. You should have regard to
ACN 124 093 901 (both in its capacity as responsible entity of Growthpoint        distribution yield. The disclosure of such non-GAAP financial measures          the risks outlined in this Presentation.
Properties Australia Trust ARSN 120 121 002 and in its own capacity). Units       in the manner included in this Presentation would not be permissible in a
                                                                                  registration statement under the U.S. Securities Act of 1933, as amended        Past Performance
in Growthpoint Properties Australia Trust are stapled to shares in Growthpoint
Properties Australia Limited and, together form Growthpoint Properties            (“Securities Act”). Growthpoint believes these non-IFRS financial information   Past performance information given in this Presentation is given for illustration
Australia (“Growthpoint”). By receiving this Presentation, you are agreeing to    and non-GAAP financial measures provide useful information to users in          purposes only and should not be relied upon as (and is not) an indication of
the following restrictions and limitations.                                       measuring the financial performance and conditions of Growthpoint. The          future performance. Actual results could differ materially from those referred
                                                                                  non-IFRS financial information and non-GAAP financial measures do not           to in this Presentation.
Summary Information                                                               have a standardised meaning prescribed by Australian Accounting Standards
                                                                                  and, therefore, are not measures of financial performance, liquidity or value   Not an Offer
This Presentation contains summary information about Growthpoint. The
information is subject to change without notice and does not purport to           under the IFRS or U.S. GAAP and may not be comparable to similarly titled       This Presentation is not an offer or an invitation to acquire new Securities
be complete or comprehensive. It does not purport to summarise all                measures presented by other entities, nor should they be construed as           or any other financial products and is not a prospectus, product disclosure
information that an investor should consider when making an investment            an alternative to other financial measures determined in accordance with        statement or other offering document under Australian law or any other law.
decision. It should be read in conjunction with Growthpoint’s other periodic      Australian Accounting Standards. Investors are cautioned, therefore, not to     It is for information purposes only. This Presentation may not be distributed
and continuous disclosure announcements lodged with the ASX, which are            place undue reliance on any non-IFRS financial information or non-GAAP          or released in the United States. This Presentation does not constitute an
available at www.asx.com.au.                                                      financial measures and ratios included in this Presentation.                    offer to sell, or the solicitation of an offer to buy, any securities in the United
                                                                                  In addition, this Presentation contains some pro forma financial information.   States.
The information in this Presentation has been obtained from or based on
sources believed by Growthpoint to be reliable. To the maximum extent             The pro forma financial information does not purport to be in compliance with   Neither the Securities nor any other securities of Growthpoint have been,
permitted by law, Growthpoint, and its affiliates, officers, employees, agents    Article 11 of Regulation S-X of the Rules of the U.S. Securities and Exchange   nor will be, registered under the Securities Act or under the securities laws
and advisors do not make any warranty, express or implied, as to the              Commission.                                                                     of any state or other jurisdiction of the United States. Securities may not be
currency, accuracy, reliability or completeness of the information in this                                                                                        offered, or sold, directly or indirectly, (i) inside the United States, except in a
                                                                                  Future Performance                                                              transaction exempt from, or not subject to, the registration requirements of
Presentation and disclaim all responsibility and liability for the information
(including, without limitation, liability for negligence).                        This Presentation contains “forward-looking” statements. Forward-looking        the Securities Act and any applicable securities laws of any state or other
                                                                                  statements can generally be identified by the use of forward-looking words      jurisdiction of the United States or (ii) outside the United States to investors
Not Financial Product Advice                                                      such as “anticipated”, “expected”, “projections”, ‘guidance’, ‘forecast”,       that are not “U.S. persons” (as defined in Rule 902 under the Securities
This Presentation is not financial product advice or a recommendation to          “estimates”, “could”, “may”, “target”, “consider”, and “will” and other         Ac) in compliance with Regulation S under the Securities Act. None of
acquire Growthpoint stapled securities (“Securities”). It has been prepared       similar expressions and include, but are not limited to, earnings and           the Securities, any other securities of Growthpoint or this Presentation has
without taking into account any investor’s objectives, financial situation or     distributions guidance, change in NTA, and expected gearing. Forward            been approved or disapproved as to form, content, accuracy, adequacy or
needs. Therefore, before making an investment decision, investors should          looking statements, opinions and estimates are based on assumptions and         completeness by the Securities and Exchange Commission or the securities
consider the appropriateness of the information in this Presentation and have     contingencies which are subject to certain risks, uncertainties and change      regulatory authority of any state or other jurisdiction of the United States.
regard to their own objectives, financial situation and needs. Investors should   without notice, as are statements about market and industry trends, which       By attending the presentation to which this Presentation relates or by
seek such financial, legal or tax advice as they deem necessary or consider       are based on interpretations of current market conditions.                      viewing this Presentation you will be taken to have represented, warranted
appropriate for their particular jurisdiction. Growthpoint Properties Australia   Forward-looking statements including projections, indications or guidance on    and undertaken that (i) if you are inside the United States, you are either (x)
Limited is not licensed to provide financial product advice.                      future earnings or financial position and estimates are provided as a general   an institutional “accredited investor” (within the meaning of Rule 501(a)(1),
                                                                                  guide only and should not be relied upon as an indication or guarantee          (2), (3) or (7) under the Securities Act) or (y) a dealer or other professional
Financial Information                                                             of future performance. Should one or more of the risks or uncertainties         fiduciary organized, incorporated or (if an individual) resident in the United
All information is in Australian dollars. Investors should note that this         materialize, or should underlying assumptions prove incorrect, there can        States that is acting for an account (other than an estate or trust) held for
Presentation contains pro forma historical financial information. The pro         be no assurance that actual outcomes will not differ materially from these      the benefit or account of persons that are not “U.S. persons” (as defined in
forma historical financial information included in this Presentation does         statements. To the fullest extent permitted by law, Growthpoint and its         Rule 902 under the Securities Act) for which you have, and are exercising,
not purport to be in compliance with Article 11 of Regulation S-X of the          directors, officers, employees, advisers, agents and intermediaries disclaim    investment discretion; (ii) if you are outside the United States, you are not a
rules and regulations of the U.S. Securities and Exchange Commission.             any obligation or undertaking to release any updates or revisions to the        U.S. person; (iii) you have read and agree to comply with the contents of this
Investors should also be aware that certain financial data included in this       information to reflect any change in expectations or assumptions.               notice; and (iv) you will treat and safeguard as strictly private and confidential
Presentation is “non-IFRS financial information” under ASIC Regulatory Guide      An investment in the Securities and the outcome of the matters referred to      this Presentation and its contents and any comments made during the
230 Disclosing non-IFRS financial information published by the Australian         in forward-looking statements are subject to investment and other known         presentation and take all reasonable steps to preserve such confidentiality.
Securities and Investments Commission (“ASIC”) and “non-GAAP financial            and unknown risks, some of which are beyond the control of Growthpoint,
measures” under Regulation G of the U.S. Securities Exchange Act of 1934,         including possible delays in repayments and loss of income and principal

Growthpoint Properties Australia Half Year Results Presentation for the six months ended 31 December 2018 | 21 February 2019                                                                                                                   38
Contact details:

                                Retail Investors:
                                Computershare Investor Services Pty Limited,
                                GPO Box 2975, Melbourne VIC 3001 Australia
                                Phone (within Australia): 1300 850 505
                                Phone (outside Australia): +61(0)3 9415 4000
                                Fax: +61(0)3 9473 2500
                                Email: webqueries@computershare.com.au

                                Institutional Investors:
                                Daniel Colman – Investor Relations Manager
                                Email: info@growthpoint.com.au
                                Investor services line: 1800 260 453

                                Growthpoint Properties Australia
                                Level 31, 35 Collins Street
                                Melbourne VIC 3000
                                www.growthpoint.com.au

333 Ann Street, Brisbane, QLD
You can also read