OPTIMIZING SHAREHOLDER VALUE - OCTOBER 2021 PAREX RESOURCES INC.
←
→
Page content transcription
If your browser does not render page correctly, please read the page content below
PAREX RESOURCES INC.

OPTIMIZING SHAREHOLDER VALUE
OCTOBER 2021

                               CORPORATE PRESENTATION | OCTOBER 2021   1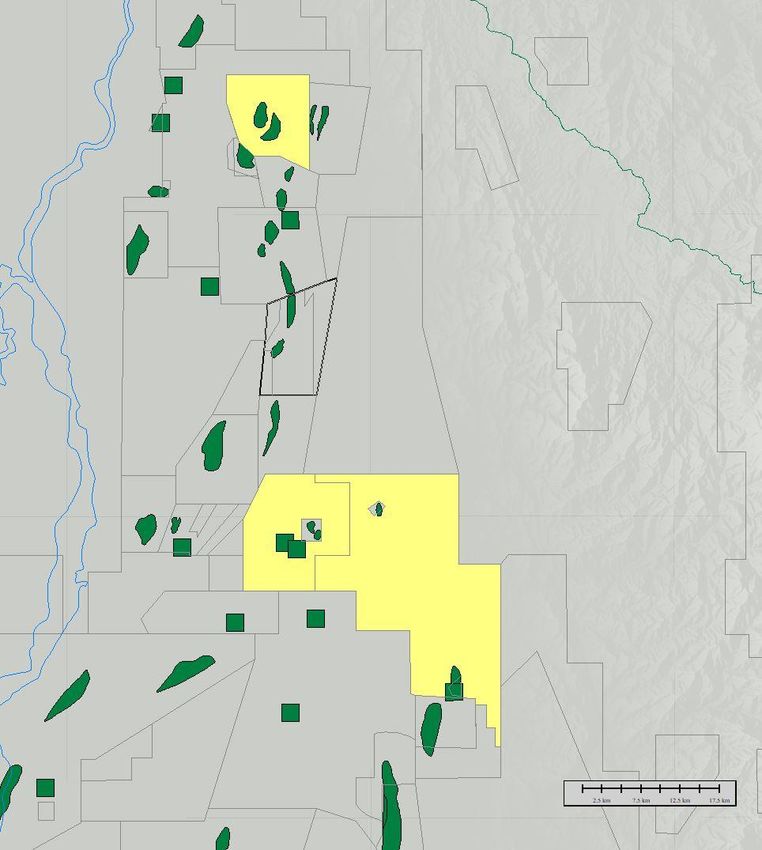
WHO IS PAREX?
Parex is a Calgary based company that focuses on sustainable, profitable, conventional
                               oil and gas production.

   Parex is committed to developing energy
  resources in a manner that is economically,
 environmentally and socially sustainable as it
 builds a portfolio of drilling opportunities and
   advances its exploration and development
   program to evolve into the leading LATAM
          independent E&P company.

                                                         CORPORATE PRESENTATION | OCTOBER 2021   2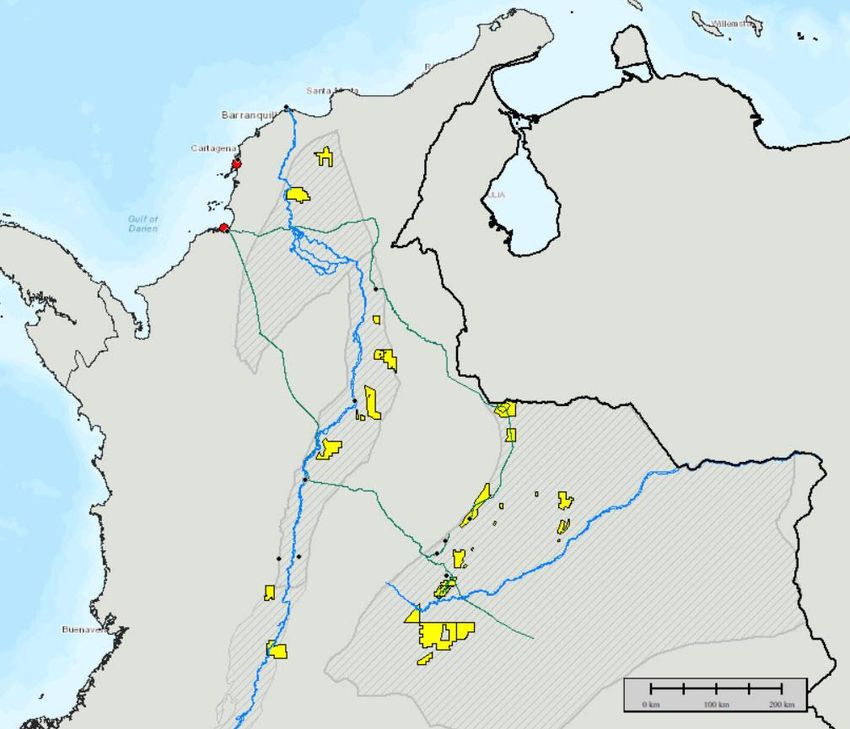
CORPORATE SNAPSHOT                                                                                                                            Capital Structure
 Operating Results                                                                                                         2020    H1 2021                       Cash - US$ million(3)

 Brent ($/bbl)                                                                                                            $43.30   $65.23                            ~$371
 Production (boe/d)                                                                                                       46,518   45,332               Net Working Capital - US$ million(3)

 DAPS Growth(1)                                                                                                            -3%       2%                              ~$352
 FCF Yield (%)                                                                                                             9%        8%                US$200 MM Undrawn Credit Facility(3)

 Capital Expenditures – US$ MM                                                                                            $141      $84                           No Debt
                                                                                                                                                                   Dividend Yield(4)
 Funds Flow Provided by Operations – US$ MM                                                                               $297      $257
 Free Funds Flow – US$                                                                                                    $156      $172
                                                                                                                                                                       2.5%
                                                                                                                                                               Market Capitalization(5)
 Shares Repurchased – MM shares                                                                                            13.9      7.7
                                                                                                                                                           ~C$2.4 Billion
 Reserves (2020 Year-End)
                                                                                                                                                       Common Shares Basic Outstanding(5)
 2P Reserves (Dec. 31)(2) – Mmboe                                                                                          195        -                          (TSX: PXT)

 2P Reserve Life Index – years                                                                                             11         -                         122.5 MM
(1) Debt-adjusted production per share (“DAPS”) growth.
(2) Parex’ WI per the independent reserve report prepared by GLJ Petroleum Consultants (“GLJ”) effective Dec. 31, 2020.
                                                                                                                                                                Shares Repurchased(6)

                                                                                                                                                               C$831 MM
(3) As at June 30, 2021.
(4) Estimated annual dividend yield using C$20/sh price.
(5) As at August 31, 2021
(6) As at Sep 23, 2021, shares repurchased is since October 15, 2017.
See “Advisories” at the end of this presentation

                                                                                                                                             CORPORATE PRESENTATION | OCTOBER 2021             3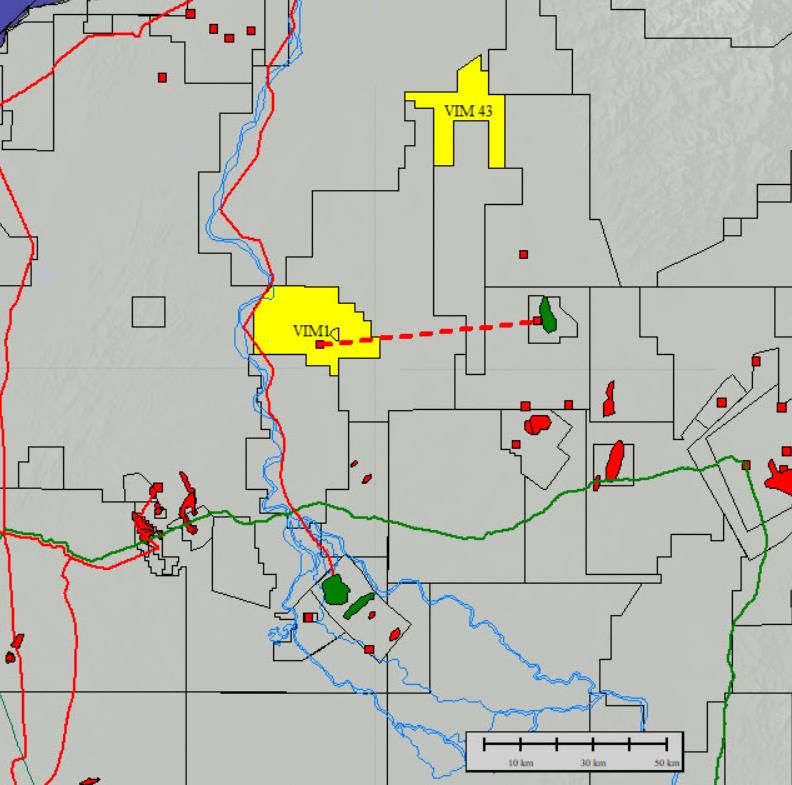
PAREX’ STRATEGY: BUILDING A BALANCED PORTFOLIO

                                                                                                                        Uncompromised Commitment
Disciplined Capital Allocation          Sustainable Business Model               Investigate New Core Areas                  to ESG Excellence

                                                                                                                           Advancement of key ESG initiatives
    Profitable reserves conversion       Validating Colombian discoveries       Leveraging existing core competencies          ESG governance structure
        Optimizing decline rates        Acceleration of exploration portfolio     Complement Colombian portfolio         Enhancement of inclusion and diversity
Significant Free Cash Flow generation      Long-term profitable growth                                                                 strategy
                                                                                                                            Technology to reduce emissions
                       Parex has a 360-degree approach: Embracing Communities, Environment, and Stakeholders

                                                                                                          CORPORATE PRESENTATION | OCTOBER 2021               4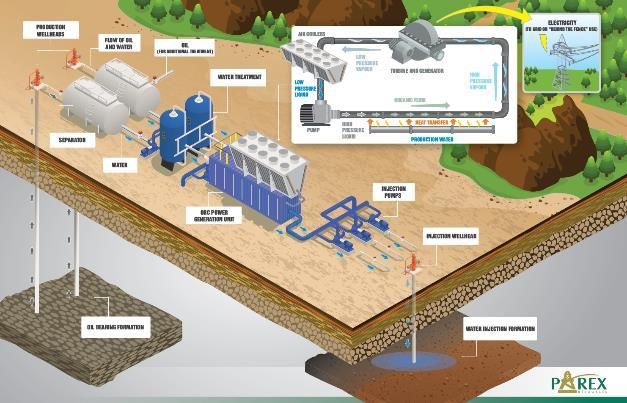
CURRENT ESG PRIORITIES

Environment                                         Social                                                Governance

                                                             Water for All - increase community
       Introduce GHGs emissions                                                                                          2023 diversity target —
       reductions targets (July 2021)                        access to clean water                                       30% women on the Board

       Invest in geothermal and solar energies to
                                                             Clean Energy Program —                                     30% of 2021 variable compensation
       lower carbon footprint                                improve community access to
       from operated fields’ power generation                                                                           linked to ESG metrics
                                                             electricity using renewables sources

       Reduction of GHG emissions                            Provide on-going community support                         Transparency reporting
       intensity rate year-over-year                         during the Pandemic                                        through TCFD Recommendations & SASB
                                                                                                                        Standards

       Biodiversity Protection —                                                                                        Shareholder return through
       trees planting, repopulation of vulnerable            Corporate diversity      & inclusion plan                  buybacks & dividends
       turtles & protection of forests

                                                                                                    CORPORATE PRESENTATION | OCTOBER 2021                 5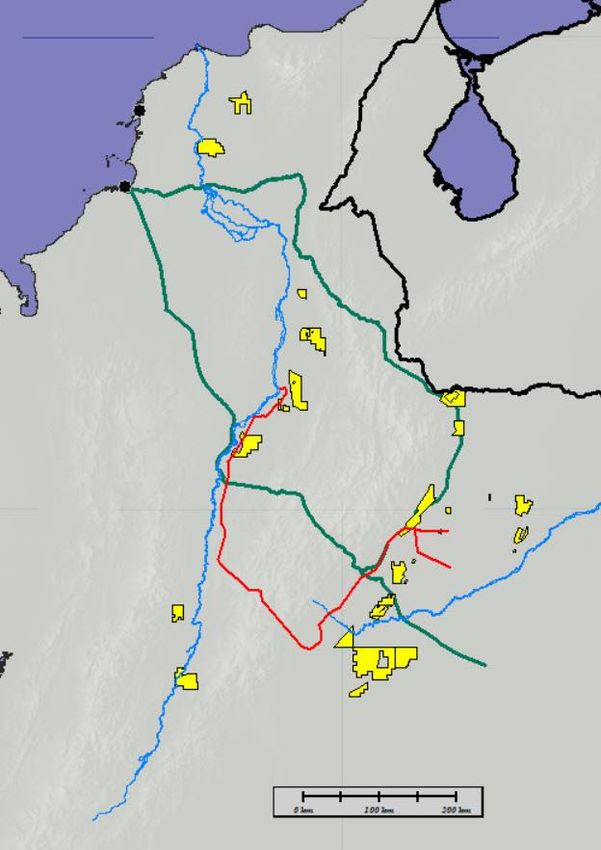
ESG PERFORMANCE – 2020 HIGHLIGHTS & RATINGS(1)(2)

            Environment                                                                                Social
                                                                                                                                                                                                                   ESG Risk Rating – 28.5
23% reduction in scopes 1 & 2 GHG emissions intensity                              Strong safety records – improvements in LTI (↓93%)                                                                         th
                                                                                                                                                                                                            (6 percentile among E&Ps, 1=lowest risk)
to 23 Kg CO2e/boe from 30 Kg CO2e/boe in 2019                                      and TRIF (↓93%) since 2017

                                                                                   Over 12,706 people gained access to clean water
67,124 Mt CO2e emissions avoided
                                                                                   through Parex’ water initiatives

Displaced ~5% of Las Maracas’ fossil fuel based                                    US$4.6MM invested to improve access to water,
energy with geothermal energy power generation                                     education, better housing, and infrastructure
                                                                                                                                                                                                            2020 Climate Change Score B
                                                                                                                                                                                                            2020 Water Security Score B-
Governance
                                                                             Diversity – 30% of directors being women by 2023
                                                                                                                                                                                                    ISS Quality Score Ratings
                                                                                      Oversight of ESG matters, including climate-related risks                                                     Environment: 2 / Social: 1 / Governance: 3
Diversity                                                                                                                                                                                                  (Decile rating, 1= leadership in managing ESG risk)

                                                                                        Experienced & diverse Board

Independence                                                                            100% independent committees’ chair and members

   WOMEN
                                                                                      Compensation aligned with shareholders’ interest – 98%
   MEN
                                                                                      votes for on say-on-pay at the 2021 AGM
   INDEPENDENTS
   NON-INDEPENDENTS                                                              7-year track record of progressing sustainability disclosure

                            (1) Ratings on October 1, 2021
                                                                                                                                                                                             CORPORATE PRESENTATION | OCTOBER 2021                               6
                            (2) The use by Parex of ESG ratings/data/logo do not constitute a sponsorship, endorsement, recommendation, or promotion of the Company by the rating agencies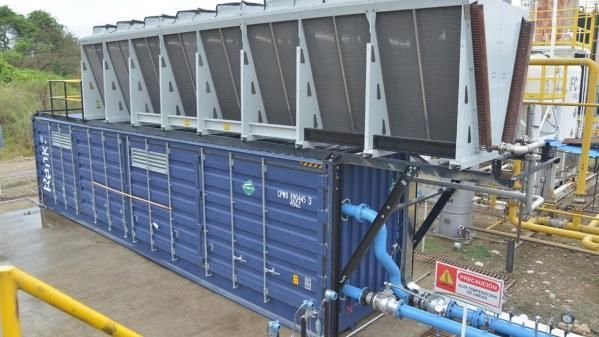
BUILDING A SUSTAINABLE LOW CARBON FUTURE
                        Parex aspires to become one of the least carbon intensive E&P companies
                 35                                                                                                               Reduce Scopes 1 & 2 GHG
                 30
                                           Zero routine
                                         flaring by 2025
                                                                                                                                  emissions intensity from
                                                                                                                                  operated assets by:
                 25
                                                        Reduce operated                                                           o Reducing flaring volumes,
                                                        assets’ scopes 1 &
KG CO2E/BOE(1)

                 20
                                                         2 GHG emissions
                                                         intensity by 50%
                                                                                                                                  o Achieving operational
                                                          by 2030 from a
                                                           2019 baseline
                                                                                                                                    efficiencies,
                 15
                                                                                                                                  o Displacing carbon intensive
                 10                                                                                                                 fuels; and
                                                                                                                                  o Increasing power generation
                 5
                                                                                                                       Net-zero
                                                                                                                                    from renewables.
                                                                                                                       ambition
                 0
                      2019 2020 2021T           2025             2030              2035              2040       2045    2050

                                        (1) Scopes 1 & 2 GHG emissions intensity per boe from operated assets                                                              7
                                                                                                                                   CORPORATE PRESENTATION | OCTOBER 2021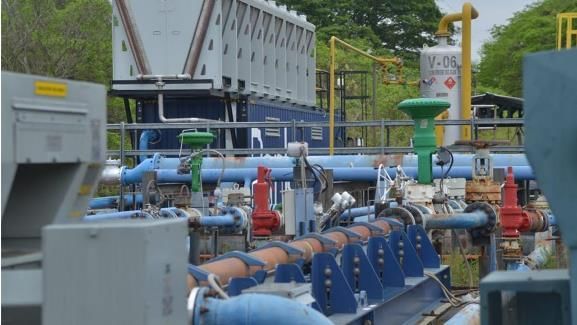
EMISSION FREE GEOTHERMAL ENERGY POWERS PAREX PRODUCTION
  Parex installed Colombia’s first geothermal power unit that captures the heat from hot water by-product from oil production. The
first pilot unit is on the Las Maracas’ field and the second pilot unit is anticipated to be completed in September 2021 on the Rumba
     field. The project aims to produce approximately 100kW of energy, replacing the fossil-fuel derived power in the pilot fields.

                                          Benefits of the Geothermal Unit:
                        • Offset emissions – displace higher carbon intensive energy sources
                        • Modular design, therefore scalable and portable
                        • Smaller footprint compared to solar & wind

               Parex is committed to building a sustainable low carbon future
                                                                                        CORPORATE PRESENTATION | OCTOBER 2021    8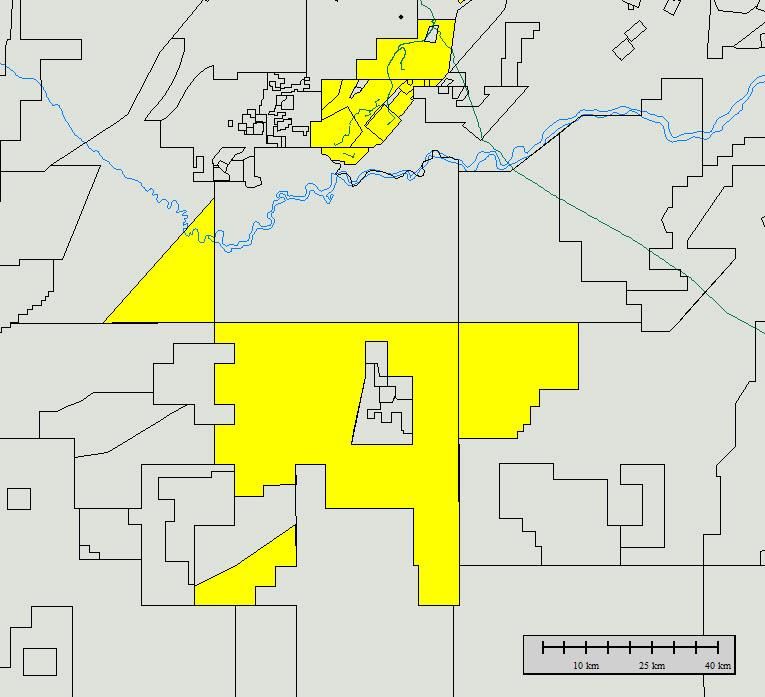
CAPITAL ALLOCATION – OPTIONS TO GROW SHAREHOLDER RETURNS
                Industry leading Cash Flow generation provides optionality for:
                                    o Resilient Dividend Program
                                           o Growth Capex
                                      o Flexible Share Buy-Back
         $600

                                                                         Optionality
                   $75/bbl
         $500                                                                              ~$150-$250
                   $65/bbl
         $400
USD MM

         $300
                   $55/bbl
                                                                                       Remaining FFO provides
         $200
                    Brent                             ~$275-300                        optionality for:
         $100                                                                          • Additional growth (CAPEX)
                                                                                       • Share repurchases
           $0
                                      ~$50
                     FFO             DIVIDENDS           CAPEX                               REMAINING FFO

                                                                 CORPORATE PRESENTATION | OCTOBER 2021               9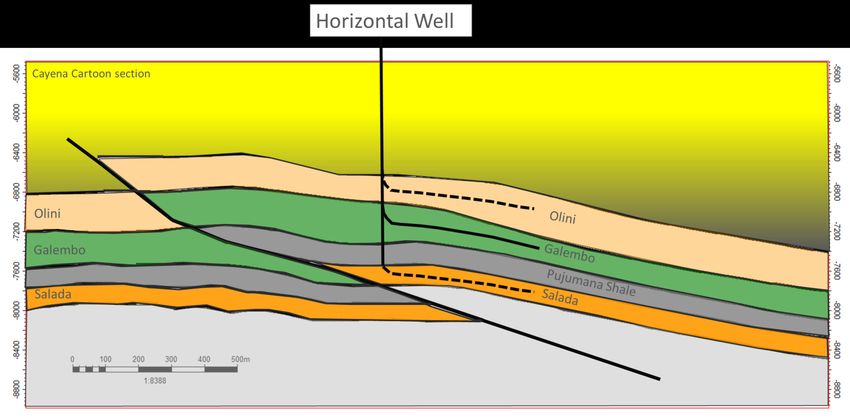
WHY INVEST IN PAREX?
DEBT-ADJUSTED PRODUCTION PER SHARE (DAPS)
PPS DAPS Share Price (QE)
1. No Debt & Positive Q2’21 Working Capital of US $352 MM 0.50 $25
2. High Margins
o Q2’21 operating netback → US $41.29/boe at Brent 0.40 $20
$69.08/bbl
BOE/D PER 1,000 SHARES
o Q2’21 FFO netback → US $32.02/boe
SHARE PRICE (C$)
0.30 $15
4. Capital Allocation Discipline
o Balanced capital program and return of capital 0.20 $10
5. Focused Shareholder Return
o Q2’21 CROIC (1) → 6.2% 0.10 $5
o Share buy-back funded from free cash flow
▪ 43.2 million common shares repurchased since 2017(2) 0.00 $0
Q4 2016
Q1 2019
Q2 2021
Q1 2016
Q2 2016
Q3 2016
Q1 2017
Q2 2017
Q3 2017
Q4 2017
Q1 2018
Q2 2018
Q3 2018
Q4 2018
Q2 2019
Q3 2019
Q4 2019
Q1 2020
Q2 2020
Q3 2020
Q4 2020
Q1 2021
▪ Plan to repurchase a total of 12.9MM shares in 2021
Source: Company’s data – June 30, 2021
Delivering Shareholder Value
(1) Cash return on invested capital calculated (CROIC), a non-GAAP measure, is calculated as EBITDA divided by average carrying value of exploration and evaluation assets and property, plant and equipment assets, excluding accumulated DD&A
(2) Shares repurchased from October 15, 2017 to September 23,, 2021.
CORPORATE PRESENTATION | OCTOBER 2021 10GROWTH OPPORTUNITIES – M&A CRITERIA
M&A is an option, not a requirement for Parex.
Conventional Oil Onshore/Shallow Clear Path to
& Gas Water Asset Growth
Compete Against
Transparent FX &
Colombia Project
Payment Regime
Returns
CORPORATE PRESENTATION | OCTOBER 2021 11DELIVERING CONSISTENT SHAREHOLDER VALUE
PRODUCTION PER SHARE (DEBT ADJUSTED)
RESERVE LIFE INDEX
18
500
BOE/MILLION WA BASIC SHARES
450 16
400 14
350 12
300 10
YEARS
250 8
200 6
150 4
100
2
50
0
-
2015 2016 2017 2018 2019 2020
2016 2017 2018 2019 2020 2021E PDP RLI 1P RLI 2P RLI 3P RLI
FUNDS FLOW PER BASIC SHARE PAREX VS. TSX ENERGY INDEX
FFO/SHARE Brent Oil Price PXT S&P/TSX Energy Index
FUNDS FLOW PER SHARE (USD)
$4.00 80 80%
BRENT OIL PRICE (USD/BBL)
$3.50 70
60%
$3.00 60
TOTAL RETURN
$2.50 50 40%
$2.00 40
20%
$1.50 30
$1.00 20 0%
$0.50 10 2016 2017 2018 2019 2020
-20%
$0.00 0
2015 2016 2017 2018 2019 2020 -40%
See “Advisories” at the end of this presentation
CORPORATE PRESENTATION | OCTOBER 2021 12STRONG RESERVE PER SHARE GROWTH
PDP RESERVES PER SHARE DEBT ADJUSTED 1P RESERVES PER SHARE DEBT ADJUSTED
0.8 140%
1.4
RESERVES (BOE/BASIC SHARE)
RESERVES (BOE/BASIC SHARE)
0.7 120%
1.2
0.6 100%
1.0
0.5
80%
0.8
0.4
60%
0.3 0.6
40%
0.2 0.4
20%
0.1 123% 27% 28% 49% 30% 24% 18% 0.2 34% 52% 33% 25% 7%
99% 13%
63% 84%
0.0 0%
0.0
2012 2013 2014 2015 2016 2017 2018 2019 2020 2012 2013 2014 2015 2016 2017 2018 2019 2020
2P RESERVES PER SHARE DEBT ADJUSTED
1.8
Strong Reserve Per Share Growth Supported By:
RESERVES (BOE/BASIC SHARE)
1.6
1.4 • Asset Performance
1.2
1.0 • Exploration Success
0.8
0.6
• Share Buy-Back Program
0.4
0.2 33%
0.0
112% 82% 18% 47% 19% 18% 14%
New Block Initially Added 7.8 Mmboe
2012 2013 2014 2015 2016 2017 2018 2019 2020
See “Advisories” at the end of this presentation
CORPORATE PRESENTATION | OCTOBER 2021 13INCREASING PRODUCTION WHILE RETURNING FCF TO SHAREHOLDERS
300 Production (MBOE/D) Current Shares Outstanding Working Capital Since 2017(1):
169% • Production increased by 35% (67% prior to
COVID-19 in Q1 2020).
250
• Working Capital increased from $131 MM to
$352 MM.
FACTOR OF 2017 BASE VALUES
o Debt Free since Q2 2015.
200
• Parex has reduced Shares Outstanding by
67% ~18%.
150 o Achieved through industry leading share
35% buy-back program.
o PXT has repurchased an aggregate of 41
100
million shares and has returned C$784
MM to shareholders since 2017 (2).
-18%
50
2017 2018 2019 2020 2021
Q1 Q2 Q3 Q4 Q1 Q2 Q3 Q4 Q1 Q2 Q3 Q4 Q1 Q2 Q3 Q4 Q1 Q2
(1) As of June 30, 2021. 14
CORPORATE PRESENTATION | OCTOBER 2021
(2) Shares repurchased from October 15, 2017 to July 31, 2021.INDUSTRY LEADING SHARE BUY-BACK PROGRAM
Parex Resources is committed to returning capital # Shares Bought Back Cost of Share Buybacks
to shareholders through the NCIB and share buy- 8 120
back program.
7
100
Since the first NCIB in 2017, PXT has repurchased
roughly 43 MM shares and has returned C$831 MM 6
to shareholders. 80
5
MILLION SHARES
CAD MILLION
Year # Shares Bought Back Capital Returned to 4 60
Shareholders
(C$ MM) 3
40
2017 576,600 $9
2
2018 2,745,580 $55
20
2019 14,679,474 $300 1
2020 13,851,994 $230
2021(1) 11,299,195 $237 2017 2018 2019 2020 2021
Total 43,152,843 C$831MM Q3 Q4 Q1 Q2 Q3 Q4 Q1 Q2 Q3 Q4 Q1 Q2 Q3 Q4 Q1 Q2
(1) As of October 23, 2021. 15
CORPORATE PRESENTATION | OCTOBER 2021PAREX FUNDS FLOW NETBACK(1)
$75 $71.59 $69.08
$70 $64.21
$65 $61.32
$60 $54.75 $12.41
$55
$50 $8.69
$43.30
$45 $6.70
$40 $2.88
USD/BOE
$35 $6.38
$30
$25
$20
$15
$10
$5
$22.29(2) $24.65(2) $29.61(2) $17.52(2) $29.98(2) $32.02(2)
$0
-$5
2017 2018 2019 2020 Q1 2021 Q2 2021
Cash Netback Tax G&A-Finance Opex Royalties Differential & Transportation Brent Price
(1) Funds flow netback is a non-GAAP measure that includes all cash generated from operating activities and is calculated before changes in non-cash working capital, divided by sales volumes for the period
(2) In Q2 2019, the Company changed how it presents funds flow provided by operations to present on a more comparable basis to industry presentation. Amounts have been restated for prior periods.
See “Advisories” at the end of this presentation
CORPORATE PRESENTATION | OCTOBER 2021 16INDUSTRY LEADING PROFITABILITY
Despite a year of volatility and record low oil prices, Parex was able to earn a positive net income and recorded
industry leading operating netbacks.
2020 Operating Netback(1)(2) 2020 Net Income for E&Ps with Market Cap > $1B(2)(3)
$25
$500
Parex
Parex $-
$20
$(500)
$15 $(1,000)
USD MM
USD/BOE
$(1,500)
$10
$(2,000)
$(2,500)
$5
$(3,000)
$- $(3,500)
(1) Companies included in peer group are: ARX, BTE, BIR, CNE, CPG, ERF, FEC, GPRK, GTE, NVA, POU, PEY, VII, VET (2) Values obtained from documents filed publicly by the peer group on their issuer profiles and Bloomberg on March 26, 2020.
(2) Values obtained from documents filed publicly by the peer group on their issuer profiles and Bloomberg on March 26, 2020. (3) Companies included in peer group are: ARX, CPG, CVE, EOG, ERF, FRU, MEG, PEY, POU, PSK, SU, TOU, VET, WCP
CORPORATE PRESENTATION | OCTOBER 2021 17CONVENTIONAL OIL RESERVES GENERATE VALUE
$9 $8.45
Proved Proved+ $8 $7.57 $7.58
$7.29
Developed Proved + Probable+
$7
2020YE Producing Proved Probable Possible
2P FD&A (USD/BOE)(1)
$6.15
FD&A USD/boe(1) $7.73 $12.33 $8.45 $4.02 $6
$5.03
$5
Recycle Ratio (FD&A)(1) 2.5x 1.6x 2.3x 4.8x
$4
After Tax NPV10% - C$/sh(2) $18.00 $27.64 $37.79 $50.95
$3
Working Capital – C$/sh(3) $3.11 $3.11 $3.11 $3.11
$2
NAV at Brent $65 Flat - C$/Sh(2) $21.11 $30.76 $40.90 $54.06 $1
(1) Per the independent reserve reports prepared by GLJ Petroleum Consultants Ltd. effective Dec. 31 of the reported year,
including Future Development Cost. Recycle Ratio is calculated using an estimated Q4 2020 Funds Flow From Operations.
$0
(2)
per barrel divided by annual F&D or FD&A as applicable.
At Parex’ request, the GLJ 2020 Report was calculated using a constant $65/bbl Brent oil price. 2018 2019 2020
(3) Working Capital of US$320 million and 131 million shares at December 31, 2020.
1 Year $/boe 3 Year $/boe
See “Advisories” at the end of this presentation
CORPORATE PRESENTATION | OCTOBER 2021 18FOUNDATION FOR LONG-TERM PRODUCTION: APPRAISE & DEVELOP
NET WORKING INTEREST PRODUCTION
(LLA-32, LLA-34 & Cabrestero)
50,000
40,000
30,000
BOE/D
20,000
10,000
0
2016 2017 2018 2019 2020
NET WORKING INTEREST RESERVES* - LAST 5 YEARS
(LLA -32, LLA -34 & Cabrestero)
250
RESERVES (MMBOE)
200
150
Faults
100 GLJ 3P (2020YE)
50 Pipeline
0
2016 2017 2018 2019 2020
1P 2P 3P
*Per the independent reserve reports prepared by GLJ Petroleum Consultants Ltd. effective Dec. 31 of the reported year.
See “Advisories” at the end of this presentation
Generation of Significant Free Cash Flow
CORPORATE PRESENTATION | OCTOBER 2021 19BUILDING A SUSTAINABLE BUSINESS – 2021 ACTIVITIES
VIM-43 VMM-46
Commence 3D seismic Acquisition of 215 sq km of 3D
seismic expected October 2021
VIM-1
Planadas-1 exploration well spud VIM-43 Fortuna
on July 30, 2021. Continuing to Drilling Perla Negra horizontal well testing
evaluate oil and CNG the Olini carbonate Formation
development plans for La Belleza
VIM-1 Capachos
Commenced permitting a 6 well drilling program
Boranda (3 appraisal wells & 3 exploration wells)
Drilling 1-2 appraisal wells
Fortuna
Boranda VMM-46 LLA-32
Commence drilling Groot
LLA-34 LLA-38 Arauca exploration well
Infill drilling & waterflood
expansion VMM-9 DeMares Capachos Cabrestero
4-6 well program – drilling
Merecure commenced June 2021
LLA-94
Drill Humea exploration well LLA-26 LLA-30 Parex has assembled a breadth of
LLA-34 LLA-32
VSM-25 inventory opportunities. Building
LLA-94 Cabrestero
Arauca on our world-class SoCa base, we
Entered into initial work plan with VSM-36 are accelerating our capital
Ecopetrol and the first of four LLA-134
wells planned to begin Q1 2022
investments to unlock the growth
CPO-11
chapter
CORPORATE PRESENTATION | OCTOBER 2021 20STRATEGIC PARTNERSHIP WITH ECOPETROL
• On Strategy: Partnership with Ecopetrol in Regional Arauca Map
the highly prolific Llanos Basin in Arauca
• Meaningful Portfolio Additions: Near
term, proven production potential and
reserves plus drill ready exploration prospects
and future exploration leads. Company 2P
Reserves(1) of 7.8 Mmboe
• Regional Expansion: Parex operated
Capachos asset (Ecopetrol partnered) is 40-km
south of LLA-38
• Near-term Catalyst: Parex as operator will
deliver an initial work plan with activity
beginning in 2021 and a continuous drill
program targeted in early 2022
CORPORATE PRESENTATION | OCTOBER 2021 21
(1) GLJ Ltd. Proved plus Probable Reserves As of January 1, 2021ASSET OVERVIEW – POTENTIAL FOR SUSTAINABLE DEVELOPMENT
Arauca Block & LLA-38 Map
Arauca Block – Reactivation, Existing Infrastructure
• Partially developed, proven light oil field
• Leveraging existing 3D seismic & infrastructure
accelerates timeline to production and cash flow
• High deliverability wells with historical initial
production rates between 1,800 – 4,000+ bbl/d from
the Barco formation
• Multiple pool extension/upside opportunities
LLA-38 – Drill Ready Exploration Prospect LLA38
• Califa-1 prospect, 3D seismic defined and technically
drill ready 3D Seismic
Pipelines
• Multiple 2D seismic defined leads waiting on Planned 3D
(outline approx.)
expanded 3D program to improve confidence and Infill well
Step-Out well
identify new targets Exploration well
Exploration lead
CORPORATE PRESENTATION | OCTOBER 2021 22
(1) GLJ Ltd. Proved plus Probable Reserves As of January 1, 2021VIM-1: LA BELLEZA DISCOVERY
Gas fields
VIM-1 (50% WI, Operator) Oil fields
• Main target is a Cienaga De Oro formation draped over Gas pipeline
Oil Pipeline
a basement high River
• Analogue fields at Cicuco, Boquete and El Dificil El Dificil Field
VIM-1 Discovered: 1943
• Advancing La Belleza discovery with civil works and
*Cum Production = 12 MMBO, 352 BCF
Basilea-1
long-lead items related to facilities Planadas-1 La Belleza
• Tested 2,696 bopd and 11.8 MMcf/d of gas (4,663
boe/d combined) La Creciente
• 43 API crude, selling at Brent less $5/Bbl Cicuco Field
Discovered: 1956
*Cum Production = 48 MMBO, 194 BCF
• Completing civil works on two new Boquete Field
Discovered: 1961
*Cum Production = 18.5 MMBO, 41 BCF
prospects, Basilea and Planadas as
Basilea-1
follow-up to the successful
exploration discovery La Belleza-1 La Belleza-1
Planadas-1
o Drilling program commenced Source: IHS Data
CORPORATE PRESENTATION | OCTOBER 2021 23
Note: Distances are approximate and from bottom hole location to bottom hole location.EXPANDING LLANOS INVENTORY
CPO-11 (50% WI, Operator) LLA-32
• Additional leads and prospects being evaluated LLA-34
• Shallow drilling targets testing stratigraphic prospects Cabrestero
LLA-94 (50% WI, Operator) LLA-94
• Multiple play types identified on 3D seismic data LLA-134
Rubiales
• Short turnaround time to drill ready due to existing data
• Humea exploration well to be drilled in 2H 2021 CPO-11
LLA-134 (100% WI, Operator)
• Targeting stratigraphic plays in the same reservoirs as
LLA-34
Apply key learnings from adjacent areas (Cabrestero and LLA-34)
CORPORATE PRESENTATION | OCTOBER 2021 24BORANDA & VMM-46
Boranda (50% WI, Operator)
• Exploration discovery at Boranda-1 Boranda
• Testing has begun on Boranda Sur Boranda-1
o In the process of testing multiple formations Boranda Centro-1
Boranda Sur-2
VMM-46
• Testing has started at the Boranda
Centro-1 appraisal location
• Producing at rate of ~600 bopd Boranda
• Drilling 1-2 appraisal wells
VMM-46 (100% WI, Operator) Boranda-1
• Acquired in Q4 2019 Boranda Centro-1
• Acquire 3D seismic on the block Boranda Sur-2
CORPORATE PRESENTATION | OCTOBER 2021 25
Note: Distances are approximate and from bottom hole location to bottom hole location.FORTUNA
Fortuna (100% WI, Operator)
Fortuna
• Acquired in Q4 2018
• No drilling since 2012
• Target conventional oil prospects in Lisama and La Luna
Formations Midas
(Acordianero)
• Acquired 3D seismic in 2019
• 2021 Plan: Drill 2 horizontal appraisal wells Boranda
• Drilled Cayena-1 exploration well into Galembo VMM-46
formation which has produced 74,700 bbls over 170
producing days
Cayena-1
• Next steps:
o Increase contact area with multi lateral or extended reach
technology
o Increase simulation capabilities
o Target low cost per foot of horizontal
CORPORATE PRESENTATION | OCTOBER 2021 26CORPORATE PRESENTATION | OCTOBER 2021 27
COLOMBIA - CURRENT LAND BASE
        #     Block                                      Working Interest                                     Gross Acres(1)
        1      VIM-1                                                        50%                                        139,575
        2      VIM-43                                                     100%                                           90,457                         Cartagena
        3      Fortuna(2)                                                 100%                                           26,205
        4      Boranda(2)                                                   50%                                          43,367
        5      De Mares(2)                                                  50%                                        174,387                   Covenas
        6      Aguas Blancas(2)                                             50%                                          13,386
        7      VMM-9                                                      100%                                         152,412
        8      VMM-46                                                     100%                                         111,026
                                                                                                                                           LOWER
        9      Capachos(2)                                                  50%                                          64,073
                                                                                                                                         MAGDALENA
       10      VSM-25(2)                                                  100%                                           68,221
       11      VSM-36                                                     100%                                         148,263
       12      LLA-16                                                     100%                                           10,057
       13      Los Ocarros                                                100%                                           30,562
       14      LLA-26                                                     100%                                           93,376                                            ODL Pipeline
       15      LLA-30                                                     100%                                             1,451        MIDDLE
       16      LLA-32                                                     87.5%                                          23,757        MAGDALENA
       17      LLA-34 (non-operated block)                                  55%                                          63,528
       18      LLA-40                                                     100%                                             4,072
       19      LLA-122                                                      50%                                        188,298                                                            LLANOS BASIN
       20      LLA-134                                                    100%                                         147,937
       21      Merecure(2)                                                  35%                                        141,527
       22      Cabrestero                                                 100%                                             9,212
       23      CPO-11(2)                                                    50%                                        489,617             UPPER
       24      LLA-94(2)                                                    50%                                          89,175          MAGDALENA
1) Exploration properties deemed non-commercial will be relinquished in due course. Accordingly, the acreage described above
   may decrease as lands are relinquished
2) Lands are subject to farm-in agreement earning terms and/or regulatory approval
                                                                                                                                   Source: Parex Resources – August 2021
                                                                                                                                      CORPORATE PRESENTATION | OCTOBER 2021                         28
APPENDIX - INDUSTRY LEADING PERFORMANCE METRICS
2018 2019 2020
Production growth % 25 19 -12
2P Reserves growth % 14 7 -2
3-Year TSR % 61 43 -4
ROACE(1) % 45 31 10
CROIC(2) % 31 28 13
EBITDA(3) US$ MM 641 663 309
Net income (loss) per share – basic $ 2.59 2.24 0.72
Cash flow per share – basic $ 2.58 3.90 2.15
Free cash flow US$ MM 98 362 156
Free cash flow yield(4) % 4 16 9
Liquidity
Cash US$ MM 463 397 331
Undrawn credit facility (no debt) US$ MM 200 200 200
Basic Shares outstanding Thousands 155,014 143,295 130,873
1) Return on average capital employed (ROACE) , a non-GAAP measure, is calculated as net income (loss)/(average (net debt + shareholders’ equity))
2) Cash return on invested capital (CROIC) , a non-GAAP measure, is calculated as EBITDA divided by average carrying value of exploration and evaluation assets and property, plant and equipment assets, excluding accumulated DD&A
3) EBITDA is a non-GAAP measure calculated as net income (loss) + interest + taxes + DD&A + impairment
4) Free cash flow yield is calculated as (funds flow from operations – capital expenditures)/Market capitalization (converted in USD)
CORPORATE PRESENTATION | OCTOBER 2021 29APPENDIX – SUMMARY OF QUARTERLY RESULTS(1)
(Unaudited Results) 2021 2020 2019 2018
Q2 Q1 FY Q4 Q3 Q2 Q1 FY Q4 Q3 Q2 Q1 FY Q4 Q3 Q2 Q1
Operating
Production (thousands of boe/d) 43.9 46.8 46.5 46.6 44.3 40.9 54.3 52.7 54.2 53.1 52.3 51.2 44.4 49.3 45.0 42.6 40.6
Brent Price ($/bbl) 69 61 43 45 43 33 51 64 63 62 69 64 72 68 76 75 67
Average realized prices, prior to hedging ($/boe) 60 53 33 37 34 19 39 55 53 54 60 52 59 55 62 62 56
Royalties ($/boe) 9 6 3 3 3 2 5 7 7 7 8 6 8 8 9 8 7
Opex ($/boe) 7 6 5 5 5 5 5 6 6 6 6 6 6 6 5 6 5
Transportation ($/boe)(2) 3 3 3 4 3 2 4 4 4 5 5 4 4 4 3 3 4
Operating Netback ($/boe) 41 37 21 25 23 10 24 37 36 36 41 36 41 38 44 45 39
Funds Flow Netback ($/boe)(3) 32 30 18 19 20 10 21 30 28 30 32 29 24 31 37 (2) 28
Financial
(millions of USD, except per share amounts)
(3)
Funds flow from operations 132 125 297 82 79 39 97 570 143 143 151 134 401 154 151 (8) 101
Net income (loss) 92 47 99 56 28 19 (4) 328 87 57 102 82 403 54 89 189 72
(4)
EBITDA 159 140 309 76 87 15 132 663 162 171 184 148 640 194 173 153 123
Cash and cash equivalents 371 370 331 331 353 334 397 397 397 350 318 433 463 463 361 323 295
Working Capital 352 342 320 320 371 339 330 344 344 280 240 207 219 219 143 66 206
Net Debt (Surplus)(5) (352) (342) (320) (320) (371) (339) (330) (344) (344) (280) (240) (207) (219) (219) (143) (66) (206)
Capital Expenditures 45 40 141 47 18 5 71 208 58 49 49 53 302 78 67 101 58
Bank Credit Facility 200 200 200 200 200 200 200 200 200 200 200 200 200 200 100 100 100
Weighted average shares outstanding 127 130 138 134 138 140 142 146 143 144 147 152 155 155 155 156 155
Trading Statistics (CAD) – PXT:CC
(based on intra-day trading)
Share Price
High 24.11 24.33 25.11 19.39 19.37 18.11 25.11 24.39 24.39 23.18 23.51 21.98 26.78 22.18 26.78 25.70 19.87
Low 19.08 17.34 9.12 12.05 13.90 10.83 9.12 15.37 17.59 18.77 19.85 15.37 13.62 13.62 18.25 17.52 16.82
Close (end of period) 20.70 22.41 17.52 17.52 14.03 16.36 11.90 24.15 24.15 20.30 21.01 20.92 16.35 16.35 21.95 24.82 18.12
Average daily volume (thousands) 882 1,010 1,156 1,182 866 1,085 1,617 1,125 1,115 1,019 1,147 1,221 1,115 1,112 1,332 1,034 983
(1) All values are rounded up or down to the nearest dollar figure. (3) In Q2 2019, Parex changed the way it calculates and presents FFO. For further details refer to the “Non-GAAP terms” on page 22. Comparative periods have also been adjusted for this change.
(2) 2017 transportation expense on a gross dollar and per boe basis were restated as a result of the Company adopting IFRS 15. For the three and six months ended June 30, 2018, FFO includes a $137.5 million ($0.88 per share basic) charge for a voluntary tax restructuring.
(4) EBITDA is defined as net income (loss) + interest + taxes + DDA + Impairment
(5) Net Debt is defined as Bank Debt - Working Capital CORPORATE PRESENTATION | OCTOBER 2021 30ADVISORIES
This presentation is provided for informational purposes only as of October 14, 2021, is not complete
and may not contain certain material information about Parex Resources Inc. ("Parex" or the
"Company"), including important disclosures and risk factors associated with an investment in Parex.
This presentation does not take into account the particular investment objectives or financial
circumstances of any specific person who may receive it and does not constitute an offer to sell or a
solicitation of an offer to buy any security in Canada, the United States or any other jurisdiction. The
contents of this presentation have not been approved or disapproved by any securities commission or
regulatory authority in Canada, the United Sates or any other jurisdiction, and Parex expressly disclaims How to reach us
any duty on Parex to make disclosure or any filings with any securities commission or regulatory
authority, beyond that imposed by applicable laws. PAREX RESOURCES INC.
2700 Eighth Avenue Place, West Tower
Forward-Looking Statements and FOFI
Certain information regarding Parex set forth in this document contains forward-looking statements that 585 8th Avenue SW Calgary, AB
involve substantial known and unknown risks and uncertainties. The use of any of the words "plan", T2P 1G1 Canada
"expect", “prospective”, "project", "intend", "believe", "should", "anticipate", "estimate" or other similar
words, or statements that certain events or conditions "may" or "will" occur are intended to identify
forward-looking statements. Such statements represent Parex' internal projections, estimates or beliefs Tel: 403-265-4800
concerning, among other things, future growth, results of operations, production, future capital and
other expenditures (including the amount, nature and sources of funding thereof), plans for and results Fax: 403-265-8216
of drilling activity, business prospects and opportunities. These statements are only predictions and
actual events or results may differ materially. Although the Company’s management believes that the
Email: investor.relations@parexresources.com
expectations reflected in the forward-looking statements are reasonable, it cannot guarantee future Website: www.parexresources.com
results, levels of activity, performance or achievement since such expectations are inherently subject to
significant business, economic, competitive, political and social uncertainties and contingencies. Many
factors could cause Parex' actual results to differ materially from those expressed or implied in any Mike Kruchten
forward-looking statements made by, or on behalf of, Parex.
In particular, forward-looking statements contained in this document include, but are not limited to,
Sr. Vice President, Capital Markets & Corporate Planning
statements with respect to the performance characteristics of the Company's oil properties; the
Company's vision, strategy and values; exploration prospects; the Company's exploration schedule; the
Company's drilling plans and production capability/potential; anticipated drilling locations, including the
Company's delineation and drilling plans; the Company's future plans for its business, including financial
CORPORATE PRESENTATION | OCTOBER 2021 31ADVISORIES
outlook; the Company’s ESG initiatives and the benefits to be derived therefrom; and activities to be undertaken in various areas. Statements relating to "reserves" or "resources" are forward-looking
statements, as they involve the implied assessment, based on estimates and assumptions that the reserves and resources described exist in the quantities predicted or estimated and can be profitably produced
in the future.
• These forward-looking statements are subject to numerous risks and uncertainties, including but not limited to, the impact of general economic conditions in Canada and Colombia; industry conditions including
changes in laws and regulations including adoption of new environmental laws and regulations, and changes in how they are interpreted and enforced, in Canada and Colombia; competition; lack of availability
of qualified personnel; the results of exploration and development drilling and related activities; risks related to obtaining required approvals of regulatory authorities, in Canada and Colombia and partner and
community approvals in Colombia; risks associated with negotiating with foreign governments as well as country risk associated with conducting international activities; volatility in market prices for oil;
fluctuations in foreign exchange or interest rates; environmental risks; changes in income tax laws, tax rates and/or incentive programs relating to the oil industry; changes to pipeline capacity; ability to access
sufficient capital from internal and external sources; failure of counterparties to perform under the terms of their contracts; risk that Parex’ evaluation of its existing portfolio of assets and exploration and
development opportunities is not consistent with its expectation’s; that production test results may not be indicative of long-term performance or ultimate recovery and other factors, many of which are beyond
the control of the Company. Readers are cautioned that the foregoing list of factors is not exhaustive. Additional information on these and other factors that could effect Parex' operations and financial results
are included in reports on file with Canadian securities regulatory authorities and may be accessed through the SEDAR website (www.sedar.com).
• Although the forward-looking statements contained in this document are based upon assumptions which management believes to be reasonable, the Company cannot assure investors that actual results will be
consistent with these forward-looking statements. With respect to forward-looking statements contained in this document, Parex has made assumptions regarding, among other things: current commodity
prices and royalty regimes; availability of skilled labour; timing and amount of capital expenditures; future exchange rates; the price of oil, including the anticipated Brent oil price; the impact of increasing
competition; conditions in general economic and financial markets; availability of drilling and related equipment; effects of regulation by governmental agencies; receipt of partner, regulatory and community
approvals; royalty rates; future operating costs; effects of regulation by governmental agencies; uninterrupted access to areas of Parex' operations and infrastructure; recoverability of reserves and future
production rates; the status of litigation; timing of drilling and completion of wells; on-stream timing of production from successful exploration wells; operational performance of non-operated producing fields;
pipeline capacity; that Parex will have sufficient cash flow, debt or equity sources or other financial resources required to fund its capital and operating expenditures and requirements as needed; that Parex'
conduct and results of operations will be consistent with its expectations; that Parex will have the ability to develop it's oil and gas properties in the manner currently contemplated; current or, where applicable,
proposed industry conditions, laws and regulations will continue in effect or as anticipated as described herein; that the estimates of Parex' reserves volumes and the assumptions related thereto (including
commodity prices and development costs) are accurate in all material respects; that Parex will be able to obtain contract extensions or fulfill the contractual obligations required to retain its rights to explore,
develop and exploit any of its undeveloped properties; and other matters.
• Management has included the above summary of assumptions and risks related to forward-looking information provided in this document in order to provide shareholders with a more complete perspective on
Parex' current and future operations and such information may not be appropriate for other purposes. Parex' actual results, performance or achievement could differ materially from those expressed in, or
implied by, these forward-looking statements and, accordingly, no assurance can be given that any of the events anticipated by the forward-looking statements will transpire or occur, or if any of them do, what
benefits Parex will derive. These forward-looking statements are made as of the date of this document and Parex disclaims any intent or obligation to update publicly any forward-looking statements, whether as
a result of new information, future events or results or otherwise, other than as required by applicable securities laws. The forward-looking statements contained in this presentation are expressly qualified by
this cautionary statement.
CORPORATE PRESENTATION | OCTOBER 2021 32ADVISORIES
• This document also contains a financial outlook, in particular the information set forth on slides 2, 4, 5, 6, 8, 17, 19 and 23. Such financial outlook has been prepared by Parex' management to provide an
outlook of the Company's activities and results. The financial outlook has been prepared based on a number of assumptions including the assumptions discussed above and assumptions with respect to the
costs and expenditures to be incurred by the Company, capital equipment and operating costs, foreign exchange rates, taxation rates for the Company, general and administrative expenses and the prices to be
paid for the Company's production. Management does not have firm commitments for all of the costs, expenditures, prices or other financial assumptions used to prepare the financial outlook or assurance
that such operating results will be achieved and, accordingly, the complete financial effects of all of those costs, expenditures, prices and operating results are not objectively determinable. The actual results
of operations of the Company and the resulting financial results will likely vary from the amounts set forth in the analysis presented in this presentation, and such variation may be material. The Company and
its management believe that the financial outlook has been prepared on a reasonable basis, reflecting the best estimates and judgments, and represent, to the best of management's knowledge and opinion,
Parex's expected expenditures and results of operations. However, because this information is highly subjective and subject to numerous risks including the risks discussed above, it should not be relied on as
necessarily indicative of future results. Except as required by applicable securities laws, Parex undertakes no obligation to update such financial outlook.
Oil and Gas Information
• The estimates of Parex' December 31, 2020 reserves set forth in this presentation have been prepared by GLJ Petroleum Consultants Ltd. ("GLJ") as of December 31, 2020 with a preparation date of February
4, 2021 (the "GLJ 2019 Report") in accordance with National Instrument 51-101 – Standards of Disclosure for Oil and Gas Activities ("NI 51-101") and the Canadian Oil and Gas Evaluations Handbook (the
"COGEH") and using GLJ's forecast prices and costs as at January 1, 2021. The estimates of Parex' December 31, 2019 reserves set forth in this presentation have been prepared by GLJ as of December 31, 2019
with a preparation date of February 6, 2020 in accordance with NI 51-101 and the COGEH and using GLJ's forecast prices and costs as at January 1, 2020. The estimates of Parex' December 31, 2018 reserves
set forth in this presentation have been prepared by GLJ as of December 31, 2018 with a preparation date of February 7, 2019 in accordance with NI 51-101 and the COGEH and using GLJ's forecast prices and
costs as at January 1, 2019. The estimates of Parex' December 31, 2017 reserves set forth in this presentation have been prepared by GLJ as of December 31, 2017 with a preparation date of February 2, 2018
in accordance with NI 51-101 and the COGEH and using GLJ's forecast prices and costs as at January 1, 2018. The estimates of Parex' December 31, 2016 reserves set forth in this presentation have been
prepared by GLJ as of December 31, 2016 with a preparation date of February 6, 2017 in accordance with NI 51-101 and the COGEH and using GLJ's forecast prices and costs as at January 1, 2017. The
estimates of Parex' December 31, 2015 reserves set forth in this presentation have been prepared by GLJ as of December 31, 2015 with a preparation date of February 5, 2016 in accordance with NI 51-101
and the COGEH and using GLJ's forecast prices and costs as at January 1, 2016.
• “Proved" or "1P" reserves are those reserves that can be estimated with a high degree of certainty to be recoverable. It is likely that the actual remaining quantities recovered will exceed the estimated proved
reserves.
• "Probable" reserves are those additional reserves that are less certain to be recovered than proved reserves. It is equally likely that the actual remaining quantities recovered will be greater or less than the
sum of the estimated proved plus probable" reserves.
• “Possible” reserves are those additional reserves that are less certain to be recovered than probable reserves. There is a 10 percent probability that the quantities actually recovered will equal or exceed the
sum of proved plus probable plus possible reserves. It is unlikely that the actual remaining quantities recovered will exceed the sum of the estimated proved plus probable plus possible reserves.
• "2P" means Proved Plus Probable reserves.
• "3P" means Proved Plus Probable Plus Possible reserves.
• Estimates of the net present value of the future net revenue from Parex' reserves do not represent the fair market value of Parex' reserves. The estimates of reserves and future net revenue from individual
properties or wells may not reflect the same confidence level as estimates of reserves and future net revenue for all properties and wells, due to the effects of aggregation.
CORPORATE PRESENTATION | OCTOBER 2021 33ADVISORIES
• This presentation contains certain oil and gas metrics, including F&D, FD&A, FD&A/boe, reserves life index (or RLI), operating netbacks, cash netbacks, funds flow from operations netback, CAGR, replacement
ratio, and recycle ratios, which do not have standardized meanings or standard methods of calculation and therefore such measures may not be comparable to similar measures used by other companies and
should not be used to make comparisons. Such metrics have been included herein to provide readers with additional measures to evaluate the Company's performance; however, such measures are not
reliable indicators of the future performance of the Company and future performance may not compare to the performance in previous periods and therefore such metrics should not be unduly relied upon.
Management uses these oil and gas metrics for its own performance measurements and to provide investors with measures to compare the Company's operations over time. Readers are cautioned that the
information provided by these metrics, or that can be derived from the metrics presented herein, should not be relied upon for investment or other purposes. A summary of the calculations of such metrics
are as follows:
o Finding and development (“F&D”) costs are calculated by dividing capital expenditures by the change in reserves within the applicable reserves category. F&D costs, including FDC, include all capital
expenditures in the year as well as the change in FDC required to bring the reserves within the specified reserves category on production.
o Finding, development and acquisition ("FD&A”) costs represent the costs of property acquisition, exploration, and development incurred. The aggregate of the exploration and development costs
incurred in the most recent financial year and the change during that year in estimated future development costs generally will not reflect total finding and development costs related to reserves
additions for that year.
o FD&A costs are calculated as capital expenditures plus net acquisition costs plus change in FDC. FD&A per boe is calculated as FD&A costs divided by reserves additions for the applicable period.
o Reserves life index is calculated by dividing the applicable reserves category by the annualized fourth quarter production.
o Replacement ratio is calculated by dividing the annual reserve additions by the annual production
o Recycle ratio is calculated as FFO per boe divided by F&D or FD&A, as applicable
o Funds Flow from Operations per boe is a non-GAAP measure that includes all cash generated from operating activities and is calculated before changes in non-cash working capital, divided by sales
volumes for the period. In Q2 2019, the Company changed how it presents funds flow provided by (used in) operations to present a more comparable basis to industry presentation.
o Operating netback is calculated as oil & gas revenue less expenses (royalties, production and transportation) divided by production for the period.
o CAGR is calculated as:
i. (2020 debt adjusted production per share divided by 2016 debt adjusted production per share)1/4 – 1, and
ii. (2020 2P reserves per share divided by 2016 2P reserves per share)1/4 – 1
o Free cash flow yield is calculated as funds flow minus capex divided by market capitalization (converted in USD)
o Return on average capital employed (ROACE), a non-GAAP measure, is calculated as net income (loss)/(average (net debt + shareholders’ equity))
o Cash return on invested capital calculated (CROIC), a non-GAAP measure, is calculated as EBITDA divided by average carrying value of exploration and evaluation assets and property, plant and
equipment assets, excluding accumulated DD&A
• "BOEs" may be misleading, particularly if used in isolation. A BOE conversion ratio of six thousand cubic feet of natural gas to one barrel of oil equivalent (6 mcf:1 bbl) is based on an energy equivalency
conversion method primarily applicable at the burner tip and does not represent a value equivalency at the wellhead. Given that the value ratio based on the current price of crude oil as compared to natural
gas is significantly different from the energy equivalency of 6:1, utilizing a conversion on a 6:1 basis may be misleading as an indication of value.
CORPORATE PRESENTATION | OCTOBER 2021 34ADVISORIES
• All of Parex’ crude oil reserves disclosed herein are located in Colombia. The Company has light, medium and heavy crude oil, natural gas liquids and conventional natural gas product types. The recovery and
reserve estimates of reserves provided in this document are estimates only, and there is no guarantee that the estimated reserves will be recovered. Actual reserves may eventually prove to be greater than,
or less than, the estimates provided herein. All evaluations and reviews of future net revenue contained in GLJ's reports are stated prior to any provision for interest costs or general and administrative costs
and after the deduction of royalties, development costs, production costs, well abandonment costs and estimated future capital expenditures for wells to which reserves have been assigned.
• Certain other information contained in this presentation has been prepared by third-party sources, which information has not been independently audited or verified by Parex. No representation or warranty,
express or implied, is made by Parex as to the accuracy or completeness of the information contained in this document, and nothing contained in this presentation is, or shall be relied upon as, a promise or
representation by Parex.
• This presentation contains references to type well production and economics, which are derived, at least in part, from available information respecting the well economics of other companies and, as such,
there is no guarantee that Parex will achieve the stated or similar results, capital costs and return costs representative per well.
• References in this presentation to initial production test rates, initial "flow" rates, initial flow testing, and "peak" rates are useful in confirming the presence of hydrocarbons, however such rates are not
determinative of the rates at which such wells will commence production and decline thereafter and are not indicative of long term performance or of ultimate recovery. While encouraging, investors are
cautioned not to place reliance on such rates in calculating the aggregate production for Parex. Parex has not conducted a pressure transient analysis or well-test interpretation on the wells referenced in this
presentation. As such, all data should be considered to be preliminary until such analysis or interpretation has been done.
Financial Matters
• The Company discloses several financial measures that do not have any standardized meaning prescribed under International Financial Reporting Standards ("IFRS"). These financial measures include operating
netbacks, cash netbacks, funds flow netbacks, funds flow per share, free cashflow, funds flow from operations netback and funds flow from operations, return on average capital employed, cash return on
invested capital calculated and EBITDA. Management believes that these financial measures are useful supplemental information to analyze operating performance and provide an indication of the results
generated by the Company’s principal business activities. Investors should be cautioned that these measures should not be construed as an alternative to net income or other measures of financial
performance as determined in accordance with “Oil and Gas Information” and IFRS. Parex’s method of calculating these measures may differ from other companies, and accordingly, they may not be
comparable to similar measures used by other companies. Please see the Company’s most recent Management’s Discussion and Analysis, which is available at www.sedar.com for additional information about
these financial measures.
CORPORATE PRESENTATION | OCTOBER 2021 35CORPORATE PRESENTATION | OCTOBER 2021 36
You can also read