Company Presentation - Italmobiliare
←
→
Page content transcription
If your browser does not render page correctly, please read the page content below
Company Presentation

DISCLAIMER

             Information reported in this document (the "Document") has been compiled by Italmobiliare S.p.A. ("Italmobiliare" or the "Company") from
             public sources and no representation or warranty, express or implied, is made, given or accepted by or on behalf of Italmobiliare as to the
             accuracy, completeness or fairness of the information or opinions contained herein. Neither Italmobiliare nor any other person accepts any
             liability whatsoever for any loss arising from any use of, or otherwise in connection with, the Document.
             The information set out herein may be subject to updating, revision, verification and amendment and such information may change
             materially. Italmobiliare undertakes no obligation to update or keep current the information contained in this document and any opinions
             expressed in them is subject to change without notice or revise its outlook or forward-looking statements, whether as a result of new
             developments or otherwise.
             Forward Looking Statement
             This Document may contain forward-looking statements. These statements are based on current expectations and projections about future
             events and, by their nature, are subject to inherent risks and uncertainties. They relate to events and depend on circumstances that may or
             may not occur or exist in the future, and, as such, undue reliance should not be placed on them. Actual results may differ materially from
             those expressed in such statements as a result of a variety of factors, including: continued volatility and further deterioration of capital and
             financial markets, changes in commodity prices, changes in general economic conditions, economic growth and other changes in
             business conditions, changes in laws and regulations and the institutional environment (in each case in Italy or abroad), and many other
             factors, most of which are beyond Italmobiliare control. Italmobiliare expressly disclaims and does not assume any liability in connection
             with any inaccuracies in any of these forward-looking statements or in connection with any use by any party of such forward-looking
             statements.
             Not an Offer of Securities
             The information provided in this Document is for informational purposes only and is not intended to be, nor should it be considered to be,
             an advertisement or an offer or a solicitation of an offer to buy or sell any securities. The information herein, or upon which opinions have
             been based, has been obtained from sources believed to be reliable, but no representations, expressed or implied, or guarantees, can be
             made as to their accuracy, timeliness or completeness. All opinions and information set forth herein are subject to change without notice.
             Past performance should not be taken as an indication or guarantee of future performance, and no representation or warranty is made
             regarding future performance. Before entering into any transaction, you should take steps to ensure that you understand and have made
             an independent assessment of the appropriateness of the transaction in light of your own objectives and circumstances, including the
             possible risks and benefits of entering into such transaction. You should also consider making such independent investigations by discussing
             the transaction with your professional tax, legal, accounting, and other advisors.
             This Document is being delivered for information purposes only to a very limited number of persons and companies who are ‘qualified
             investors’ within the meaning of section 86(7) of FSMA purchasing as principal or in circumstances under section 86(2) of FSMA, as well as
             persons who have professional experience in matters relating to investments and who fall within the category of persons set out in Article 19
             of the Financial Services and Markets Act 2000 (Financial Promotion) Order 2005 (the “Order”) or are high net worth companies within the
             meaning set out in Article 49 of the Order or are otherwise permitted to receive it (together, the "Relevant Persons"). This Document is
             distributed only to and directed only at Relevant Persons and must not be acted on or relied upon by persons who are not Relevant
             Persons. Any other person who receives this Document should not rely or act upon it. By accepting this Document and not immediately
             returning it, the recipient is deemed to represent and warrant that: (i) they are a person who falls within the above description of persons
             entitled to receive the Document; (ii) they have read, agree and will comply with the contents of this notice; and (iii) they will use the
             information in this Document solely for evaluating their possible interest in acquiring securities of the Company. If you are in any doubt as to
             the matters contained in this Document (including whether you fall within the definitions of Qualified Investor or Relevant Person) you
             should consult an authorised person specialising in advising on investments of the kind contained in this Document. Any investment or
             investment activity to which this Document relates is available only to Qualified Investors and Relevant Persons.

                                                                                                                                                                2
INDEX

        Italmobiliare: Overview
        Investment Portfolio
        Focus on portfolio companies
        Closing remarks
        Appendix

                                       3
Identity & mission and strategic approach

                    IDENTITY                                                         MISSION
     “Italmobiliare is an Investment Holding                       “Playing a pro-active and continuous role
       focusing on a portfolio of diversified                        in the growth and enhancement of its
                                                                      investments portfolio by developing,
     participations and investments, with a
                                                                  innovating, and diversifying internationally
        strategic vision underpinned by a
                                                                         its investments, with an effective
      financial and industrial history dating
                                                                  governance and risk management model,
            back more than 150 years”
                                                                  and providing its core portfolio companies
                                                                    access to a unique business ecosystem”

                                                INVESTMENT STRATEGY
                  Focus on Italian champions operating in resilient industrial, services, and consumer sectors
      Focus       with strong brands, distinctive capabilities, and international presence
                  Flexible approach on investments, usually focused on entrepreneurs skills and talent
                  Contribution to value creation of portfolio companies with strategic and financial support
       Value      for organic and M&A growth, as well as identification of synergies between portfolio
      creation    companies and Italmobiliare itself
    and network   Private equity investments provide Italmobiliare and its direct investee companies a global
                  footprint for business opportunities
                  Leverage on Italmobiliare's long history of listed holding of multinational companies to
    Governance    provide support to investee companies on matters as governance, sustainability, code of
                  ethics, etc.

                                                                                                                 4
Italmobiliare at a glance

   •     Investment holding since 1946

   •     Majority shareholder: Pesenti family, active in the Italian business community for over

         150 years

   •     Focus on equity investments

   •     NAV: Euro 1.6 bn(1)

   •     Market cap: approx. Euro 850 m(2)

   •     Total shareholders return last 5 years: 51%(2)

   •     Dividend yield: 2.7%(2)

  (1) As of June 30, 2019, net of treasury shares
  (2) As of July 31, 2019, share price of Euro 20.20 per share (stock trades ex dividend of Euro 0,55 per share from May 6, 2019), market cap net of treasury shares

                                                                                                                                                                       5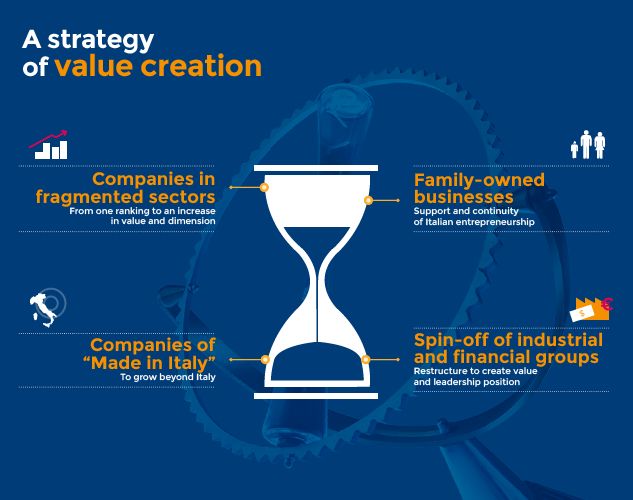
Our History

                                                                                                                        Sale of Italcementi for a
                                                                                                                        mix of cash and assets
                                                                                                                        incl. Italgen,
                                                                                                                        BravoSolution and
                                                                                                                        HeidelbergCement            Purchase of 60% in
                                                                                                                        shares                      Caffè Borbone
                                                                                                                                                    and of 40% in Iseo

                                         Asset diversification:         Focus on talcementi
                       Purchase of                                                                  Portfolio
                                         RAS, IBI, Falck, Bastogi,      and sale of financial
                       stake in Tosi                                                                diversification
                                         etc.                           participations (RAS, IBI)

     1946           1952           1962-78            1979              1984           1992          1993-05           2016          2017           2018         2019

                                                                                                                                                           Acquisition of a
                                                                                                               Conversion of                               stake in Autogas
                                                                            Italcementi acquires
Italcementi, founded in 1864,          In 1979 Italmobiliare acquires                                          Italmobiliare                               Nord
                                                                            Ciments Français
carves out into newly created          the control of Italcementi and                                          saving shares      Share buy back for
                                                                            becoming a world
Italmobiliare the non-building         in 1980 is listed on the Milan                                                             €100m                    Cancellation of
                                                                            leading player in the
materials related assets               Stock Exchange                                                          Acquisition of                              90% of treasury
                                                                            cement industry
                                                                                                               Clessidra SGR      Purchase of stake in     shares
                                                                                                                                  Tecnica Group
                                                                                                                                                           Sale of stake in
                                                                                                                                  Sale of BravoSolution    Jaggaer
                                                                                                                                  and acquisition of a
                                                                                                                                  stake in Jaggaer

                                                                                                                                                                              6
Investment Portfolio
            Deployment of a new portfolio of strategic participations after the disposal of Italcementi in 2016

  ▪ Italmobiliare manages a diversified investment portfolio with a NAV of approx. Euro 1.6 bn(1)

              NAV Euro 1.6 bn(1)                                               Investments

           Financial assets,           Investments in    Participations    Portfolio companies             Private Equity
          trading and cash          listed companies
               € 424 M                    € 278 M
                 27%                        17%
Real estate                                                                                        2018                     2016
and related
 activities
  € 48 M
    3%
                                                                                                 1990
                                                                                                                        Fund II 2016
  Private                                                                       2017
                                              Other                                                                     Fund III 2019
   equity                                  investments
  € 130 M                                    € 120 M
     8%                   Portfolio             8%                             2018
                         companies
                          € 586 M                                                                   2016                    2018
                            37%

                                                                                       2016
                                                                                                                            2019

                                                                                        2019

                                                                                                                            2019

                                                                          Italmobiliare core
                                                                               business
(1) As of June 30, 2019 (net of treasury shares)

                                                                                                                                   7
Net Asset Value development
            Transition towards target NAV in progress

€1,545m                                                               €1,588 m                                                       TARGET
December 31, 2017                                                     June 30, 2019

                            Real Estate &                                                      Real Estate &
             Other             Other                                                              Other                                    Financial
          investments            4%                                                 Other           3%         Listed
                                                 Listed                          investments                                         investments, trading
              4%                                                                     8%                    Participations                                          Other assets
                                             participations                                                                               & liquidity
                                                  35%                                                           17%                                                   10%

  Financial                                                                                                                             Private
                                                                                                                                        Equity
investments,                                                            Financial                                                        >10%
  trading &                                                           investments,
   liquidity                                                            trading &
      36%                                                                liquidity                                   Portfolio
                                                                            27%                                     Companies
                                                                                                                       37%
                                                                                                                                                                   Portfolio
                        Private           Portfolio                             Private Equity                                                                    Companies
                                         Companies                                    8%                                                                            >50%
                        Equity              15%
                          6%

                                                                                                                                    Strategic divestments

                                                                                                                            (€ m)               Increase due to
                                                              (€ m)
                                                                                                                                                 investments in
Listed participations                                           544    Listed participations                                 278
                                                                                                                                                 Caffè Borbone,
Portfolio companies                                             240    Portfolio companies                                   586
                                                                                                                                               Iseo and Autogas
Private Equity                                                   95    Private Equity                                        130
Financial investments, trading & liquidity                      549    Financial investments, trading & liquidity            424
Other participations                                             59    Other investments                                     120        Divestments to fund
Real estate & other                                              58    Real estate & other                                    48            acquisitions

NAV as of 31.12.2017                                          1,545    NAV as of 30.06.2019                                 1,588
NAV per Share                                                 36.8€    NAV per Share                                        37.9€       Increase in Jaggaer's
NAV Discount                                              34.6%
                                                                       NAV Discount                                         44,0%          stake fair value

Note: NAV net of treasury shares, discount calculated as of NAV's date

                                                                                                                                                                                  8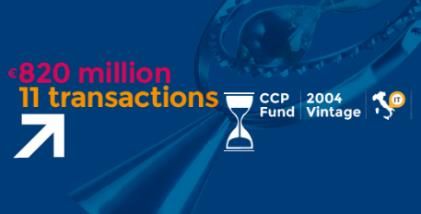
Net Asset Value development over the last 6 months
         Increase of investments in portfolio companies

                                               Increase due to investment
                                                 in Autogas (+€60m) and
        Mainly effect of disposals of                                                                                Mainly increase
                                                 overall NAV revaluation
              Mediobanca and                                                                                          in Jaggaer's
                                                         (+€46m)
         Heidelberg shares partially                                                                                      value
        offset by positive share price
         performance of remaining
                   shares
                                                                                                    1                 27
                                                                                79

                                                           106
                                        (47)
                                                                        Mainly effect of
                                                                      divestments of listed                                            1.588
                                                                       companies net of
                                                                         investment in
                1.421
                                                                            Autogas

        NAV @31/12/2018           Investments in        Portfolio       Financial assets,     Private equity   Other investments NAV @30/06/2019
                               listed companies        companies       trading and cash

Note: data in €M; NAV net of treasury shares

                                                                                                                                                   9
Q2 2019 results and key highlights

                ▪ As of June 30, 2019 NAV of Euro 1,588 m with an increase of Euro 166 m from December 31, 2018 (Euro 1,421
Positive NAV       m)
 dynamics       ▪ NAV increase mainly resulting from increase of value of the portfolio companies (Euro +46 m), of the stake
                   in Jaggaer (Euro +30 m) and mark-to-market of listed participations (Euro +67 m)

                ▪ Solid results of Portfolio Companies in the first half of 2019:
  Positive                • Solid growth of Caffè Borbone (revenues +28% YoY), Tecnica Group (revenues +6% YoY)
performance               • Good performance of Iseo (1Q revenues +1% YoY) and Autogas (revenues +4% YoY)
 of Portfolio
                          • All portfolio companies increased their EBITDA in the first half of 2019 compared to the same period
 Companies
                              of 2018: in aggregate EBITDA grew by 30%

Disposals and   ▪ In Q2 19, Italmobiliare sold Heidelberg and Mediobanca shares totaling Euro 112 m
  dividends     ▪ Received dividends from portfolio companies Italgen (Euro 6 m) and Caffè Borbone (Euro 5 m)
  received
                                                                                                           NAV @June 30, 2019
                ▪ On July 8th announced the sale, alongside Accel-KKR, of the 9.5%                       Pro-forma for disposal(2)
                  stake held in Jaggaer to the international private equity firm Cinven                              Real Estate &
                                                                                                          Other         Other
                  for approx. USD 100                 m(1).    The transaction is expected to be       investments        3%       Listed
  Material                                                                                                 3%                 Participations
                                                                                                                                    17%
events after      completed in Q3 2019. Cinven could request a rollover up to 20% of
                                                                                                     Financial
 June 30th,       the purchase price
                                                                                                   investments,
   2019         ▪ In July Tecnica Group completed two strategic acquisitions (more                   trading &
                                                                                                      liquidity
                                                                                                                                     Portfolio
                  details in the next pages)                                                             32%                        Companies
                                                                                                                                       37%
                (1) before taxes and potential adjustments under review                                  Private Equity
                (2) considering rollover of 20% of the purchase price of the stake in Jaggaer                  7%

                                                                                                                                               10
Value creation from the investment in Bravo Solution-Jaggaer
▪ As part of the Italcementi transaction, in July 2016 ITM acquired a 75% stake from Italcementi in the e-procurement
solutions provider Bravo Solution
▪ In December 2017, ITM sold Bravo Solution to Jaggaer, spend management solution provider backed by private
equity fund Accel-KKR, reinvesting part of the proceeds (~Euro 35 m) in a 9.5% stake in Jaggaer
▪ Following the sale of Jaggaer alongside Accel-KKR to Cinven, which values ITM stake approx. USD 100 m(1), ITM
realizes a significant return from its investment in Bravo Solution-Jaggaer
ITM investment timeline IRR ITM
2016-2019:
+49% (MoM 2,4x)
Majority stake Sale of Bravo Solution to Sale of Jaggaer to
purchase from Jaggaer with partial Cinven(1)
italcementi reinvestment
ITM stake % 83% 9.5%
Net cash-in out of Bravo
Solution: €114m
88
NAV value (mar-19): €57m
Financial Historical cost (dec-17): €35m
flows
(€ m)
(70) 79
Jul-16 Dec-17 Jul-19
(1) before taxes and potential adjustments under review
11Value creation for portfolio companies: Tecnica Group add-on
▪ In July 2019, Tecnica Group with the strategic support of Italmobiliare, has completed a double acquisition
from the same seller of:
▪ a further 15% stake in the controlled subsidiary Lowa, German outdoor footwear company which
represent about 50% of the Group turnover, increasing its shareholding to 75% (the remaining 25%
The is held by Lowa's CEO)
transaction ▪ 100% of Riko Sport, Lowa’s main production supplier with a 2018 turnover of approx Euro 110 m
euro and an EBITDA margin of over 10%
▪ Tecnica Group refinanced its long-term debt structure to fund the transaction and optimize the total cost.
A consortium formed by Banca Intesa, Unicredit, Banco BPM and Commerzbanck provided the new
financing structure
▪ Acquisition of Lowa's minorities will strengthen Tecnica Group through simplification of ownership structure
Strategic of a key asset and improvement of the Group's financial profile (cash flow and cash pooling)
rationale ▪ The acquisition of Riko will allow Lowa to internalize a key supplier, to improve cooperation and realize
operational synergies
Tecnica Group value creation
Investment
Consolidation of
Riko's EBITDA
Tecnica
Group
EBITDA ~50
(€ m) 38
28 31
2016 2017 2018 Riko 2018 Pro-forma
12Italmobiliare shareholding structure
▪ Major shareholder is Efiparind B.V., 100% owned by the Pesenti family
▪ Italmobiliare Board of Directors composed by 14 members, majority of independent directors, in office until
the approval of 2019 results
Shareholding structure(1) Board of Directors
Over 70% held by institutional
investors, of which more than
L. Zanetti E. Fornero
60% by international (Chairman)
investment funds
Independent
L. Strazzera Director
S. Mazzoleni
(Vice Chairman) according to
Free float TUF
31,3% C. Pesenti
L. Minoli
(CEO)
Indipendent
V. Bertazzoni C. Palmieri
Efiparind Director
Trasury shares
49,3% according to TUF
1,3% and
Mediobanca G.Bonomi C. Rebecchini Code of Conduct
6,8%
Serfis M. Cartia d’Asero A. Salerno
11,2%
V. Casella P. Sfameni Non-executive
Director
(1) As of July 2019 TUF: Italian law on finance
13Chairperson and CEO profiles
Graduate with honors in Economics and Management from Bocconi University,
where she is currently Associate Professor with tenure of Corporate Finance as well as
Academic Director of the Bachelor of Economics and Finance
Previously she was a member of the executive council of the Department of Finance
and the Director of the Master of Science in Finance at Bocconi University, Research
Fellow of CAREFIN, Center for Applied Research in Finance, visiting scholar at both MIT
(Massachusetts Institute of Technology) and the LSE (London School of Economics and
Political Science)
She is Certified Chartered Accountant, member of the European Corporate
Governance Institute, board member and statutory auditor of leading listed companies
Laura Zanetti
Author of several books and articles on corporate governance and business valuation
Chairperson
Degree in Mechanical Engineering from Milan Polytechnic, Master in Economics &
Management from the Bocconi University
In addition to his roles in Italmobiliare Group (including CEO of Italcementi from 2004 until
2016, when the Italcementi investment was sold), he has been a director of leading stock-
listed companies. Currently, he is Chairman of Clessidra Sgr and of the Pesenti Foundation,
and also a director of Tecnica, of Caffè Borbone, and of the Cesvi Foundation
Permanent member of the General Council of Confindustria, where he was Deputy
Chairman of the General Council (2014-2016) and chaired the Reforms Commission. He is
member of the Advisory Board of Assolombarda. He has been a member of the Steering
Council and Board of Assonime since June 2015
Carlo Pesenti From 2006-2008, Co-President of the Italo-Egyptian Business Council. He is also a member of
CEO the board of the Italy-India CEO Forum and Co-President of the Italy-Thailand Business
Forum
14Environmental, social and governance
Governance Sustainability Report
VALUES AND PRINCIPLES The guiding criteria underlying Italmobiliare's investment
The investment activity of Italmobiliare aims to policies establish basic guidelines in terms of
increase, according to criteria of sustainability and responsibility and sustainability to guarantee all the
transparency, the value of its portfolio in the medium- stakeholders.
long term. For this reason, in addition to the financial reporting
The participation of Italmobiliare in the portfolio requirements, since 2017 Italmobiliare has published the
companies is characterized by a proactive approach, Sustainability Report ('Consolidated non-financial
that promotes the adoption of best governance Statement'), with details on policies and results
practices and the sharing of the basic principles of a achieved in
codified system of values and rules. protection of the environment, personnel, the
reference community, and in the fight against
corruption according to the principles of the
The Code of Ethics aims to provide the Group with a Company's Code of Ethics.
solid platform of values as a necessary condition to The Report represents a further step forward in the
guarantee constructive dialogue with all stakeholders, process of interaction with the enlarged community of
and reaffirms the safeguard of ethical principles and all the "stakeholders", and gives an overview of the
legality as an essential asset for doing business. Group's sustainable value creation process.
The Risk and Sustainability Committee, made up of
non-executive and mostly independent directors,
performs advisory and propositive functions in defining
the nature and level of risk deemed compatible with
the strategic objectives; it also assists the Board of
Directors in the field of Sustainability, defined as a set of
principles that underpin the creation of value for all the
Company's stakeholders.
15Italmobiliare share price performance|Last 5 years
Last 5 years Italmobiliare share price performance vs reference index Total shareholder return: last 5 years
TIP 171%
200 March 2017
Share buy-back
Lundbergs 146%
180
Sofina 130%
July 2015
Agreement with
160 HeidelbergCement Exor 127%
140 Italmobiliare: Investor 113%
+35%
FFP 106%
120
FTSE all- Eurazeo 54%
100 shares: +7%
Italmobiliare 51%
80
Wendel 41%
60 GBL 37%
March 2019
40 BoD proposal for the Alba 13%
cancellation of 90% of
July 2016 tender treasury shares
offer on savings
shares
CIR 9%
20
0
31/07/2014 31/07/2015 31/07/2016 31/07/2017 31/07/2018 31/07/2019
Source: Bloomberg as of July 31, 2019; prices rebased to 100 Source: Bloomberg as of July 31, 2019
16Risk factors monitoring
Italmobiliare periodically performs an integrated analysis of the main risk factors and related
mitigation measures
▪ Portfolio risk analysis:
▪ main risk indicators (VaR, CVaR and recovery time) are in line with the average risk indicators of the global equity
index
▪ well diversified portfolio with a balanced degree of correlation of the different components
▪ Italmobiliare and each of the portfolio companies periodically monitor and analyze specific risk factors and identify
precise actions for risk mitigation and hedging
▪ Risk factors analyzed are: capital markets, regulatory, sustainability, country and currency exposure, commodities,
technological disruption, rates, economic cycle, cybersecurity, etc.
▪ Exposure to different country/area risks: the NAV distribution proportional to the geographic diversification of sales shows
a balanced exposure to different geographic areas, although with a concentration on Italy which accounts for approx.
40% of total NAV
NAV June 30, 2019 NAV geographic breakdown
proportional to 2018 sales Major changes
Real Estate &
Other
Other 3% Listed
investments
8% Participations Autogas
17%
Extra Europe
26% Italy
40%
Financial investments
Financial
investments,
trading & Mediobanca
liquidity Portfolio
Companies Rest of Europe
27% 37% 34% Heidelberg Cement
Private Equity
8%
17INDEX
Italmobiliare: Overview
Investment Portfolio
Focus on portfolio companies
Closing remarks
Appendix
18Portfolio companies
Portfolio
Companies
37%
Strategy: Ebitda growth, organic and M&A business expansion
Financials 2018 (€m): Revenues
breakdown
Sector Strategy and drivers Revenues (YoY % var.)
by
EBITDA (% margin) geography
Caffè Borbone (60%) ▪ Double digit organic growth in a 135 (+44%)
▪ Coffee 96% ITA
growing market 34 (25%)
Tecnica (40%) ▪ Support to organic growth,
▪ Sport product/brand portfolio enhancement, 399 (+8%)
New investments
93% Abroad
equipment group structure optimization, margin 38 (9%)
improvement
ISEO (40%) ▪ Access ▪ Partnership with entrepreneurs to
control and support organic and M&A growth 138 (-4%)
75% Abroad
locking ▪ Acceleration in the digital and 14 (10%)
solutions electronic space
Gruppo Autogas ▪ Support entepreneur in the acquisition
(~27%) ▪ LPG gas B2C of competitor Lampogas 526(1)
100% ITA
distribution ▪ Resilient yield play, and upside potential 36 (7%)
through bolt-on M&A
Sirap Group (100%) ▪ Historical participation of Italmobiliare 275 (+33%)
▪ Food
▪ Play an active role in market 70% Abroad
Historical
packaging 16 (6%)
consolidation
Italgen (100%) ▪ Hydro and ▪ Historical participation of Italmobiliare 36 (n.m.)
renewable ▪ Resilient yield play, efficiency, market 100% ITA
energy consolidation 8 (23%)
(1) Pro-forma combined financials 2018 of Autogas and Lampogas
19Listed participations: HeidelbergerCement and Mediobanca
Listed
Participations
17%
Strategy: dividend yield, opportunistic divestiture
Dividend yield(3)
% NAV(1) Sector Strategy
2019 2020E
▪ Participation of 1.6%
▪ Current value: € 224 m(1)
14.1% Building materials ▪ Dividend yield 3.0% 3.5%
▪ Progressive divestiture (overall
reduction of stake from 5.3% to 1.6%)
▪ 0.7% participation amounting to € 54
3.4%(2) Banking m(1)(2) (of which € 19 m though 5.2% 5.2%
Fin.Priv investment holding)
Source: Bloomberg
(1) As of June 30, 2019
(2) Includes shares held through Fin.Priv investment holding
(3) Source: Bloomberg, based on share price as of June 30, 2019
20Private Equity & co-investiments
Private
equity &
Co-
investments
8%
Strategy: global reach and one-stop shop for entrepreneurs willing to partner with Italmobiliare
Geographical Vintage Italmobiliare
Strategy
focus year commitment
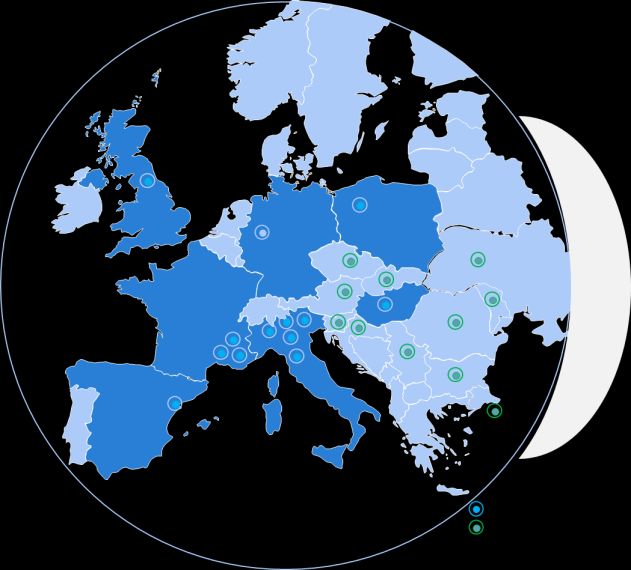
Clessidra CCP 3 Italy 2015 ▪ PE leader in Italy € 92 m
▪ Focus on high-quality «Made in Italy»
▪ Latest investment Scrigno, pocket door counter frames
▪ Italmobiliare is anchor investor and owner of GP
BDT Fund II US 2016 ▪ Focus on family-owned businesses $ 50 m
▪ Advisory and long-term capital
▪ Investments between $200-800m
▪ Time horizon 8-12 years
BDT Fund III US 2019 ▪ Focus on family-owned businesses $ 10 m
▪ Advisory and long-term capital
▪ Investments between $200-800m
▪ Time horizon 8-12 years
Isomer Capital I Europe 2015 ▪ Fund of Venture Capital funds € 7.5 m
▪ 10-15 VC funds in Europe
▪ Exposure to over 400 highly innovative early-stage
companies
ICONIQ Strategic Global 2018 ▪ Growth Capital fund $ 12 m
Partners IV ▪ Global scope
▪ Focus on enterprise software companies
Connect Ventures III Europe 2019 ▪ Early stage Venture Capital £1m
21Other assets
Other assets
38%
Private Equity Financial
8% investments,
trading & To be deployed for strategic investments in portfolio companies and
liquidity
27%
private equity
Portfolio
Companies
37%
Other
Participations Includes mainly a 9.5% stake in Jaggaer (NAV value aligned with that of the
8%
sale agreement with Cinven, expected to be completed in 3Q 2019)
Listed Real Estate &
Participations Other Financials 2018 ($m):
17% 3%
Revenues (YoY % var.)
Sector
EBITDA adjusted (% margin)
NFP
236 (+4%)
E-procurement 90 (38%)
340
Note: as of June 30, 2019
22Net Asset Value per Share development
NAV per share and NAV discount evolution
40 37,9 37,9 50%
36,8 46,3% 35,5
34,1 33,7 33,9 44,0%
35 35,4 46,6% 45%
38,5% 42,9% Current
30 38,3% 40%
discount(1)
34,6% 35,2%
25 24,1 35%
20,7 21,2
21,0 20,3 20,2
23,0 18,2
20 30%
15 25%
10 20%
31/12/2017 31/03/2018 30/06/2018 30/09/2018 31/12/2018 31/03/2019 30/06/2019 31/07/2019
NAV per share (€) Price per share (€) NAV discount (%)
(1) assumed NAV equal to NAV as of June 30, 2019
▪ NAV is calculated excluding the value of the treasury shares and according to the following methodologies for each of the main
asset class:
▪ Listed participations: value at market price at each reference date
▪ Non-listed participations (portfolio companies): at financial year-end valuation by an independent expert based on
market multiples or other methodologies; valuation will be also updated on the basis of June interim report
▪ Private equity investments: valued at NAV of each fund updated every quarter
23INDEX
Italmobiliare: Overview
Investment Portfolio
Focus on portfolio companies
Closing remarks
Appendix
24Portfolio companies: Caffè Borbone (60%)
Company profile
Caffè Borbone, headquartered in Caivano (Naples), is one of the main producers of single-serve coffee being the
third player in Italy after Lavazza and Nespresso in that segment, and the market leader for capsules compatible
with Lavazza® and Nestlé Nespresso® and Nescafé Dolce Gusto® systems*, thanks to the excellent price / quality
ratio
Over the last years, Caffè Borbone has achieved an impressive growth supported by its focus on the fastest-growing
segment of coffee capsules and pods – an innovation that has changed consumer habits – whose volumes in Italy
grew by around 13% in the first half of 2019
Caffè Borbone has gradually developed a strong brand awareness at a national level with further growth potential
in the North of Italy, in the modern trade channel, and abroad, where the company has still a limited presence
*All registered trademarks, product designations or brand names used in this document are not owned by Caffè Borbone nor by any company associated with it
Products Key financials
Pods Capsules compatible with Lavazza and (€ m) 2015 2016 2017 2018 1H19
Nestlé (Nespresso and Dolce Gusto) Revenues 48.3 71.9 93.6 135.2 85.9
systems YoY % var. +35.2% +49.0% +30.2% +44.4% +28%
EBITDA 9.2 16.2 20.3 33.7 25.1
% margin 19.0% 22.5% 21.7% 24.9% 29.2%
YoY % var. +76% +26% +64%
Net income 5.8 10.5 13.7 16.5 14.0
Coffee beans Moka coffee
Capex 4.0 2.0 4.4 5.4
Net debt (cash) (7.7) (15.3) (27.3) 51.2(1) 46.5
Note: FY 2015-2017 drawn up in accordance with Italian accounting
standards and from 2018 in accordance with IFRS
(1) Increase due to inclusion of acquisition financing Distributed €8m of
dividends in 1H19
25Portfolio companies: Tecnica Group (40%)
Company profile Brands and products
Tecnica Group, is the main Italian group active in the
sport sector being the leading manufacturer of
outdoor footwear and ski equipment
The group has collected a portfolio of brands that
includes some of the industry’s historic names: Tecnica
(ski boots and footwear), Nordica (skis and boots),
Moon Boot (footwear), Lowa (trekking shoes), Blizzard
(skis) and Rollerblade (inline skates)
Tecnica is a multinational group that generates more
than 90% of its sales abroad and its production plants
are located in Germany, Austria, Hungary and Ukraine
Revenues breakdown Key financials
By geography By product type (€ m) 2015 2016 2017 2018 1H19
Moon Other
Italy Boot and 4% Revenues 333.2 341.2 368.0 398.5 149.3
RoW 7% skates YoY % var. +2.4% +7.9% +8.3% +5.9%
28% 10%
Trekking EBITDA 22.6 28.0 31.4 37.7 n.m.
and % margin 6.8% 8.2% 8.5% 9.5%
outdoor
shoes
49% Net income(1) (1.0) (0.8) 0.9 5.4 n.m.
Ski
equipment Capex 9.2 8.7 10.0 11.7
Europe 37%
65% Net debt (cash) 172.1 170.7 125.6 113.4 154.9
Note: 2018 data (1) Excluding minorities Lower margins in the first half due Increase mainly
to business seasonality due to adoption
of new IFRS16
26Portfolio Companies: Iseo Serrature (40%)
Profile Product portfolio
Electronic and digital
Iseo Group, headquartered in Pisogne (Brescia, Mechanical products
solutions
Northern Italy), is one of the main European producers
of mechanical, mechatronic and digital solutions for
access control and security
Since 2010, the Group has developed digital solutions
and innovative security systems for access control Cylinders Locks Verrou
thanks to proprietary software and firmware, and
opened a dedicated research center
Iseo is the second player in the Italian market (13%
market share) and has developed a significant
presence abroad – also through acquisitions – in
Panic Door Padlocks
France, Germany, Spain and Middle East devices closers
Home Building
automation automation
Revenues breakdown Key financials
By geography By product type (€ m) 2015 2016 2017 2018 1Q19
RoW Electronic
France
+ Locken Revenues 126.0 139.7 143.5 137.7 35.9
16% 28%
14% YoY % var. +10.8% +2.7% -4.0% +0,8%
EBITDA 14.1 17.2 17.9 14.3 3,3
Rest of EU
19%
% margin 11.2% 12.3% 12.4% 10.4% 9,2%
Group net 3.9 5.2 5.7 4.1 0.7
income
Germany Italy
25% Mechanical
12% Capex 5.2 4.7 6.5 7.2
86%
Note: 2018 Data
Net debt (cash) 22.5 25.7 26.6 30.4 35.7
Increase mainly due to
seasonality of the business 27Portfolio companies: Sirap (100%)
Company profile Geographical presence
Sirap is one of the main producers of fresh food
packaging in Europe, offering rigid containers in XPS
(polystyrene foam), PET and PP (polypropylene) for all
food applications for industry and retail clients
Sirap has an international presence with 12 production
plants, sales companies and warehouses in 18
European countries
At the beginning of 2018, to consolidate its position in
the rigid packaging industry, Sirap has made four Production plants
acquisitions in UK, Germany, France and Spain Trading companies
Revenues breakdown by country Key financials
Extra UE (€ m) 2015 2016 2017 2018 1H19
4%
Revenues 233.8 207.3 207.1 275.1 135.6
Italy YoY % var. -11.3% -0.1% +32.8% -0.4%
31%
EBITDA 20.9 20.5 15.0 16.3 8.3
% margin 8.9% 9.9% 7.2% 5.9% 6.1%
UE
48% Net income (17.1) 6.2 2.3 6.3 (0.8)
Capex 10.7 10.6 12.6 6.5
France
17% Net debt (cash) 58.7 65.5 67.2 82.3 94.8
Integration of companies Increase mainly
Disposal of a division
Note: 2018 data gross of IC eliminations acquired at the due to adoption
beginning of 2018 of new IFRS16
28Portfolio companies: Italgen (100%)
Company profile Geographical presence
Italgen is a producer and distributor of electricity from
renewable energy sources, it manages 17 hydropower
plants and over 300 km transmission lines in northern
Italy and has a significant stake in two wind farms in
Bulgaria (18 MW)
In the last decade Italgen has also developed
international renewable energy projects in Egypt,
Morocco and Turkey
Italgen is strongly committed to sustainability, it
operates in full compliance with the environment and
has obtained the most relevant certifications: ISO 9001,
14001 and EMAS (Eco Management Audit Scheme).
KPIs Key financials
(€ m) 2015 2016 2017 2018 1H19
▪ Energy sales: 334 GWh/year
Revenues 58.7 49.0 37.8 36.0 16.3
▪ Renewable energy production: 289 GWh/year YoY % var. n.m. n.m. n.m. -7.6%
EBITDA 14.2 7.0 6.2 8.4 5.0 Low
▪ Availability rate: 96% rainfall
% margin 24.2% 14.3% 16.4% 23.5% 30.8% in 1Q19
▪ Equivalent households potentially supplied by Net income 6.7 0.3 1.3 0.4 2.5
Italgen: 100,000
Capex 6.1 6.4 2.5 3.4
▪ Avoided CO2 emissions: 118,059 Tons/year Net debt (cash) 26.7 17.0 17.9 21.0 28.3
The trend of revenues is due to the switch from final to wholesale
clients that reduced transport rebates with limited effect on margins Distributed €6m of
dividends in 1H19
29Portfolio Companies: Gruppo Autogas (~27%)
Profile Transaction structure
Autogas Nord Group (AGN) - based in Genoa - operates AGN financed the acquisition of Lampogas partly through a
mainly in Italy in the distribution of LPG gas for domestic use €60m capital increase subscribed by Italmobiliare and partly
(small tanks, meters, small networks), commercial, and through bank financing. Italmobiliare will hold approx. 27% of
industrial uses the combined entity
In addition, the Group has gradually diversified its business,
exploiting a loyal customer base for cross-selling other Autogas
products (electricity and natural gas) and services shareholders
(consultancy for efficiency)
In line with its strategy of market consolidation, and with the
support of Italmobiliare, AGN in November 2018 has ~73% ~27%
acquired Lampogas Group, another leading Italian operator Autogas Nord
active in the sale of LPG, almost doubling its size and 100%
becoming the second player in the Italian market
The sector in Italy is stable and highly fragmented, with Lampogas
further opportunities of consolidation
Revenues breakdown Key financials (pro forma)
Autogas Nord Lampogas (€ m) 2018 1H19
Natural gas E nergy efficiency
GPL
Gruppo Autogas Nord 289.1
7% 1%
Electric energy wholesale Lampogas 237.1
7%
LPG
58%
Revenues 526.2 271.0
vehicles
GPL retail
YoY % var. +4.4%
3%
LPG retail 42%
48%
LPG EBITDA 35.7 27.9
wholesale % margin 6.8% 10.3%
34%
Net debt (cash) 137.2 136.4
Note: 2017 data
Distributed €4m of
dividends in 1H19
30Portfolio companies: Clessidra SGR (100%)
Profile Investment Strategy
Clessidra SGR is the leading manager of Private Equity funds
exclusively dedicated to the Italian market through the
funds Clessidra Capital Partners, Clessidra Capital Partners II
and Clessidra Capital Partners 3, where Italmobiliare is the
anchor investor
Since inception in 2003, Clessidra completed 25 transactions
with an aggregated EV of € 18 bn and equity of € 1.8 bn
(equity average € 80 m per transaction) and 17 add-ons to
the portfolio companies
Funds under Management Key indicators
Currently managed funds 2
Current flagship fund CCP 3
Assets Under Management
approx. € 2.5 bn
over time
# of investments 25
4
5 # of add-on 17
31INDEX
Italmobiliare: Overview
Investment Portfolio
Focus on portfolio companies
Closing remarks
Appendix
32Closing remarks
A unique opportunity to invest in the leading investment holding in Italy
1 Largest listed investment holding focused on the Italian market by asset base
2 Great business network, thanks to over 150 years of activity on the business community
Attractive market fundamentals: Italian companies are underpenetrated by institutional investors and
3 capital markets
4 Long-term investor approach and focus on operational improvement as value creation mantra
Reputable brand within the Italian entrepreneurs community: full coverage of Italian entrepreneurship
5 spectrum with a one-stop shop approach is a deal sourcing competitive advantage
6 Significant cash flow generation of Italmobiliare asset base and growth potential
Proven and experienced management team, with long-term incentives scheme based on NAV and
7 share price performance
Dividend play Growth opportunities Innovative investment platform
33INDEX
Italmobiliare: Overview
Investment Portfolio
Focus on portfolio companies
Investor relations action plan and closing remarks
Appendix
34Italmobiliare group exit track record since 2011
Date Asset Transaction description
Sept-15 ▪ Sale of 100% of Finter Bank to Vontobel
▪ Italmobiliare proceeds: CHF 85 m (o/w CHF 10 m in Vontobel shares)
2015-2016 ▪ Sale to HeidelbergCement for a total EV: € 7 bn
▪ Italmobiliare proceeds: € 1,7 bn (o/w € 0,9 bn in cash and € 0,8 bn in
HeidelbergCement shares equal to a 5.3% stake)
Mar-17 ▪ Clessidra CCPIII exit
▪ Proceeds: € 245 m
Jul-17 ▪ Clessidra CCPII exit
▪ Proceeds: € 152 m
Aug-17 ▪ Clessidra CCPII exit
▪ Proceeds: € 102 m
Aug-17 ▪ Clessidra CCPII exit
▪ Proceeds: € 86 m
Oct-17 ▪ Clessidra CCPII exit
▪ Proceeds: € 170 m
Nov-17 ▪ Sale of Jaggaer (backed by Accel-KKR) for an EV of € 184 m
▪ Italmobiliare proceeds: € 120 m (o/w € 35 m in Jaggaer shares equal to a 9.5%
stake)
2017-2018 Italmobiliare non-core ▪ Disposal of non-core assets (e.g. real estate assets and stake in Banca Leonardo)
assets
Apr-19 ▪ Clessidra CCPIII exit
▪ IPO
Jul-19 ▪ Sale of ITM 9.5% stake in Jaggaer alongside Accel-KKR to Cinven
▪ Italmobiliare proceeds: approx. $ 100 m
35Portfolio strategy: Italmobiliare positioning
Minority/ Majority/
Listed Listed
Listed
Listed/
unlisted
stakes ratio
(weighted
for NAV)
50/50
Unlisted Minority/ Majority/
Unlisted Unlisted
Non-Controlling 50/50 Controlling
Majority or controlling stakes:
>50% for unlisted
>25% for listed
36Italmobiliare investment team activities
Overview of investment Opportunities
Summary of the activities of the last 12 months Current pipeline and investment opportunities
▪ Investments in complementary and
Dossier screened: >100 diversified sectors with respect to
the current portfolio and
INVESTMENT
characterised by stability and low
STRATEGY
cyclicality
Dossier analyzed: ~20
▪ Research of targets with high
technological content, strong
Non binding offers: 12 brands or leadership positions
▪ Potentially even larger investment
targets
Due Diligence: 5
▪ Add-on investments for portfolio
companies
Closed transactions: 4
Several investment opportunities are
being studied in different sectors,
CURRENT
▪ Different opportunities are still on-going and in including:
PIPELINE
different state of progress ▪ Industrial non cyclical
▪ Domotics/high tech
▪ Food
▪ Skincare
37Consolidated Balance Sheet
31 December 31 December
(€m) 30 June 2018 30 June 2019
2017 2018
Non-current assets 995.2 1,213.7 1,206.2 1,242.6
Current-assets 681.6 593.3 554.7 666.3
Discontinued
5.6 6.0 6.2 6.5
operations
Total assets 1,682.4 1,813.0 1,767.0 1,915.4
Shareholders equity 1,373.7 1,360.8 1,302.2 1,414.3
• Group 1,373.3 1,265.8 1,202.5 1,312.3
• Minorities 0.4 95.0 99.8 102.0
Non-current liabilities 152.6 216.9 266.0 292.0
Current liabilities 156.1 235.1 198.2 208.6
Liabilities related to
discontinued - 0.3 0.6 0.5
operations
Total liabilities 1,682.4 1,813.0 1,767.0 1,915.4
Net financial position 494.8 232.7 222.3 287.9
38You can also read