DE BEERS ANALYST SEMINAR 03.11.2014 - Anglo American
←
→
Page content transcription
If your browser does not render page correctly, please read the page content below
DE BEERS ANALYST SEMINAR
          03.11.2014

        The De Beers Group of Companies
        A member of the Anglo American plc group   © 2014 De Beers UK Limited. All Rights Reserved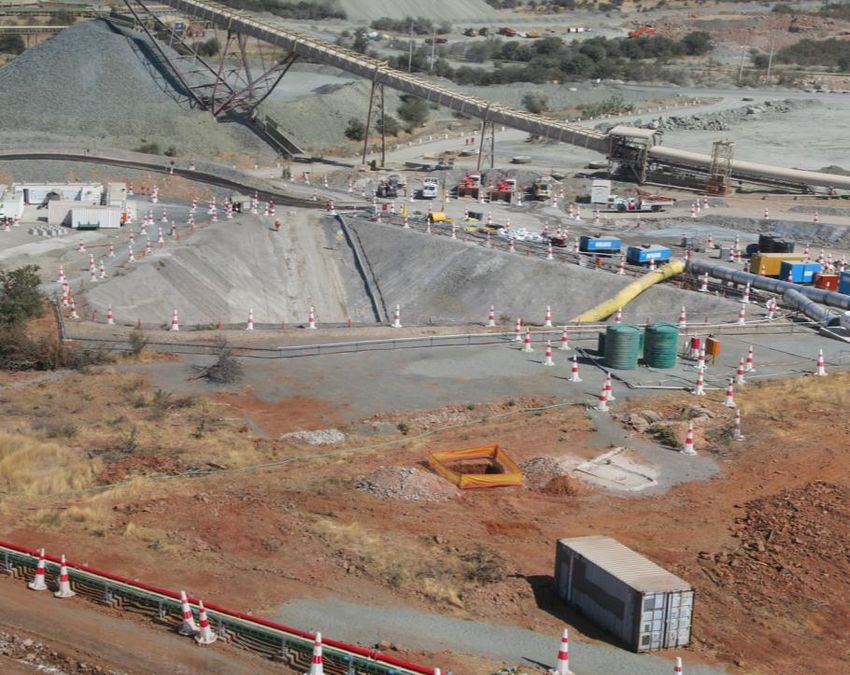
CAUTIONARY STATEMENT

Disclaimer                                                                                             development capabilities, recovery rates and other operational capabilities, the availability
This presentation has been prepared by Anglo American plc (“Anglo American”) and comprises             of mining and processing equipment, the ability to produce and transport products profitably,
the written materials/slides for a presentation concerning Anglo American.                             the impact of foreign currency exchange rates on market prices and operating costs, the
By attending this presentation and/or reviewing the slides you agree to be bound by the                availability of sufficient credit, the effects of inflation, political uncertainty and economic
following conditions.                                                                                  conditions in relevant areas of the world, the actions of competitors, activities by governmental
                                                                                                       authorities such as changes in taxation or safety, health, environmental or other types of
This presentation is for information purposes only and does not constitute an offer to sell            regulation in the countries where Anglo American operates, conflicts over land and resource
or the solicitation of an offer to buy shares in Anglo American. Further, it does not constitute       ownership rights and such other risk factors identified in Anglo American’s most recent
a recommendation by Anglo American or any other party to sell or buy shares in Anglo                   Annual Report. Forward-looking statements should, therefore, be construed in light of such
American or any other securities. All written or oral forward-looking statements attributable          risk factors and undue reliance should not be placed on forward-looking statements. These
to Anglo American or persons acting on their behalf are qualified in their entirety by these           forward-looking statements speak only as of the date of this presentation. Anglo American
cautionary statements.                                                                                 expressly disclaims any obligation or undertaking (except as required by applicable law, the
Forward-Looking Statements                                                                             City Code on Takeovers and Mergers (the “Takeover Code”), the UK Listing Rules, the
This presentation includes forward-looking statements. All statements other than statements            Disclosure and Transparency Rules of the Financial Services Authority, the Listings
of historical facts included in this presentation, including, without limitation, those regarding      Requirements of the securities exchange of the JSE Limited in South Africa, the SWX Swiss
Anglo American’s financial performance, business and acquisition strategy, plans and                   Exchange, the Botswana Stock Exchange and the Namibian Stock Exchange and any other
objectives of management for future operations (including development plans and objectives             applicable regulations) to release publicly any updates or revisions to any forward-looking
relating to Anglo American’s products, production forecasts and reserve and resource                   statement contained herein to reflect any change in Anglo American’s expectations with
positions), are forward-looking statements. Such forward-looking statements involve known              regard thereto or any change in events, conditions or circumstances on which any such
and unknown risks, uncertainties and other factors which may cause the actual results,                 statement is based.
performance or achievements of Anglo American, or industry results, to be materially                   Nothing in this presentation should be interpreted to mean that future earnings per share of
different from any future results, performance or achievements expressed or implied                    Anglo American will necessarily match or exceed its historical published earnings per share.
by such forward-looking statements.
                                                                                                       No Investment Advice
Such forward-looking statements are based on numerous assumptions regarding Anglo                      This presentation has been prepared without reference to your particular investment
American’s present and future business strategies and the environment in which Anglo                   objectives, financial situation, taxation position and particular needs. It is important that
American will operate in the future. Important factors that could cause Anglo American’s               you view this presentation in its entirety. If you are in any doubt in relation to these matters,
actual results, performance or achievements to differ materially from those in the forward-            you should consult your stockbroker, bank manager, solicitor, accountant, taxation adviser
looking statements include, among others, levels of actual production during any period,               or other independent financial adviser (where applicable, as authorised under the Financial
levels of global demand and commodity market prices, mineral resource exploration and                  Services and Markets Act 2000 in the UK, or in South Africa, under the Financial Advisory
                                                                                                       and Intermediary Services Act 37 of 2002).

                                                                                    The De Beers Group of Companies                                                                                   1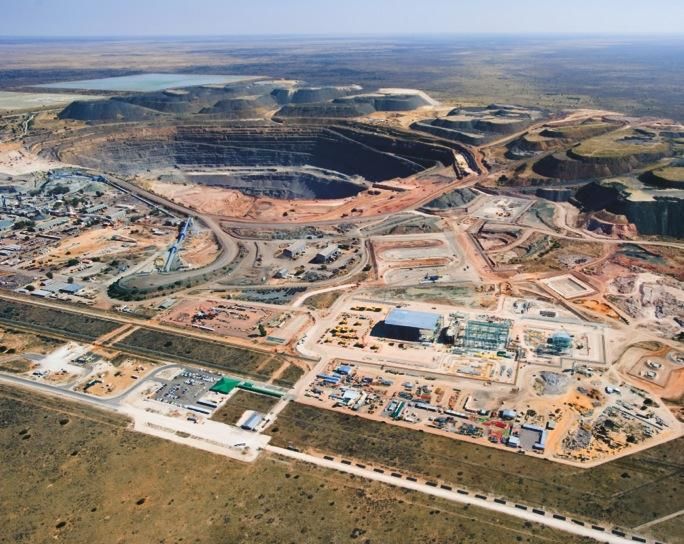
WELCOME

         Mark Cutifani,
Chief Executive, Anglo American
    and Chairman, De Beers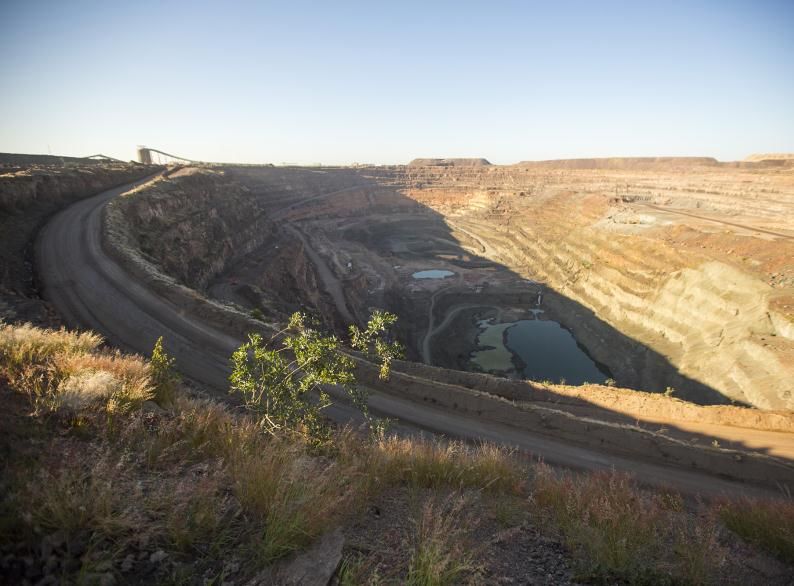
AGENDA

Welcome                              Mark Cutifani      3.30 – 3.35

Presentation                                            3.35 – 5.00
• Introduction and investment case   Philippe Mellier
• Industry overview                  Bruce Cleaver
• Company overview
 – Structure                         Philippe Mellier
 – Upstream                          Pat Lowery
 – Projects                          Pat Lowery
 – Midstream                         Bruce Cleaver
 – Downstream                        Philippe Mellier
• Financial overview                 Gareth Mostyn
• Summary                            Philippe Mellier

Q&A                                  Paul Galloway      5.00 – 5.30
Drinks reception                                        5.30 – 6.30

                                                        The De Beers Group of Companies   3
INTRODUCTION AND INVESTMENT CASE

            Philippe Mellier,
        Chief Executive, De Beers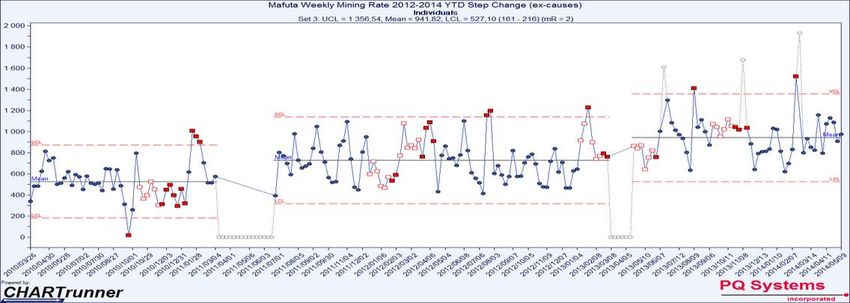
CONSUMERS’ DESIRE FOR DIAMONDS

                          “IN CONTRAST WITH PRECIOUS METALS
                       AND OTHER NATURAL RESOURCES INDUSTRIES,
                      WHICH RELY ON MULTIPLE SOURCES OF DEMAND,
                       THE DIAMOND INDUSTRY DERIVES PRACTICALLY
                        ALL ITS VALUE FROM CONSUMERS’ DEMAND
                                FOR DIAMOND JEWELLERY.”

Source: The Diamond Insight Report 2014

                                          The De Beers Group of Companies   5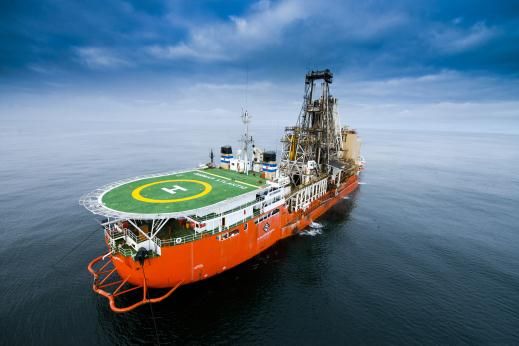
INVESTMENT HIGHLIGHTS

   Best-in-class mining assets

   •Positioned favourably on the cost curve, with long life reserve

   Attractive supply/demand fundamentals

   •Excellent supply/demand outlook in the industry
                                                                                                                                                    Positioned favourably on the cost curve (2020 projection)
   Strong partnerships

                                                                                                            Ratio of direct cash costs to revenue
   •Good relationship with the Government in Botswana – a partnership that is
    45 years old and thriving

   Leading trading platform

   •Highly successful distribution system to maximise the value of every carat sold, backed by
    industry-leading sorting and valuation technology

   Proven marketing capabilities

   •Unrivalled understanding of consumers across the world and leading brand position

   Advantageous exposure to late-cycle consumer demand

   •Main consumers in the US and China/India. China and India are well-positioned for growth and                                                                                   Source: De Beers Strategy estimates (FY 2020)
    future rapid expansion of middle classes

   Strong cash flow generation

   •US$1bn free cash flow generation in last 18 months

                                                                          The De Beers Group of Companies                                                                                                            6
DE BEERS’ STRATEGY ACROSS THE PIPELINE

Upstream                                          Midstream                                                            Downstream
Optimise core business                            Unique value proposition                                             Demand generation and future
                                                                                                                       growth platform

                                                       Rough                  Polished
   Exploration                                                                                           Jewellery        Jewellery
                               Mining               distribution            manufacturing                                                        Consumers
   and projects                                                                                        manufacturing        retail
                                                    and trading              and trading

Exploration and projects: Mining:                 Distribution:                                                        Downstream:
• In-house exploration    • Flexible operations   • Build the smartest                                                 • Support consumer preference for
• Accelerated               to maximise value       distribution system                                                  diamonds in main consumer markets
  exploration project       through the             to maximise the value                                                through branded propositions
  decision making           demand cycle            of each rough carat                                                • Consumer and trade intelligence
                          • Asset optimisation                                                                         • Better understanding of polished diamonds
                            across operations

                                                              Technology & Innovation: Talent & Leadership

                                                                     The De Beers Group of Companies                                                          7
INDUSTRY OVERVIEW

           Bruce Cleaver,
Executive Head of Strategy, De Beers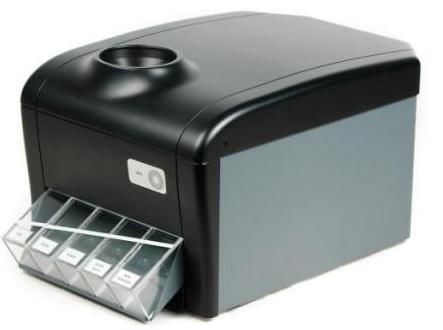
DIAMONDS ARE END-CONSUMER PRODUCTS:
POLISHED GEM DIAMONDS SET IN JEWELLERY ACCOUNT FOR 99% OF DIAMOND VALUE
Unlike demand for precious metals the                                                                                               Demand sources for diamonds             Same value,
only material driver of value for diamonds                                                                                          vs. gold and platinum – 2013          different volume
is end-consumer demand for jewellery                                                                             100%

                                                                                                                 90%
                                                                                                                                                               33%
                                                                                                                 80%
                                                                                                                                                   48%

                                                                                    % of total market by value
                                                                                                                 70%                                                    US$500,000
                                                                                                                 60%
                                                                                                                                                               21%
                                                                                                                 50%          99%
                                                                                                                                                    8%
                                                                                                                 40%                                           9%

                                                                                                                 30%                                                    US$500,000

                                                                                                                 20%                               44%
                                                                                                                                                               37%

                                                                                                                 10%
         Investment                               Jewellery                                                                   1%
                                                                                                                  0%
         Autocatalyst                             Industrial                                                              Diamonds                 Gold      Platinum   US$500,000

Source: The De Beers Group of Companies; World Gold Council 2014; Johnson Matthey

                                                                                                                        The De Beers Group of Companies                                      9
GROWTH IN DEMAND FOR DIAMONDS IS STRONGLY
CORRELATED WITH GROWTH IN ECONOMIC ACTIVITY
Polished diamond consumption vs. economic indices (1990 to 2013)
Indexed polished diamond consumption Indexed polished diamond consumption
vs. indexed real Gross Domestic Product (GDP) for the US vs. indexed real Personal Disposable Income (PDI) for the US
190 210
Indexed polished diamond consumption:
Indexed polished diamond consumption:
180
190
170
160
170
150
1990=100
1990=100
140 150
130
130
120
110
110
100
90 90
50 100 150 200 250 300 50 100 150 200 250 300
Indexed real GDP Indexed real PDI
Source: De Beers Group Strategy analysis
The De Beers Group of Companies 10THE US AND CHINA WILL REMAIN THE KEY MARKETS FOR DIAMOND
CONSUMPTION FOR THE FORESEEABLE FUTURE
2013A 2018F
ROW ROW
Total consumer Total consumer
22% 20%
demand US$25bn demand US$31bn
40% USA 40% USA
Gulf 7%
Gulf 8%
4%
6% Japan
Japan 9%
8%
India
16% 19%
India
Greater China¹ Greater China¹
Main trends:
• Global consumer demand is forecast to grow at an annual average of 4-5% in US$ nominal terms (2013A-2018F)
• The US is expected to remain the largest market for polished diamonds with roughly the same share by 2018 as in 2013
• Continued Asian and especially Chinese middle class growth should support demand growth for diamonds with Greater China¹
expected to account for approximately 19% of world total demand by 2018
• India is set to remain an important market but its trajectory is currently more uncertain
1. Greater China includes China, Hong Kong and Macau
Source: De Beers Group Strategy analysis
The De Beers Group of Companies 11PROJECTED GROWTH OF MIDDLE CLASSES IN EMERGING MARKETS SHOULD
SEE CONTINUED GLOBAL DEMAND GROWTH FOR DIAMONDS
Projected growth of middle classes in Number of projected additional middle class 99
emerging markets (% change 2013A-2018F) households in 2018F vs. 2013A (millions) 27
Brazil
27%
Russia
49%
22% 13
China 129% 10 11
40% 33% Turkey
6
6% 69% South Africa 4 5
27% 2
6% Mexico
8% 72%
164% Indonesia
16%
Brazil
South Africa
Russia
Turkey
Indonesia
India
China
USA
Mexico
India
• Total number of US households with annual income >US$35,000 approximately 100mn in 2013 (75% of US households)
• Middle class households in emerging markets defined as those with annual income >US$20,000, except in India where it is >US$10,000
Source: Oxford Economics
The De Beers Group of Companies 12IN 2013, APPROXIMATELY 146m CARATS (APPROXIMATELY
US$18bn IN VALUE) WERE MINED GLOBALLY
2013A rough diamond 2013A rough diamond
production by country (carats) production by company (value2)
All others
Informal/Artisanal
Zimbabwe 6% 5% 12%
33%
8% Russia Catoca
Angola 25% 6% De Beers Group
6% 33%
Zimbabwe3
4%
South Africa 5%
19%
7% Other Major/Junior 14%
Canada
19%
8% 26%
DRC1 5%
Australia 16% Rio Tinto 26%
Alrosa
Botswana
Total approx. 146 million carats Total approx. US$18bn
1. The 2013 Kimberley Process data shows a drop of approx. 27% in volume and 24% in value
reported from the DRC in 2013 v. 2012. This reported drop has not been reflected in the chart
2. All values estimated at De Beers SSV (Standard Selling Value)
3. Companies operating in the alluvial fields of Chiadzwa in Zimbabwe
Source: De Beers Group Strategy estimates
The De Beers Group of Companies 13PROJECTED GLOBAL ROUGH DIAMOND PRODUCTION
– McKINSEY FORECASTS
Million carats New projects
Expansions
Existing production
180
160
140
120
100
80
60
40
20
0
2012
2013
2014
2015
2016
2017
2018
2019
2020
2021
2022
2023
2024
2025
2026
2027
2028
2029
2030
Source: McKinsey & Company, Perspectives on the Diamond Industry, September 2014
The De Beers Group of Companies 14SUPPLY/DEMAND CURVE BASED ON McKINSEY FORECASTS
180
160
Demand forecast
Index base 100 in 2014
140
120
100
80 Production forecast
60
2014F 2015F 2016F 2017F 2018F 2019F 2020F 2021F 2022F 2023F 2024F
Source: McKinsey Global Institute; McKinsey & Company, Perspectives on the Diamond Industry, September 2014
The De Beers Group of Companies 15FUTURE INDUSTRY TRENDS
• Diamond production will decline slowly after 2020
• Producer governments will seek increased value chain participation
• Technology transforming all stages of the value chain
• Shifting needs of new consumers with increased importance of brands and ethical sourcing
• Importance of online channels in diamond purchasing consideration
• Competition from other luxury categories
• Undisclosed synthetics
The De Beers Group of Companies 16COMPANY OVERVIEW
Structure
Philippe Mellier,
Chief Executive, De BeersCOMPANY OVERVIEW
Ownership structure
Anglo American 85% Government of the Republic of Botswana 15%
De Beers
Operations Rough diamond sales Brands/retail
Exploration Production
Mining Supermaterials
Debswana Namdeb Element Six Global Auction Sales Forevermark De Beers
Global Canada South Africa Diamond Holdings Technologies² Sightholder (100%) (100%) Jewellers
Exploration1 (100%) (74%) Company (50%) (100%); Sales (100%) (50%)
(50%) Abrasives
(c.60%)
Namdeb Sightholder Sales
Diamond South Africa
Corporation (74%)
(land)
Wholly-owned or controlled
Debmarine DTC Botswana subsidiaries and divisions
Namibia (sea) (50%)
Joint ventures
1. Exploration is undertaken through a number of controlled subsidiaries of De Beers Namibia DTC
2. Element Six is made up of two businesses: Technologies, which is 100% (50%)
by De Beers, and Abrasives, which is c.60% owned by De Beers
The De Beers Group of Companies 18OVERVIEW OF OPERATIONS BY LOCATION
Botswana Namibia
• Debswana: 50/50 JV with the Government of the Republic of Botswana; • Namdeb Holdings: 50/50 JV with Government of the Republic
formed 1969 of Namibia; formed 1994
• Biggest producer in the Group: • Namdeb Holdings owns 100% of Namdeb (land) and Debmarine
Namibia (sea)
– Sales agreement to 2020
• Mining licences to 2035
– Mining licence to 2029
• Marine mining operations off the coast in depths of 80 – 130m
• Long-term relationship:
• Alluvial land operations conducted along the south-western coast
– Stretches back to 1969: one of the longest Public Private Partnerships
and inland areas
in the world
• Profits in Namdeb Holdings shared 50/50 post tax
– Previous sales agreements and licences have always been renewed
• Sendelingsdrif mine to be inaugurated this week
• Four open pit mines: Jwaneng, Orapa, Letlhakane and Damtshaa
• Namibia DTC: 50/50 local sorting, valuing and selling JV
• Produced 22.7 million carats in 2013
South Africa
• Harmonised pre-tax 80.8% (GRB)/19.2% (De Beers) profit share (all
• De Beers Consolidated Mines: 74% (De Beers) / 26% (BEE partner,
mines) under the 2006 Master Agreement with all licences to 2029
Ponahalo Holdings)
• DBGSS: 100% owned sales operation
• Three mining operations: open-pit mines of Venetia and Voorspoed,
• DTC Botswana: 50/50 local sorting and valuation JV and a tailings processing operation at Kimberley
• Sightholder Sales South Africa: local sorting and valuation operation:
74% (De Beers) / 26% (BEE partner, Ponahalo Holdings)
The De Beers Group of Companies 19COMPANY OVERVIEW
Upstream
Pat Lowery,
Executive Head of Technical, De BeersDIAMOND MINING OPERATIONS AND CARATS RECOVERED, 2013
Canada Botswana Namibia South Africa
100% owned Debswana Namdeb Holdings De Beers Consolidated
Established 1998 50/50 joint venture 50/50 joint venture Mines (DBCM)
with the Government with the Government 74/26 BEE Partnership
of the Republic of Botswana of the Republic of Namibia with Ponahalo Holdings
Established 1888
Carats recovered 2.0m Carats recovered 22.7m Carats recovered 1.8m Carats recovered 4.7m
A – Snap Lake C – Damtshaa G – Atlantic 1 L – Venetia
B – Victor D – Orapa H – Beach and Marine Contractors M – Kimberley
E – Letlhakane I – Elizabeth Bay N – Voorspoed
F – Jwaneng J – Mining Area 1
K – Orange River
The De Beers Group of Companies 21BOTSWANA
H1 H2 Total H1 H1 H2 Total H1
Jwaneng 2013 2013 2013 2014 Orapa 2013 2013 2013 2014
Waste (tonnes m) 45.9 58.0 103.9 58.5 Waste (tonnes m) 7.6 9.9 17.5 7.1
Ore mined (tonnes m) 3.5 4.6 8.1 5.0 Ore mined (tonnes m) 8.1 7.3 15.4 9.3
Tonnes treated (tonnes m) 3.4 4.4 7.8 3.9 Tonnes treated (tonnes m) 6.8 6.5 13.3 7.5
Carats recovered (carats m)1 5.2 5.2 10.4 4.9 Carats recovered (carats m)2 5.7 6.6 12.3 7.1
Average price (US$/ct, 100% SSV) 1 223 234 228 249 Average price (US$/ct, 100% SSV) 2 102 113 107 110
1 2
Grade (cpht*) 151 120 134 124 Grade (cpht) 84 102 92 95
• The richest diamond mine, by value, in the world • Orapa complex consists of Orapa, Letlhakane and Damtshaa mines,
• Tier 1 open pit mine, using traditional truck and shovel methods which are three separate open pit operations
• Current life of mine to 2031 (including Cut 8 and tailings retreatment) • Orapa mine is a Tier 1 operation that comprises one large pipe divided in
two volcanic conduits that coalesced over approximately 117ha
• Current life of mine to 2030
1. Bottom cut off 1.47mm including incidentals
2. Bottom cut off 1.65mm including incidentals
* Carats per hundred tonnes
The De Beers Group of Companies 22CANADA
H1 H2 Total H1 H1 H2 Total H1
Snap Lake 2013 2013 2013 2014 Victor 2013 2013 2013 2014
Waste (tonnes m) 0.1 0.1 0.2 0.1 Waste (tonnes m) 3.0 4.3 7.3 3.5
Ore mined (tonnes m) 0.5 0.6 1.1 0.5 Ore mined (tonnes m) 1.4 1.5 2.9 1.3
Tonnes treated (tonnes m) 0.5 0.6 1.1 0.5 Tonnes treated (tonnes m) 1.4 1.6 3.0 1.4
Carats recovered (carats m)1 0.6 0.7 1.3 0.6 Carats recovered (carats m)2 0.3 0.4 0.7 0.3
Average price (US$/ct, 100% SSV) 1 197 176 186 186 Average price (US$/ct, 100% SSV) 2 588 524 560 559
Grade (cpht) 1 119 111 115 120 Grade (cpht)2 22 23 22 24
• Canada’s first completely underground diamond mine, • Ontario’s first diamond mine (open pit)
located 220km northeast of Yellowknife • Located in James Bay Lowlands, 600km north of Toronto
• Current life of mine to 2028 • Current life of mine to 2018
1. Bottom cut off 1.14mm including incidentals
2. Bottom cut off 1.50mm including incidentals
The De Beers Group of Companies 23NAMIBIA
H1 H2 Total H1 H1 H2 Total H1
Debmarine Namibia 2013 2013 2013 2014 Namdeb 2013 2013 2013 2014
Area mined (square metres) 5.0 5.7 10.7 5.6 Waste (tonnes m) 18.5 14.8 33.3 19.1
1
Carats recovered (carats m) 0.6 0.6 1.2 0.6 Ore mined (tonnes m) 4.8 5.0 9.8 5.4
1
Average price (US$/ct, 100% SSV) 584 578 581 586 Tonnes treated (tonnes m) 5.6 5.4 11.0 6.1
Grade (cpm²)1 0.11 0.10 0.11 0.11 Carats recovered (carats m)2 0.3 0.3 0.6 0.3
Average price (US$/ct, 100% SSV)2 553 533 543 571
2
Grade (cpht) 5 6 6 6
• Fleet of five mining vessels in the Atlantic 1 concession • Marginal alluvial producer
area off the coast of Namibia • High US$/ct but relatively high cost due to alluvial nature of deposit
• Current life of mine to 2028
1. Bottom cut off 1.47mm including incidentals
2. Multiple bottom cut offs including incidentals
The De Beers Group of Companies 24SOUTH AFRICA
H1 H2 Total H1
Venetia 2013 2013 2013 2014
Waste (tonnes m) 17.4 12.4 29.8 21.7
Ore mined (tonnes m) 1.4 3.5 4.9 2.7
Tonnes treated (tonnes m) 2.7 2.8 5.5 2.9
Carats recovered (Carats m)1 0.9 2.3 3.2 1.4
Average price (US$/ct, 100% SSV)1 194 174 187 156
1
Grade (cpht) 33 82 58 47
• Venetia lies 90km west of Musina, in the Limpopo province
• Produced 3.2 million carats in 2013
• Current life of mine to 2044 (underground)
• Underground mine under construction
1. Bottom cut off 1.00mm including incidentals
The De Beers Group of Companies 25OPERATIONAL IMPROVEMENT INITIATIVE: JWANENG
• Sump installed to mitigate unseasonably high rainfall
• Rapid and effective recovery from 2012 slope failure
• Improvement plan in place from 2013 addressing both ore availability
from mining and plant performance
• Focussed programme of maintenance and operational interventions
to continue delivering improved plant performance
The De Beers Group of Companies 26OPERATIONAL IMPROVEMENT INITIATIVE: ORAPA
• Plant 1:
– Plant shutdown during 2013 for unplanned maintenance to
address structural concerns and other maintenance issues
– Plant performance in 2014 showing good improvement back
towards 2012 levels
• Plant 2:
– Improved OPU* performance at Plant 2 driven by focussed
maintenance and management interventions
– Benefit being derived from improved consistency of plant
operations and mine delivery
– Ongoing improvement planned to ensure plant operating
variability reduced
*OPU: Overall Plant Utilisation rate
The De Beers Group of Companies 27OPERATIONAL IMPROVEMENT INITIATIVE: MAFUTA
(DEBMARINE NAMIBIA)
Continuous
mining trial
port) Crawler change-
(unplanned return to
(Crawler change-out)
Main hoist failure
Planned in-port
out
Successes
• Significant maturing of the engineering design to provide maximum reliability and availability
• Optimisation of the crawler systems (pipe size, power, control) to increase mining rate and reduce waste
The De Beers Group of Companies 28EXPLORATION
Canada India Angola South Africa Botswana
88 licences granted Two licences for Advanced stage 13 licences granted Nine licences granted
for 116km2 754km2 awarded of negotiations for 794km2 for 6,204km2
by Ministry in Q3 for new licences
2014; awaiting state
government approval
The De Beers Group of Companies 29COMPANY OVERVIEW
Projects
Pat Lowery,
Executive Head of Technical, De BeersBOTSWANA: JWANENG MINE – CUT 8
Will extend the life of the open pit to approximately 2031
Background
• Waste to be mined: approximately 660 million tonnes
• Ore to be mined: 96 million tonnes1
• Carats from ore mined: 112 million carats1
• Average grade of 117 cpht1
• Infrastructure completed in 2013 within budget
– Capital cost: P3.1bn (US$0.4bn)
• First ore to plant: 2017
Progress to date
• Stripping of waste commenced in 2010
• Stripping of waste done by JV contract mining team, Majwe
• By the end of June 2014, 46% of the 500m tonnes of waste
stripping required to expose the ore had been stripped
1. Probable Diamond Reserve Estimates as at 31 December 2013: 27Mt; 26 Mct; 97 cpht
Scheduled Inferred Resource Estimates as at 31 December 2013: 69Mt; 86 Mct; 125 cpht
Due to the uncertainty that may be attached to some Inferred Mineral Resources, it cannot be assumed that all or part of an
Inferred Mineral Resource will necessarily be upgraded to an Indicated Resource after continued exploration.
The De Beers Group of Companies 31SOUTH AFRICA: VENETIA UNDERGROUND
The Venetia underground project will extend the life of South Africa’s largest
diamond mine to 2044
Background
• Ore to be mined: 128 million tonnes1
• Carats from ore mined: 94 million carats1
• Average grade of 73 cpht1
• Mining of the two main ore bodies below the final open pit will commence in
2021, ramping up to full production by 2024
• Expansion capital is around US$2bn
• Capex phasing: 2014 US$0.1bn; 2015 US$0.1bn
Progress to date
• 285m of decline tunnel have been advanced to date, and total tunnel
development including ancillary development is 320m
• Collars for both the production and services shafts have been completed
• The gantry crane for the pre sink on the production shaft is currently under
construction with pre-sinking planned to commence shortly
• First production remains on track for 2021 and the project is now around
12% complete
1. Probable Diamond Reserve Estimates as at 31 December 2013 : 68 Mcts; 91 Mt; 74 cpht
Scheduled Inferred Resource Estimates as at 31 December 2013 : 26 Mcts; 37 Mt; 71 cpht
Due to the uncertainty that may be attached to some Inferred Mineral Resources, it cannot be assumed that all or part of an
Inferred Mineral Resource will necessarily be upgraded to an Indicated Resource after continued exploration
The De Beers Group of Companies 32CANADA: GAHCHO KUE
Unincorporated JV: De Beers (51%); Mountain Province Diamonds (49%)
Located 80km southeast of Snap Lake
Background
• Ore to be mined: 31 million tonnes1
• Carats from ore mined: 48 million carats1
• Average grade of 154 cpht1
• Life of mine: 11 years1
• De Beers share of capex: approximately US$0.5bn (includes
pre-commercial production capex)
• Capex phasing: 2014 US$0.1bn; 2015 US$0.2bn
• Annual average production: 4.3 million carats (100%)
• First production: H2 2016
Progress to date
• Land Use Permit approved on 13 September 2014
• Ministerial approval of Water Licence received on
24 September 2014
1. Probable Diamond Reserve Estimates as at 31 December 2013
The De Beers Group of Companies 33COMPANY OVERVIEW
Midstream
Bruce Cleaver,
Executive Head of Strategy, De BeersINTEGRATED TWO-CHANNEL DISTRIBUTION SYSTEM TO SERVE
DIFFERENT CUSTOMER TYPES WITH DIFFERING NEEDS
Botswana Singapore
Global Sightholder Sales Auction Sales
• 10 Sights per year • Industry-leading online auction platform
• New three-year supply contract • Variety of auction types
2015-18, offering regular, planned • Introduction of Forward Contract Sales
supply to Sightholders enables customers to bid to secure
• New category of customer – future supply
Accredited Buyer – to be introduced
• More rigorous and transparent financial
compliance
• Increased bankability
The De Beers Group of Companies 35SALES AGREEMENTS
Botswana
• 10 year sales arrangement with Debswana and the Government of the Republic of Botswana (GRB), started in 2011
• Resulted in the transfer of international Sight activities to Gaborone in 2013
• Arrangement introduced for the first time a limited ‘window’ for GRB to purchase 10% rising to 15% of Debswana’s run of mine production
– currently at 13% for 2014
• Commitment to continue to support local beneficiation
Namibia
• Negotiations between the Government of the Republic of Namibia (GRN) and De Beers, for a new sales agreement for Namdeb Holdings’
production, are underway
• Current seven year sales agreement with Namdeb Holdings and GRN expired end 2013. Temporary extension in place while new
agreement negotiated
South Africa
• Long-term sales agreement between De Beers Consolidated Mines (DBCM) and De Beers
Canada
• Wholly-owned
The De Beers Group of Companies 36DE BEERS ROUGH DIAMOND CONVERSION CYCLE
Mine and Sorting and Aggregation
Total Pipeline
Process Valuation and Sale
16 – 20 weeks
3 - 5 weeks 8 - 10 weeks 5 weeks
Mine Sorting De Beers sales
• The time taken from when a rough diamond is extracted from the ground until it is sold to a consumer as set (polished) diamond jewellery is
typically around nine months
The De Beers Group of Companies 37BENEFITS OF AGGREGATION
Volatility in carat delivery by producing country
• Smooths out peaks and 100%
troughs in mining
• More consistent offering 80%
for more of the production
• Wider range of product 60%
Namibia
• Mitigates volatility
40% Canada
South Africa
20% Botswana
Aggregated Mix
0%
-20%
-40%
12 month period
The De Beers Group of Companies 38SCHEMATIC FLOW OF DIAMONDS AROUND THE GROUP
Global Sights (~90%) and Aggregated goods
Sights:
Auction Sales (~10%)
principally Botswana Unaggregated goods
De Beers Global
Global Sightholder
Sightholder Sales
Sales
13% GRB1 87%
Trading
Sightholder
DTC Botswana Namibia DTC
Sales South Africa
90% SDT2
10%
Mining
Debswana Namdeb Holdings DBCM Canada
1. GRB has the right to 10% of Debswana run of mine production in 2011, rising by 1% p.a. to 15% in 2016 and for the balance of the contract
2. DBCM sells 10% of run of mine production to the State Diamond Trader, in terms of SA diamond legislation
The De Beers Group of Companies 39SEASONALITY
Seasonality of consumer diamond jewellery acquisitions by main market
Monthly distribution of diamond jewellery acquisitions in percent
35
30 USA
25
20
15
China
10
India
5
0
Jan Feb Mar Apr May Jun Jul Aug Sep Oct Nov Dec
Engagements
Engagements Mother’s
USA Valentine’s Day Day
Wedding season Thanksgiving Christmas
New Year
India Wedding season Diwali/Wedding season
Chinese Golden Chinese Golden
China New Year Week Valentine’s Day Week
Source: De Beers Group commissioned research
The De Beers Group of Companies 40SAFEGUARDING CONSUMER CONFIDENCE
• Various companies have the ability to manufacture gem-quality synthetic
diamonds utilising different technologies (HPHT and CVD, principally)
• Trading in undisclosed or misrepresented gem synthetics risks damage to
consumer confidence, so accurate descriptions and clear disclosure are
fundamentally important
• De Beers has invested around US$65m to develop sophisticated detection
technology including DiamondSure™ and DiamondView™ that can readily
identify all types of gem synthetics
• Latest generation of technology from De Beers includes the Automated
Melée Screening device (AMS), to scan colourless and near-colourless
melée (small diamonds) quickly and cost-effectively
• With De Beers’ leadership, the industry has so far been successful in
safeguarding consumer confidence. Continual investment in developing and
deploying technology will be required to sustain that success in the future The AMS is a compact, automated version of
DiamondSure that enables 360 small stones
per hour to be tested completely automatically
The De Beers Group of Companies 41COMPANY OVERVIEW
Downstream
Philippe Mellier,
Chief Executive, De BeersTHE RISE OF BRANDS
US consumers who reported buying a
branded diamond engagement ring (%)
36
22
7
2002 2011 2013
Source: The Diamond Insight Report 2014
The De Beers Group of Companies 43FOREVERMARK
• A diamond brand from De Beers that comes with a promise that the diamonds
are beautiful, rare and responsibly sourced
• Diamonds are inscribed with the Forevermark icon and a unique identification
number (both are invisible to the naked eye)
• Launched in the core markets of China, Japan and Hong Kong in 2009, India
and the US in 2011 and in Turkey and Botswana in 2014
– Available in over 1,450 retail stores across 34 markets (30% increase in
doors YOY)
– >400 retail stores in US; >500 in Greater China
– Over one million diamonds inscribed to date
– Over 420,000 diamonds graded to date
• Strong growth in the last year, with revenue up c.50% YOY
• Primary mechanism for De Beers diamond marketing, reinforcing the emotional
symbolism of diamonds and addressing synthetic and ethical risks
• Provides deeper insight into polished/retail markets
The De Beers Group of Companies 44DE BEERS JEWELLERS
• High-end luxury retail joint venture with LVMH (50/50) Geographic store split as of end of June 2014
• 34 stores in 15 key diamond markets around the world (of which 13
are franchised)
Europe
• Business focused on Asia and Asian clients outside Asia
• Increasing importance of Chinese clients, after brand launched in 24%
mainland China in 2011. 27% of total retail sales occurred in Greater
China1 in H1 2014; however, 49% of total global sales come from
Asia 52%
Greater China clients globally (whether buying in China or abroad)
• Core business in solitaires and high jewellery, with an increasing focus 15%
North America
on design collections
• Creation of the JV led to increased advertising by other high-end brands
9%
Middle East
1. Greater China includes China, Hong Kong and Taiwan
The De Beers Group of Companies 45ELEMENT SIX
• World’s leading synthetic diamond US$m FY H1
supermaterials company 2013 2014
• Global leader in design, development Revenue 439 240
and production
EBITDA * 63 46
• Over 50 years’ experience
(Margin %) (14%) (19%)
• Supply ~20,000 unique products to
~5,000 global customers Underlying operating profit * 37 34
(Margin %) (8%) (14%)
* Excluding the impact of PPA adjustments
Abrasives
Technologies
Precision Applications Performance Tools
• High Pressure High Temperature synthesis of • Tungsten carbide sintering for hard-metal • Chemical Vapour Deposition diamond for applications
synthetic diamond and cubic boron nitride (CBN) tooling applications beyond hardness and HPHT synthesis of single-crystal
grits, powders and polycrystalline discs • HPHT synthesis of synthetic diamond grit diamond for abrasive applications
and polycrystalline cutters
The De Beers Group of Companies 46FINANCIAL OVERVIEW
Gareth Mostyn,
Finance Director, De BeersGROUP STRUCTURE FROM AN ACCOUNTING PERSPECTIVE
Upstream
100% 100% 19.2% 50%
De Beers Canada De Beers Debswana2 Namdeb Holdings3
Consolidated
Mines (DBCM)1
Midstream
100% 100% 50% 50%
De Beers Global De Beers Auction Sales Partner Diamond Trading Companies3
Sightholder Sales
Downstream and Element Six
50% 100% c.60% 100%
De Beers Jewellers4 Forevermark Element Six Abrasives5 Element Six Technologies
1. Full consolidation; 26% minority held by BEE shareholder (Ponahalo), but fully consolidated due to financial arrangements. No minority interest accounted for
2. Debswana pays income tax and royalty in Botswana, albeit the profit share mechanism is calculated on a pre-tax basis. Master agreement grants De Beers 19.2% of all
pre-tax profit. Proportionate consolidation of 19.2% with nil tax and royalty
3. Proportionate consolidation
4. Equity accounted
5. Full consolidation, with c.40% minority interest of Umicore SA provided for
The De Beers Group of Companies 48FINANCIAL OVERVIEW – FY 2013 AND H1 2014
Income statement Balance sheet
US$bn H1 H2 FY H1 US$bn FY H1
2013 2013 2013 2014 2013 2014
Revenue 3.3 3.0 6.3 3.8 Fixed Assets and Intangible Assets 4.9 5.1
of which, rough diamonds 3.0 2.8 5.8 3.5
Diamond Inventory 1.1 1.2
Underlying operating profit 0.6 0.4 1.0 0.8
Margin % 18% 15% 16% 20% Other (1.2) (1.3)
EBITDA 0.8 0.7 1.5 1.0 Total Capital Employed 4.8 5.0
Margin % 24% 22% 23% 26%
Underlying Earnings 0.3 0.2 0.5 0.5 Return on Capital Employed pre PPA* 22% 26%
PPA uplift on Capital Employed 2.9 2.8
Cash flow statement Return on Capital Employed post PPA* 11% 13%
US$bn H1 H2 FY H1 * RoCE calculated on a trailing twelve month basis. Shown before and after the impact of the Anglo
2013 2013 2013 2014 American acquisition adjustment (PPA – Purchase Price Allocation)
Cash available from operations 0.6 0.5 1.1 0.7
Cash flow consumed by (0.3) (0.2) (0.5) (0.3)
investing activities
Free cash flow 0.3 0.3 0.6 0.4
The De Beers Group of Companies 49PRICING AND MIX
Strong US demand/midstream restocking drove H1 2014 revenue Index prices up 7% in H1 2014…
US$m +15%
160 2013 2014
3,788 155
3,297 +7%
3,018 299 150
Other 252 +2%
266
145
Rough
diamond 3,045 3,489 140
2,752
sales 135
130
H1 H2 H1
10 1 2 3 4 5 6 7 8 9 10 1 2 3 4 5
2013 2013 2014
Overall average realised price was down 3% in H1 2014
Carats sold by De Beers
(4% vs H1 2013), driven by mix
19.0 US$/ct - Realised
Mct -3% -3%
Consolidated
201 198
15.4 195 192
14.3 18.1
15.2
14.1
H1 H2 H1 H1 H2 FY H1
2013 2013 2014 2013 2013 2013 2014
The De Beers Group of Companies 50STRONG PRODUCTION UPLIFT SUPPORTS HIGHER SALES VOLUMES
Production up 12% driven by Debswana and South Africa… …with production particularly strong in Q1 vs. prior year
Mct 2013 2014
Mct 9.1
7.9 8.5 8.2
7.8 7.5
H1 6.4
10.9 1.6 0.9 14.3
2013
0.9
H2
11.8 3.1 1.1 16.9 +12%
2013 Q1 Q2 Q3 Q4 Q1 Q2 Q3
0.9
Higher
Mct sales supported by increased production in H2 2013 and H1 2014
H1
12.0 2.1 1.0 16.0
2014
Production External sales (100%)
0.9 19.0
0.4 0.4 Mct 16.9
15.4 16.0
14.3 14.3
Q3
6.2 1.1 8.2 FY Guidance
2014
2014: c.32Mct
2015: 32-34Mct
Debswana DBCM Namdeb Canada
H1 H2 H1
2013 2013 2014
The De Beers Group of Companies 51UNIQUE BLEND OF MINING AND TRADING EARNINGS STREAMS
Illustrative cases
De Beers earns a margin on
the sale of diamonds from Debswana – data is illustrative only
its wholly-owned and JV
mining operations
JV non-consolidated margin
De Beers then earns an Trading consolidated margin
additional fixed margin from Mining consolidated margin
the sorting, aggregation and
onward sale of diamonds
to its customers
Mining Local DTC DBGSS Consolidated
DBCM – data is illustrative only
Mining Local DTC DBGSS Consolidated
The De Beers Group of Companies 52OVERVIEW OF OPERATING MARGINS (FY 2013)
The Group operating margin is a blend of 220 45
mining and trading margins ~40%
200 40
Margin (US$/carat) (left axis)
180
In 2013, the average margin from Mining Cost (US$/carat) (left axis) 35
160
was ~40% (based on De Beers’ Operating margin % (right axis) 30
consolidated share) 140
120 25
%
On top of this was a Trading margin of ~6% 100
~16% 20
E6,
80 Downstream,
15
PPA and Other
Taking this mix of margin, together with the 60
other elements of the business, the overall ~6% 10
40
profit margin in 2013 was ~16% 5
20
0 0
Mining Trading Group Operating Profit
FY 2013 US$bn Mining Trading E6, Downstream, PPA and Other Group
Underlying operating profit 0.9 0.3 (0.2) 1.0
The De Beers Group of Companies 53OVERVIEW OF INCOME STATEMENT
US$bn H1 H2 FY H1
• De Beers’ revenue is made up of: 2013 2013 2013 2014
– The sale of rough diamonds to clients, mostly Sightholders, Revenue 3.3 3.0 6.3 3.8
from mines that De Beers either wholly owns, controls or Rough diamond sales 3.0 2.8 5.8 3.5
operates in JV with a government Element Six 0.2 0.2 0.4 0.2
Other 0.1 0.0 0.1 0.1
– Element Six sales
– A small amount of ancillary revenue Production costs (0.6) (0.6) (1.2) (0.7)
Purchases of diamonds (1.7) (1.4) (3.1) (1.9)
• Costs include the production cost of mining carats that flow Depreciation and amortisation (1) (0.2) (0.2) (0.4) (0.2)
from De Beers’ consolidated share of mining companies in Marketing, overheads and other (0.2) (0.4) (0.6) (0.2)
the Group, together with the cost of purchasing diamonds
from JV partners Underlying Operating profit 0.6 0.4 1.0 0.8
• As a result of the way we account for Debswana, the effective Operating profit margin on sales % 18% 15% 16% 20%
tax rate of De Beers is lower than it otherwise would be
EBITDA 0.8 0.7 1.5 1.0
EBITDA margin on sales % 24% 22% 23% 26%
Underlying Earnings 0.3 0.2 0.5 0.5
Note: Debswana pays income tax and royalty in Botswana, albeit the profit share mechanism is calculated on a pre-tax basis
(1) Includes Purchase Price Allocation depreciation and amortisation (FY 2013 - $145m , H1 2014 - $71m)
The De Beers Group of Companies 54OVERVIEW OF CAPITAL EXPENDITURE
Capex overview
US$m Stay In Business (SIB) Waste Expansionary
GUIDANCE
H1 2013 123 116 17 256 FY2014 ~US$700m
FY2015 ~US$800-900m
H2 2013 131 93 71 295
H1 2014 104 110 106 320
Waste capitalised driven by Venetia Projects are ramping up
9 21
US$m US$m
H1 2013 65 16 35 116 H1 2013 17
H2 2013 50 22 21 93 H2 2013 49 10 71
H1 2014 61 24 25 110 H1 2014 47 54 106
Venetia Jwaneng Other Venetia UG Gahcho Kué Other
The De Beers Group of Companies 55SPOTLIGHT ON DE BEERS GROUP FREE CASH GENERATION
US$m Debswana cash flow
1,298
• Debswana distributes its profits
551
after certain appropriations
625
(including capital expenditure
FY 164
2013 and working capital funding
42 requirements) to its shareholders,
De Beers and the Government
of Botswana
Cash generated Capex Tax paid Other FCF FY 2013 • De Beers receives its 19.2%
from Operations share via dividends. GRB receives its
80.8% share via royalties, tax and
843 dividends
• De Beers’ dividend amounted to
320 US$405m for FY 2013 and $311m
for H1 2014
431
H1 105
2014 13
• The Debswana profit stream converts
readily to cash. Debswana typically
remits 10 dividends annually
• Debswana is self-financing in terms
Cash generated Capex Tax paid Other FCF H1 2014 of both capex and working capital
from Operations
The De Beers Group of Companies 56SUMMARY
Operating profit EBITDA
US$m 1,003
US$m
1,451
0
432
+34%
H2 663 +25%
765
983
571 788
H1
FY H1 FY H1
2013 2014 2013 2014
Free Cash Flow ROCE
625 26%
US$m
+47% 0 Pre PPA 22%
331
15%
431
15%
294 Post PPA 13%
11%
FY H1 FY H1 Target
2013 2014 2013 2014 (2016)
The De Beers Group of Companies 57SUMMARY
Philippe Mellier,
Chief Executive, De BeersINVESTMENT HIGHLIGHTS
Best-in-class mining assets
Positioned favourably on the cost curve (2020 projection)
•Positioned favourably on the cost curve, with long life reserve
Ratio of direct cash costs to revenue
Attractive supply/demand fundamentals
•Excellent supply/demand outlook in the industry
Strong partnerships
•Good relationship with the Government in Botswana – a partnership that is
45 years old and thriving
Leading trading platform
•Highly successful distribution system to maximise the value of every carat sold, backed by
industry-leading sorting and valuation technology
Proven marketing capabilities Source: De Beers Strategy estimates (FY 2020)
•Unrivalled understanding of consumers across the world and leading brand position
• On track to meet ROCE target in 2016
Advantageous exposure to late-cycle consumer demand • Gahcho Kué will enhance ROCE from 2017
•Main consumers in the US and China/India. China and India are well-positioned for growth and
• Longer term outlook enhanced by Cut-8 and Venetia
future rapid expansion of middle classes Underground projects
• Supply/demand outlook underpins strong
Strong cash flow generation fundamentals
•US$1bn free cash flow generation in last 18 months • Iconic brand
The De Beers Group of Companies 59Q&A
APPENDIX
DIAMOND RESOURCE AND RESERVE ESTIMATES AS AT 31 DECEMBER 2013

                     Selected De Beers Assets                                                            INCLUSIVE                                                               Diamond Reserve Estimates
                                                                                                Diamond Resource Estimates                                                        as at 31 December 2013
                                                                                                  as at 31 December 2013
                                                                               Tonnes               Carats              Grade                BCO1              Treated             Saleable           Recovered               BCO             LOM years
                                                                                (Mt)                 (Mc)               (cpht)               (mm)              Tonnes               Carats              Grade                (mm)
                                                                                                                                                                 (Mt)                (Mc)               (cpht)
  Snap Lake (UG)1: Indicated                                                             9.0              16.1              178.9                 1.14                 5.6                 6.7              119.8                 1.14                 15
  Inferred                                                                            15.8                27.3              173.3                 1.14
  Victor (OP)1: Indicated                                                                9.7               1.8                18.7                1.50                 9.3                 1.7                18.3                1.50                  5
  Inferred                                                                            17.3                 3.9                22.6                1.50
  Venetia (OP)1: Indicated                                                            32.3                33.4              103.4                 1.00                31.3                30.1                96.3                1.00                 31
  Inferred                                                                            27.9                 4.9                17.5                1.00
  Debswana Jwaneng (OP),1,3: Indicated                                                61.8                73.8              119.5                 1.47                61.8                77.3              125.2                 1.47                 18
  Inferred                                                                          295.6               286.3                 96.9                1.47
  Debswana Orapa (OP) 1,3: Indicated                                                155.5               110.3                 70.9                1.65              140.3                 89.6                63.8                1.65                 16
  Inferred                                                                          497.5               339.5                 68.2                1.65
                                                                                 Area               Carats              Grade                                    Area              Saleable                              Recovered
                                                                                (k m²)               (kc)               (cpm²)                                  (k m²)            Carats (kc)                           Grade (cpm²)
  Namdeb Holdings – Offshore (MM)² Indicated                                     129,334              11,841                  0.09            Multiple            69,642                5,504                 0.08                1.47                 15
  Inferred                                                                    1,055,236               90,974                  0.09            Multiple

Notes:
For a detailed breakdown of estimates please refer to the Anglo American Ore Reserves and Mineral Resources Report 2013 http://angloamerican.com/investors/reportingcentre.
Due to the uncertainty that may be attached to some Inferred Mineral Resources, it cannot be assumed that all or part of an Inferred Mineral Resource will necessarily be upgraded to an Indicated or Measured Resource after continued exploration.
1,2,3:.Also refer to associated explanatory notes on following slide

                                                                                                          The De Beers Group of Companies                                                                                                               62
DIAMOND RESOURCE AND RESERVE ESTIMATES AS AT 31 DECEMBER 2013:
EXPLANATORY NOTES
Explanatory notes
Unless otherwise stated, tonnage is quoted as dry metric tonnes. Estimates of Diamond Reserve tonnes reflect the tonnage to be treated.
Reported Diamond Reserves/Resources are based on a Bottom Cut Off (BCO) which refers to the bottom screen size aperture and varies between 1.00mm and 3.00mm (nominal square mesh).
1 Recovered Grade is quoted as carats per hundred metric tonnes (cpht).
2 Recovered Grade is quoted as carats per square metre (cpm 2).
LoM = Life of Mine (years) is based on scheduled Probable Reserves including Indicated and some Inferred Resources considered for Life of Mine planning.
3 Total Resources include Tailings Mineral Resources.
Total Resources exclude stockpiled resources.
OP = Open Pit; UG = Underground; MM = Marine Mining; Mt = Million tonnes; Kt = Thousand tonnes; k m2 = thousand square metres
The De Beers Group of Companies 63You can also read