Jyske Bank Q4 2020 23 February 2021 - Information for investors and financial ...
←
→
Page content transcription
If your browser does not render page correctly, please read the page content below

Jyske Bank Q4 2020 23 February 2021

2020 in brief

Clients experienced                     Negative rates – for better or worse       All Progress Counts                     A changing organisation

•   More online meetings.               •   More clients began to invest           •   Own wind turbine to offset CO2      •   An organisational change in the
                                            instead of having cash deposits.           emission from direct and                development organisation with
•   More specialists.                                                                  indirect power consumption              a view to becoming even more
                                        •   To an increasing degree, the               covered by means of own                 agile.
•   Fewer branches to visit.                negative interest rate
                                                                                       renewable energy production.
                                            environment was reflected in                                                   •   Organisational changes in
•   A brand new mobile banking
                                            deposit rates for personal             •   First estimate of CO2e emission         Personal Clients to become
    platform.
                                            clients.                                   from business volumes.                  more focused and specialized.
•   Increased flexibility with Jyske                                               •   Targets for sustainability in all
    Frihed.                             •   Advantageous interest rates                                                    •   Many employees experienced
                                            and remortgaging opportunities             material business areas.                changed working conditions due
•   Energy loans and CO2 calculator         for home owners remained.                                                          to COVID-19.
    facilitating energy retrofitting.
                                                                                                                           •   The sale of Jyske Bank Gibraltar
•   A new equity fund offering more                                                                                            was finalized.
    sustainable investment
    solutions.

•   New VISA card without Dankort.

COVID-19
•   Lockdown and restrictions affected Danish society in 2020.                 •   Clients received individual advice and guidance about the COVID-19
                                                                                   situation.
•   Jyske Bank's employees were most flexible and adaptive, and the bank
    remained accessible.                                                       •   A COVID-19 management's estimate for impairment charges of DKK 1.1bn.

                                                                                                                                                               2
Summary
                              Q4 2020

Summary                 03
Financial results       12
Capital and liquidity   18
Volumes                 21
Sustainability          26
Jyske Bank in brief     31
Macroeconomics          38
Calendar and contacts   42
Highlights

             Strong financial performance in recent quarters; DKK 1.9bn - 2.3bn net profit outlook for 2021

             All-time strong credit quality and intact DKK 1.1bn management’s estimate for COVID-19

             Cost focus intensified with core expenses down 4% in 2020 and a continued decline expected

             Several deposit repricing initiatives introduced; zero interest threshold lowered to DKK 100K

             Ample capital ensuring high payout capacity; share buy-backs of DKK 750m initiated

                                                                                                             4
Strong financial performance in recent quarters
DKK 1.9bn - 2.3bn net profit outlook for 2021 vs. DKK 1.6bn in 2020

 Return on shareholders’ equity (p.a.)
14%
12%
10%
 8%
 6%
 4%
 2%
 0%
-2%
-4%
-6%
-8%
-10%
-12%
       Q1'18   Q2'18    Q3'18   Q4'18    Q1'19    Q2'19    Q3'19     Q4'19    Q1'20    Q2'20       Q3'20   Q4'20
                 Impairment charges based on management's estimate
                 Return on equity (p.a.) excl. impairment charges based on management's estimate

                                                                                                                   5
All-time strong credit quality
Intact DKK 1.1bn management’s estimate related to COVID-19 pandemic

Non-performing loans (net) as % of loans, advances and guarantees
2.0%

1.8%

1.6%

1.4%

1.2%

1.0%

0.8%

0.6%

0.4%

0.2%

0.0%
       Q1'18   Q2'18   Q3'18   Q4'18   Q1'19   Q2'19   Q3'19   Q4'19   Q1'20   Q2'20   Q3'20   Q4'20

                                                                                                       6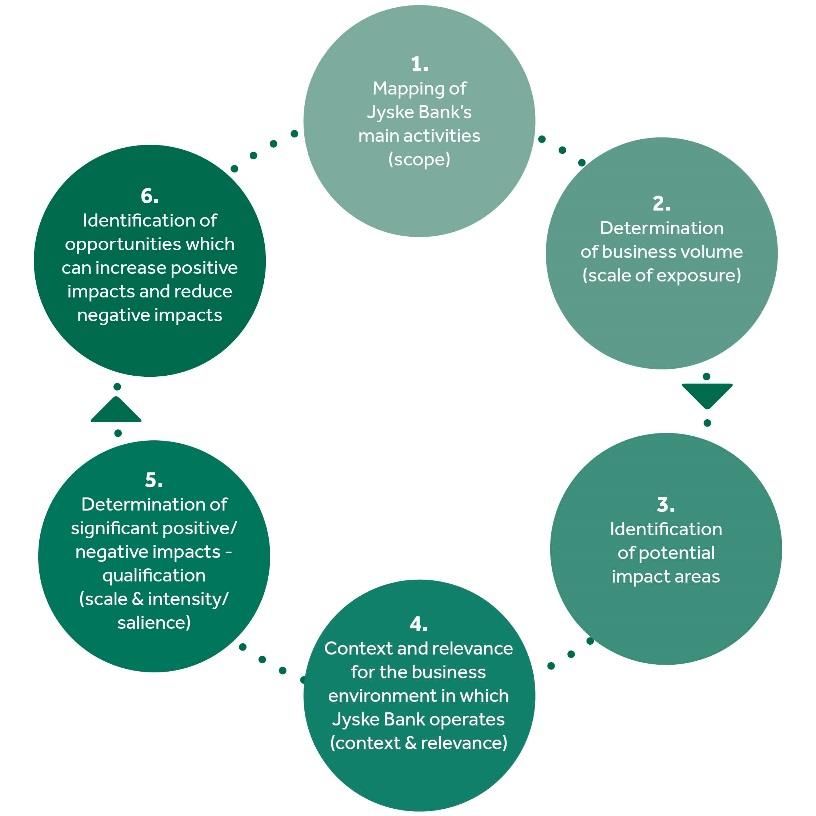
Cost focus intensified with core expenses down 4% in 2020
Decrease of 6% excl. one-offs and a continued decline expected for 2021

Core expenses (trailing four quarters, DKKm)
5,300

5,250

5,200

5,150

5,100

5,050

5,000

4,950

4,900

4,850

4,800

4,750

4,700
        Q1'18   Q2'18   Q3'18   Q4'18   Q1'19   Q2'19   Q3'19   Q4'19   Q1'20   Q2'20   Q3'20   Q4'20

                                                                                                        7
Several deposit repricing initiatives introduced
Zero interest threshold lowered to DKK 100,000 for private clients’ deposits

Interest income from deposits (excl. repo, triparty, DKKm)
100

 90

 80

 70

 60

 50

 40

 30

 20

 10

  0

-10

-20

-30
      Q1'18   Q2'18   Q3'18   Q4'18   Q1'19   Q2'19   Q3'19   Q4'19   Q1'20   Q2'20   Q3'20   Q4'20

                                                                                                      8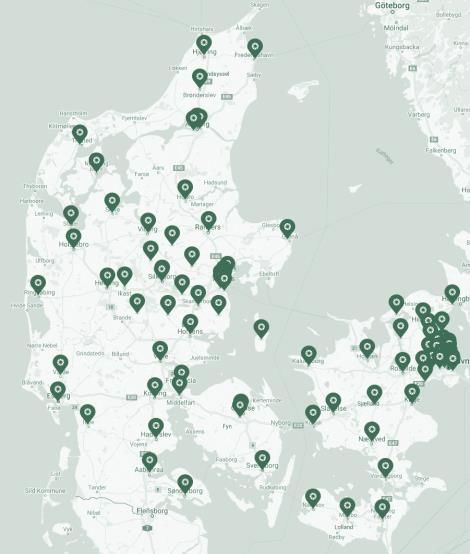
Ample capital ensuring high payout capacity
DKK 750m share buy-back initiated with capital ratio at all-time high level

Capital ratio

24%

22%

20%

18%

16%

14%

12%

10%

 8%

 6%

 4%

 2%

 0%
       Q1'18    Q2'18   Q3'18   Q4'18   Q1'19   Q2'19   Q3'19    Q4'19   Q1'20   Q2'20   Q3'20   Q4'20

                Common Equity Tier 1                Additional Tier 1               Tier 2

                                                                                                         9
Financial results
Net profit of DKK 831m and return on equity of 9.6% in Q4 2020 Income statement and key figures (DKKm)
Q4 Q4 Index Q3 Index FY FY Index
Net interest income -6% y/y. Reduced deposit rates counteracted lower 2020 2019 y/y 2020 q/q 2020 2019 y/y
bank lending. Decline mainly due to lower interest income from bonds. Net interest income 1,195 1,270 94 1,256 95 4,966 5,152 96
Net fee and commission income -11% y/y due to lower remortgaging Net fee and commission income 581 653 89 453 128 2,091 2,311 90
activity, lower performance fees as well as the sale of Jyske Bank (Gibraltar).
Value adjustments 278 252 110 189 147 685 342 200
Value adjustments of DKK 278m amid narrowing credit spreads, positive Other income 38 41 93 36 106 130 154 84
effect of FX positions and high activity levels.
Income from operating lease 34 15 227 69 49 110 101 109
Core expenses -3% y/y and -11% y/y on an underlying basis due to 7% Core income 2,126 2,231 95 2,003 106 7,982 8,060 99
lower FTE’s, an intensified cost focus and sale of Jyske Bank (Gibraltar).
Core expenses 1,179 1,213 97 1,159 102 4,848 5,029 96
Loan impairment charges of DKK 5m, as NPL share reached all-time low. Core profit before loan
947 1,018 93 844 112 3,134 3,031 103
COVID-19 management’s estimate of DKK 1.1bn remains intact. impairment charges
Loan impairment charges 5 -64 - -48 - 968 -101 -
Investment portfolio earnings of DKK 157m from narrowing credit spreads
and FX positions. Core profit 942 1,082 87 892 106 2,166 3,132 69
Investment portfolio earnings 157 144 109 14 1,121 -56 -53 -
Return on equity Q4 2019 vs. Q4 2020 Pre-tax profit 1,099 1,226 90 906 121 2,110 3,079 69
14% Tax 268 260 103 210 128 501 639 78
-1.9pp y/y
12% Net profit for the period 831 966 86 696 119 1,609 2,440 66
Earnings per share (DKK) 10.9 12.2 89 9.0 121 19.8 29.0 68
10%
Return on equity (ann.) 9.6% 11.5% 83 8.1% 118 4.4% 7.1% 62
8%
Cost/income ratio 55.5% 54.4% 102 57.9% 96 60.7% 62.4% 97
6%
Capital ratio 22.9% 21.5% 106 22.3% 103 22.9% 21.5% 106
4%
CET1 ratio 17.9% 17.4% 103 17.5% 103 17.9% 17.4% 103
2%
Mortgage lending (nominal) 333,056 327,926 102 332,311 100 333,056 327,926 102
0%
ment charges
Core expenses
Net interest
Other income
Income from ope-
Net fee and com-
adjustments
Investment port-
Q4'19
Q4'20
Tax, AT1 etc.
Bank loans (excl. repo) 73,043 79,039 92 71,794 102 73,043 79,039 92
Loan impair-
rating lease (net)
mission income
folio earnings
income
Value
New home loans 2,646 3,400 78 2,822 94 2,646 3,400 78
Leasing 19,879 19,651 101 19,565 102 19,879 19,651 101
Deposits (excl. repo) 127,461 126,939 100 125,582 101 127,461 126,939 100
10Outlook
Earnings per share (DKK)
Bank lending to increase and mortgage
Volumes
lending to grow with market in 2021
2021E
2020
Core income Lower in 2021 than 2020 level
2019
2018
Core expenses Lower in 2021 than 2020 level
2017
2016
Loan impairment
Very low level in 2021 2015
charges
2014
Net profit DKK 1.9bn-2.3bn in 2021 2013
2012
CET1 ratio of 15%-17% and capital ratio of 2011
Capital
20%-22% for the coming years
0 5 10 15 20 25 30 35 40
11Financial results
Q4 2020
Summary 03
Financial results 12
Capital and liquidity 18
Volumes 21
Sustainability 26
Jyske Bank in brief 31
Macroeconomics 38
Calendar and contacts 42Reduced deposit rates offset lower bank lending volumes
Net interest income (NII) Net interest income Q4 2019 vs. Q4 2020 (DKKm)
1,300
NII -6% y/y due to part of NII from bonds moving to value adjustments -6% y/y
• Core NII unchanged, as reduced deposit rates for private and corporate 1,280
clients offset negative impact from lower bank lending and mix effects. 1,260
• Other NII down due to lower NII from trading activities (see value 1,240
adjustments), sale of Jyske Bank (Gibraltar) as well as T2 and NPS issues.
1,220
NII -5% q/q, partly due to a negative one-off and negative mix effects
1,200
• Core NII -2% due to lower NII from bank lending moderated by reduced
deposit rates for corporate clients and higher lending to public auth. 1,180
• Other NII down, mainly due to lower NII from bonds and a new NPS issue. 1,160
• DKK -19m from one-off and accruing paid commissions under leasing 1,140
activities with effect from 1 January 2020 booked in Q4 2020.
1,120
Threshold for zero interest on private clients’ deposits lowered from DKK Q4'19 Lending Lending Deposit Deposit Days Other Q4'20
250K to DKK 100K effective 1 April 2021. volumes rates/mix volumes rates/mix
Net interest income (DKKm) Net interest income Q3 2020 vs. Q4 2020 (DKKm)
1,500 Total: -6% y/y 1,300
-5% q/q
Core: +0% y/y
1,300 1,280
1,100 1,260
900 1,240
700 1,220
500 1,200
300 1,180
100 1,160
-100 1,140
Q1'19 Q2'19 Q3'19 Q4'19 Q1'20 Q2'20 Q3'20 Q4'20
Bank lending (excl. repo) Administration margin income etc. 1,120
Leasing Deposits (excl. repo, triparty) Q3'20 Lending Lending Deposit Deposit Days Other Q4'20
Other net interest income volumes rates/mix volumes rates/mix
Note: Core net interest income is net interest income from lending and deposits. Other net interest income relates to e.g. funding, capital and liquidity management and trading activities. 13Net fee income underpinned by high activity levels in Q4
Net fee and commission income (NFCI) Net fee and commission income Q4 2019 vs. Q4 2020 (DKKm)
700
NFCI -11% y/y due to lower remortgaging activity and performance fees -11% y/y
• Remortgaging activity down from elevated level in Q4 2019. 650
• Performance-related fees declined from DKK 33m to DKK 0m. 600
• Negative impact from sale of Jyske Bank (Gibraltar) and COVID-19 550
pandemic, which e.g. lowered money transfers and card payments.
500
NFCI +28% q/q due to positive one-off, seasonality and high activity level 450
• Yearly fees from securities trading and safe-custody services more than 400
outweighed seasonally lower refinancing activity.
350
• Higher customer trading activity levels and increased assets under
Other fees and
Mortgage fees
commission
commission
and safe-custody
Money transfers
Q4'19
Loan application
Q4'20
Performance fees
Securities trading
Guarantee
card payments
commissions
expenses
Fee and
management.
services
fees
and
• Positive effect of DKK 46m from accruing paid commissions under
leasing activities with effect from 1 January 2020 booked in Q4 2020.
Net fee and commission income decomposed (DKKm) Net fee and commission income Q3 2020 vs. Q4 2020 (DKKm)
900 650
-11% y/y +28% q/q
800
600
700
600 550
500
500
400
450
300
200 400
100
350
0
Mortgage fees
commission
Other fees and
commission
and safe-custody
Money transfers
Q3'20
Loan application
Q4'20
Performance fees
Securities trading
Guarantee
card payments
commissions
expenses
Fee and
Q1'19 Q2'19 Q3'19 Q4'19 Q1'20 Q2'20 Q3'20 Q4'20
services
fees
Securities trading and safe-custody Performance fees
and
Mortgage fees Loan application fees
Money transfers and card payments Guarantee commission
Other fees and commissions Net fee and commision income
14Underlying value adjustments remain at a strong level
Value adjustments and investment portfolio income Value adjustments (DKKm)
Value adjustments of DKK 278m in Q4 2020 400
+26m y/y
• High activity levels amid a continued broad-based positive development 300
in financial markets.
200
• Positive contribution from strategic balance and risk management.
• Negative impact from ACVA counteracted by FX hedging of Swedish 100
leasing portfolio and an adjustment related to balancing principle.
0
Investment portfolio earnings of DKK 157m in Q4 2020
-100
• Positive value adjustments from FX positions and narrowing of option-
adjusted spreads on Danish mortgage bonds. -200
• FX hedging of AT1 issues in SEK had a positive P/L impact of DKK 79m, -300
counteracted by an equivalent adjustment of shareholders’ equity. Q1'19 Q2'19 Q3'19 Q4'19 Q1'20 Q2'20 Q3'20 Q4'20
Underlying (incl. sector shares) Strategic bal. and risk mgmt. Other (CVA/DVA etc.)
Investment portfolio earnings (DKKm) OAS on Danish mortgage bonds narrowed further in Q4 (bp)
300 -15
+14m y/y
200 -10
100
-5
0
0
-100
5
-200
10
-300
15
-400
-500 20
Q1'19 Q2'19 Q3'19 Q4'19 Q1'20 Q2'20 Q3'20 Q4'20 Q1'19 Q2'19 Q3'19 Q4'19 Q1'20 Q2'20 Q3'20 Q4'20
Investment portfolio earnings AT1 FX hedging 3-year fixed-rate Danish mortgage bonds vs. CIBOR 3M (bp, q/q, inverted axis)
15Intensified cost focus materially reducing core expenses
Core expenses Core expenses Q4 2019 vs. Q4 2020 (DKKm)
1,240
Core expenses -3% y/y and -11% y/y on an underlying basis -3% y/y
• Excluding positive one-off items of DKK 114m in Q4 2019 and DKK 6m in 1,220
Q4 2020, core expenses declined 11%.
• FTE’s down 7%, and sale of Jyske Bank (Gibraltar) lowered expenses 2%. 1,200
• Broad-based reduction of operating expenses from intensified cost 1,180
focus, underpinned by less travelling etc. due to COVID-19 pandemic.
1,160
Core expenses +2% q/q due to minor increases in e.g. IT costs
• Number of FTE’s down by 102 since Q2 2020, reflecting targeted 1,140
reduction of 150-200 from mid-2020 to mid-2021.
1,120
• IT expenses increased slightly compared with the preceding quarter.
• Lower provisions for court cases partly counteracted by higher 1,100
employee-related provisions in Q4 2020. Q4'19 Employees IT Other Q4'20
Core expenses (DKKm) and full-time employees Core expenses Q3 2020 vs. Q4 2020 (DKKm)
1,600 3,800 1,200
-3% y/y +2% q/q
1,400 3,700 1,190
1,180
1,200 3,600
1,170
1,000 3,500
1,160
800 3,400
1,150
600 3,300
1,140
400 3,200 1,130
-7% y/y
200 3,100 1,120
0 3,000 1,110
Q1'19 Q2'19 Q3'19 Q4'19 Q1'20 Q2'20 Q3'20 Q4'20
1,100
Employees IT Other Full-time employees (ra.)
Q3'20 Employees IT Other Q4'20
16Credit quality remains solid with NPL ratio at all-time low
Credit quality Cost of risk (bp)
Loan impairment charges of DKK 5m, 0bp cost of risk, in Q4 2020 25
+1bp y/y
• Continued broad-based positive development in clients’ credit quality. 20
• Underpinned by strong property market, limited unemployment claims
15
and low level of bankruptcies amid deferred payments of VAT and taxes.
10
Balance of impairment charges up 6bp y/y to 1.1%
5
• 0.5% for mortgage activities and 3.6% (excl. repo) for banking/leasing.
• Total management’s estimate of DKK 1,607m up DKK 1,018m y/y, of 0
which DKK 1,090m related to COVID-19 pandemic.
-5
Non-performing loans declined 33bp y/y to a record low of 1.0%
-10
• Loans subject to forbearance measures at 1.6% vs. 2.0% end-2019. Q1'19 Q2'19 Q3'19 Q4'19 Q1'20 Q2'20 Q3'20 Q4'20
Cost of risk excl. mgmt. est. Cost of management's estimate
• 90-day mortgage arrears for private and corporate clients 14bp and 7bp.
Non-performing loans as % of loans, advances and guarantees Impairment charges as % of gross loans, adv. and guarantees
1.6% 1.4%
-33bp y/y +6bp y/y
1.4% 1.2%
1.2%
1.0%
2.4%
1.0% 2.0% 2.1% 2.1%
2.0% 0.8%
1.9% 1.8% 2.7% 2.7%
0.8% 2.5% 2.4%
1.6% 2.7%
0.6% 2.5% 2.5% 2.5%
0.6%
0.4%
0.4%
1.0% 1.1% 1.0% 1.0% 0.9% 0.8%
0.8% 0.8% 0.2%
0.2% 0.5% 0.5% 0.5% 0.5%
0.3% 0.3% 0.3% 0.3%
0.0% 0.0%
Q1'19 Q2'19 Q3'19 Q4'19 Q1'20 Q2'20 Q3'20 Q4'20 Q1'19 Q2'19 Q3'19 Q4'19 Q1'20 Q2'20 Q3'20 Q4'20
Mortgage Banking, Leasing Mortgage Banking, Leasing
17Capital and liquidity
Q4 2020
Summary 03
Financial results 12
Capital and liquidity 18
Volumes 21
Sustainability 26
Jyske Bank in brief 31
Macroeconomics 38
Calendar and contacts 42Solid capital position
Comments on capital position and capital distribution Capital ratios and capital requirements
Capital ratio of 22.9% and CET1 ratio of 17.9% (+0.6pp and +0.4pp q/q) 26%
+137bp y/y
24%
• Positive earnings impact and lower REA, partly counteracted by a new
22%
share repurchase programme of DKK 750m.
20%
• Targeting 20%-22% capital ratio and 15%-17% CET1 ratio for the 18%
coming years. 16%
14%
• Total capital requirement of 15.6% and CET1 requirement of 10.6% in
12%
Q4 2020. Total capital buffer of 7.3pp (DKK 13.1bn).
10%
Risk exposure amount -2% q/q due to reduced credit and market risk. 8%
6%
Potential for capital distribution is assessed on a quarterly basis
4%
• Share repurchase programmes of DKK 6.2bn conducted and DKK 2.5bn 2%
of dividends paid out in 2016-2020 with avg. payout ratio of approx. 65%. 0%
Q1'19 Q2'19 Q3'19 Q4'19 Q1'20 Q2'20 Q3'20 Q4'20
• New share repurchase programme of DKK 750m to run as from 28
January 2021 and up to and including 30 September 2021 at the latest. Common Equity Tier 1 Additional Tier 1 Tier 2 CET1 requirement Capital requirement
Risk exposure amount (DKKbn) Capital distribution by time of announcement (DKKm)
220 1,200
-1% y/y
200
180 1,000
160
800
140
120
600
100
80
400
60
40 200
20
0 0
Q1'19 Q2'19 Q3'19 Q4'19 Q1'20 Q2'20 Q3'20 Q4'20 Q1'16 Q3'16 Q1'17 Q3'17 Q1'18 Q3'18 Q1'19 Q3'19 Q1'20 Q3'20 Q1'21
Credit risk Market risk Operational risk Share repurchase programme Dividend
19Liquidity and funding
Comments on liquidity position and funding plans Maturity/call-date profile (DKKbn)
Liquidity coverage ratio of 339% at end-2020, up 96pp y/y (target: >150%). 12
Leverage ratio of 5.3% at the end of 2020, unchanged vs. end-2019. 10
Issuer activity and funding plans
8
• On 15 October 2020, Jyske Bank issued EUR 500m non-preferred
senior debt at a spread of 3M CIBOR + 68bp.
6
• Approx. EUR 600m preferred senior and approx. EUR 300m non-
preferred senior expected to be issued in 2021. 4
Funding with upcoming maturity/call-date
2
• PS issue of DKK 3.7bn at 3M CIBOR + 0.57% maturing in April 2021.
• T2 issues of approx. DKK 0.7bn at 3M CIBOR + 2.43% w/ May 2021 call. 0
2021 2022 2023 2024 2025 2026 2027 2028 ≥2029
• AT1 issues of approx. DKK 1.4bn at 3M CIBOR + 5.62% w/ Sep. 2021 call.
Preferred senior debt Non-preferred senior debt Tier 2 call date AT1 call date
• NPS issue of DKK 3.7bn at 3M CIBOR + 0.90% maturing in Dec. 2021.
Accumulated change in yearly funding costs vs. 2018 (DKKm) Ratings and issues
120 Jyske Bank Jyske Realkredit
Stand Alone Credit Profile (SACP) A- Stable
100
CRD-compliant covered bonds from
Short term unsecured (pref. senior) A-1 Stable AAA
Capital Center E
80 Long-term unsecured (pref. senior) A Stable
Long-term non-preferred senior BBB+ Stable
60 UCITS-compliant mortgage bonds from
Tier 2 BBB Stable Capital Center B and the General Capital AAA
Center
40 Additional Tier 1 BB+ Stable
Recent issues Value date Maturity/call-date Spread
20 SEK 1bn Additional Tier 1 9 April 2019 Perpetual (call 2024) 3M CIBOR + 470bp
EUR 500m Non-Preferred Senior 20 June 2019 20 June 2024 3M CIBOR + 83bp
0 EUR 200m Tier 2 28 January 2020 28 Jan. 2031 (call 2026) 3M CIBOR + 130bp
2019 2020 2021E 2022E 2023E
EUR 500m Non-Preferred Senior 15 October 2020 15 Oct. 2025 (call 2024) 3M CIBOR + 68bp
Acc. change in funding costs vs. 2018 (DKKm)
EUR 500m covered bond 20 January 2021 1 October 2027 3M CIBOR - 10bp
Note: Funding costs are estimated based on currently expected spreads, run-off profile and funding plans for senior, NPS and capital instruments (excl. AT1). Spreads are 3M CIBOR equivalent. 20Volumes
Q4 2020
Summary 03
Financial results 12
Capital and liquidity 18
Volumes 21
Sustainability 26
Jyske Bank in brief 31
Macroeconomics 38
Calendar and contacts 42Volume trends point to increasingly low risk business
Lending volumes (excl. repo) Business volumes (DKKbn)
Lending 0% y/y as higher mortgage lending offset lower bank lending
Mortgage loans (nominal)
• Bank loans -8% due to low credit demand amid COVID-19 pandemic, +2%
wide-reaching government support and continued credit policy focus.
Bank loans (excl. repo)
-8%
• Mortgage loans +2% as significantly higher lending to corporate clients
more than offset lower mortgage lending to private clients. New home loans (mortgage-like)
-22%
• Leasing +1% as structural growth outweighed impact from COVID-19.
Leasing
+1%
Lending +1% q/q from higher lending to public auth. and mortgage lending
Deposits (excl. repo)
• Bank loans +2% due to higher lending to public authorities, partly +0%
counteracted by lower lending to private and corporate clients.
Assets under management
+2%
• Mortgage loans unchanged, as higher mortgage lending to corporate
clients offset lower mortgage lending to private clients. 0 50 100 150 200 250 300 350
Q4'19 Q4'20
• Leasing +2% supported by normalisation following COVID-19 outbreak.
Lending and deposits by segment (DKKbn) Business volumes (Q1 2019=100)
Mortgage loans (nom.) Bank loans (excl. repo) Deposits 115
and leasing (excl. repo, triparty)
350 140 140
110
Tusinde
Tusinde
Tusinde
300 120 120
105
250 100 100
200 80 80 100
150 60 60
95
100 40 40
90
50 20 20
0 0 0 85
Q4'19 Q4'20 Q4'19 Q4'20 Q4'19 Q4'20
Subsidised housing New home loans Private 80
Leasing Q1'19 Q2'19 Q3'19 Q4'19 Q1'20 Q2'20 Q3'20 Q4'20
Corporate Corporate Assets under management Mortgage loans (nominal)
Corporate Leasing Bank loans (excl. repo, new home loans)
Private Private Leasing Deposits (excl. repo)
Note: Lending and deposits figures are exclusive of repo loans as well as repo and triparty deposits. Mortgage lending figures are nominal. 22Total lending portfolio
Loans, advances and guarantees by sector (DKKbn) Balance of impairment charges by sector (DKKbn)
Personal clients 43% 0.9% of loans, advances and guarantees Personal clients
Real property 31% 0.7% Real property
Finance and insurance 10% 1.2% Finance and insurance
Other sectors 4% Total balance of 1.2% Other sectors
DKK 5.5bn (1.1%),
Public authorities 3% o.w. DKK 1.6bn is 0.0% Public authorities
Personal clients 43%,
Commerce 2% Corporate clients 54%, mgmt. est. 2.3% Commerce
Public authorities 3%
Building and construction 2% 1.4% Building and construction
Personal clients:
Manufacturing, mining etc. 2% DKK 1.9bn (0.9%) 4.0% Manufacturing, mining etc.
Agriculture, hunting, forestry,… 1% 6.0% Agriculture, hunting, forestry, fishing
Corporate clients:
Energy supply 1% DKK 3.6bn (1.3%) 0.7% Energy supply
Transport, hotels and restaurants 1% 2.5% Transport, hotels and restaurants
Information and communication 0% 22.3% Information and communication
0 25 50 75 100 125 150 175 200 225 250 2.0 1.8 1.6 1.4 1.2 1.0 0.8 0.6 0.4 0.2 0.0
Fair value (~Mortgage) Amortised cost, guarantees (~Banking, Leasing) Q4'20
Loans, advances and guarantees by IFRS 9 stages (DKKbn) Balance of impairment charges by IFRS 9 stages (DKKbn)
Q4'19 94.1% 0.1% Q4'19
Stage 1
Stage 1
Q4'20 95.4% 0.2% Q4'20
Q4'19 4.7% 4.7% Q4'19
Stage 2
Stage 2
Q4'20 3.7% 6.5% Q4'20
Q4'19 1.2% 35.5% Q4'19
Stage 3
Stage 3
Q4'20 1.0% 40.3% Q4'20
0 100 200 300 400 500 600 4.0 3.5 3.0 2.5 2.0 1.5 1.0 0.5 0.0
Loans, advances and guarantees by IFRS 9 stages Fair value (~Mortgage) Amortised cost, guarantees (~Banking, Leasing)
23Mortgage portfolio
Loans and advances at fair value by property category (DKKbn) 90-day mortgage arrears as % of lending by segment
0.7%
Owner-occupied homes 48%
Private rental properties 16% 0.6%
Subsidised housing 16%
0.5%
Office and business properties 10%
Cooperative housing 4% 0.4%
Vacation homes 2% Mortgage loans and new home loans
0.3%
constitute 79% of total lending (excl. repo)
Social, cultural, educational prop. 2%
0.2%
Industrial properties 1%
Agricultural properties etc. 0% 0.1%
Other properties 0%
0.0%
0 20 40 60 80 100 120 140 160 180 Q1'16 Q3'16 Q1'17 Q3'17 Q1'18 Q3'18 Q1'19 Q3'19 Q1'20 Q3'20
2020 Private Corporate Subsidised
Significant de-risking of mortgage portfolio LTV in recent years Clients are opting for fixed-rate mortgages w/ amortisation
100% 68% 100% 49%
90% 66% 90% 48%
80% 64% 80% 47%
70% 62% 70% 46%
61%
60% 60% 60% 60% 45% 45%
50% 58% 50% 44% 44%
44%
57%
40% 56% 40% 43%
30% 54% 30% 42% 42% 42%
53%
20% 52% 52% 20% 36% 38% 41%
35% 35% 34%
10% 50% 10% 40%
0% 48% 0% 39%
Q4 2016 Q4 2017 Q4 2018 Q4 2019 Q4 2020 Q4 2016 Q4 2017 Q4 2018 Q4 2019 Q4 2020
0%-20% 20%-40% 40%-60% 60%-80% Fixed F3 - F10 F1 - F2
80%-100% >100% Avg. LTV (ra.) Capped floater Non-capped floater Interest-only (ra.)
24The Danish mortgage model
Introduction The Danish mortgage model
The Danish mortgage model is based on a balance principle with no defaulting
mortgage credit institutes (MCI’s) since its inception in 1797.
• MCI’s fund loans by issuing covered bonds with 1:1 matching terms, thus
transferring interest rate, currency, liquidity, prepayment risk to investors. Mortgage Bonds
• Borrowers can prepay loans/remortgage by buying the underlying bonds, which Mortgage
Principal, interest credit institute Principal, interest
are traded in a transparent and highly liquid market of AAA-rated covered bonds.
Borrower Investor
• In addition to the principal and interest paid to the investor, the borrower pays an
administration margin as well as transaction-based fees to the MCI.
• The MCI, in return, guarantees payments from the borrower, who is subject to a
thorough credit assessment with a strict 60%-80% loan-to-value limit. Admin. margin
MCI’s offer loans with a wide variety of maturities of up to 30 years, prepayment
options, interest-only periods and interest rate-resetting at several frequencies.
The Danish mortgage market is consolidated, consisting of four MCI’s, and provides
some of the most attractive, transparent lending terms at a very low cost of risk.
Loan Investment
Financing of property in Denmark and abroad The Danish mortgage market benefits from structural growth
100% 3,500
Tusinde
Self-financing
90% 3,000
Other debt
80% CAGR: 4.7% p.a.
Deposits 2,500
70% Covered bonds
2,000
60% +3.6x
50% 1,500
40% 1,000
30% CAGR: 2.5% p.a.
500
20%
0
10%
2013
2003
2004
2005
2006
2007
2008
2009
2010
2011
2012
2014
2015
2016
2017
2018
2019
2020
2021
0%
Mortgage credit institutes in Denmark Universal banks abroad Mortgage lending, Denmark (DKKbn) Bank lending, Denmark (DKKbn)
Sources: Statistics Denmark and Finance Denmark. Note: Lending to non-financial corporations and households. For further information please see Finance Denmark. 25Sustainability Summary 03 Financial results 12 Capital and liquidity 18 Volumes 21 Sustainability 26 Jyske Bank in brief 31 Macroeconomics 38 Calendar and contacts 42
Sustainability is ingrained in Jyske Bank’s vision
     “We have an ambition of running our
    business responsibly and in a way that
          promotes sustainability.”

•   Promoting sustainability as expressed in UN’s 17
    sustainable development goals with focus on
    both direct and indirect impacts.

•   With the approach “All progress counts”,
    responsible banking remain an integrated part of
    our operations, supplemented by the key priority
    of promoting sustainability through business
    activities such as lending and investments.

•   Jyske Bank is a signatory of UN’s Principles for
    Responsible Banking and committed to the 20
    recommendations developed by the Danish
    Forum for Sustainable Finance.

                                                       27
Sustainable business
Offering financing arrangements Simplifying sustainable Providing knowledge of
that support sustainable transition investment sustainability
Jyske Bank has identified five sustainable lending Jyske Bank aims to make sustainable investment Jyske Bank wants to ensure that clients are able
areas with the largest potential of reducing simple and accessible for clients by offering to make informed decisions through a nuanced
carbon emissions. sustainable products, advice and services. and transparent approach to sustainability.
We have set goals to help realise the potential: Our responsible investment spans four pillars: We have so far focused on three areas:
• Financing 4 TWh renewable power in 2025 by • Active ownership and engagement with • Informing clients about energy retrofitting by
supporting development of wind and solar companies on e.g. sustainability. news letters, webinars and blog posts given
energy (2020: 2.5 TWh). subsidies from authorities and favorable
• Integration and governance of ESG factors in remortgaging opportunities.
• In 2025, 40% of new vehicles loans will investment decisions, processes and
finance low-emission vehicles. products. • What’s behind your investments? New
methods and workflows facilitate increased
• Financing an additional DKK 10bn of • Inclusion and exclusion of investment transparency on investments’ ESG data.
commercial property with low energy candidates solely based on sustainability-
consumption by 2025 (2020: DKK 31bn). related matters. • Got a Minute? Informing on best
sustainability practice in a series of mini-
• Developing products that assist and motivate • Communication and reporting on portraits of companies that successfully
clients to undertake energy retrofitting of investments and the results of our efforts integrated sustainability in business models.
their properties (e.g. energy loans and CO2 through e.g. sustainability fact sheets.
calculator).
28Responsible banking operations
Sustainable banking operations
Reducing the negative impact on society.
Electricity consumption is offset by own renewable
energy production. By end-2022, emissions related to
district heating and company cars will also be offset.
Energy management systems installed on all locations in
order to keep reducing consumption. Company cars will
gradually be replaced by low-emission vehicles.
Social initiatives
Engaging in several social projects and efforts to make a
difference in regards to e.g. financial safety, well-being
and social relationships through our resources and skills.
Healthy corporate culture
Promoting integrity as well as highly ethical and
professional standards, underpinned by a framework of
policies of good practice and education of employees.
Prevention of financial crime
Minimising the risk of being abused for financial crimes
such as money laundering and financing of terror through
education, governance and systematic surveillance.
Responsible employer
Aiming to stay an attractive place to work that ensures
job satisfaction, equal rights and development
Jyske Bank’s wind turbine opportunities for all employees in a healthy environment.
During 2020, Jyske Bank
acquired a Vestas V136 4.2 MW
wind turbine, a part of IT and data security
Denmark’s first subsidy-free Ensuring a sufficient IT and data security level to
wind park at Port of Hirtshals. It withstand the prevailing cyber threat by constantly
produced 16.1 GWh in 2020. testing systems and educating employees.
29Impact analysis
Identifying negative and positive areas of impact on the SDG’s Impact analysis method
Principles for Responsible Banking as framework for work on sustainability: In
the autumn of 2019 - as one of 130 founding signatories - Jyske Bank signed
the PRB.
Identifying impact areas: An impact analysis identifies the most significant
areas that are challenged in relation to the UN’s 17 Sustainable Development
Goals on the basis of the current business model (”negative impacts”) and
similarly the areas of activity that support sustainability (”positive impacts”).
Quantification of impacts provides guideline for future efforts:
• Jyske Bank has identified climate as the most relevant impact area and
estimated the CO2e emission for lending and investing activities.
• The estimates are a guideline for the further efforts to identify possibilities
of reducing negative impacts and enhancing positive impacts.
Climate impact mainly stems from financed emissions
CO2e emission of 2.7m tonnes: 59% relate to loans and 41% to investments
• Corporate loans account for 41%, mainly caused by the transport industry.
• Loans for personal clients account for 18%, almost equally distributed on
home loans and car loans.
• Asset mgmt. on behalf of clients accounts for 34%, mainly due to equity
holdings in CO2e intensive sectors like utilities, materials and energy.
Next step: Reduce negative/increase positive impact and establish targets
Breakdown of Jyske Bank’s indirect CO2e emission
• Focus on bringing the impact analysis and the ensuing CO2e estimates into
play as a basis of decision making for the business units.
• Launching products that support sustainability, having launched sustainable
investment products, loans for energy improvements of homes as well as
car loans/leases with price differentiation according to energy rating.
Note: Please visit investor.jyskebank.com/investorrelations/sustainability for further information on Jyske Bank’s impact analysis, ESG Fact Book and report on sustainability. 30Jyske Bank in brief Summary 03 Financial results 12 Capital and liquidity 18 Volumes 21 Sustainability 26 Jyske Bank in brief 31 Macroeconomics 38 Calendar and contacts 42
Jyske Bank in brief

One of the largest financial   Founded in 1967 by a merger of four local banks, some dating back to 1882, now a Danish SIFI with a
institutions in Denmark        total market share of approximately 11% following organic growth and successful M&A.

Complementary segments         The third largest bank in Denmark, the fourth largest mortgage credit institute and one of the largest
with full-service offering     leasing providers offering customers a full range of financial products and services.

Nationwide operations in       Operating in a supportive AAA macroeconomic environment with a strong presence through
sound AAA economy              nationwide branch network.

High exposure to structural,   Share of mortgage lending has increased significantly and transforms Jyske Bank’s business model
low-risk growth                by heightening credit quality as well as increasing growth and stabilising margins through-the-cycle.

Solid capital position and     Significant capital buffer to regulatory requirements and low risk business model with increasingly
high payout ratio              stable returns underpin a high payout ratio.

                                                                                                                                     32
One of the largest financial institutions in Denmark
Banking activities cover advisory services relating to traditional financial solutions targeting Nationwide presence
personal and private banking clients as well as corporate clients and also trading and
Jyske Bank investment activities targeting large corporate clients and institutional clients.
The strategic balance sheet and risk management as well as earnings from investment
portfolios are allocated also to Banking activities.
Mortgage activities comprise financial solutions for the financing of real property carried out
Jyske Realkredit by Jyske Realkredit. Mortgage activities are aimed mainly at Danish personal clients,
corporate clients and subsidised rental housing.
Leasing activities cover financial solutions in the form of leasing and financing within car
financing as well as leasing and financing of equipment for the corporate sector. The
Jyske Finans
activities primarily target Danish personal and corporate clients as well as dealer cooperation
schemes and partnerships. Secondarily, the activities target car financing in Sweden.
Founded in 1967 – now a Danish SIFI History of succesful M&A Focused on core business
1967 Proven track-record of succesful recent M&A Divesture of non-core business
Founded by merger of four local banks, some Acquisitions made at discount to book value and Sale of Jyske Bank Global Asset Management
dating back to 1882. fully integrated to reap synergies. (US) (2013), Silkeborg Data (2014), stake in
Berben’s Effectenkantoor (2014), Jyske Bank
2011
1970’s-1989 Schweiz (2015) and Jyske Bank (Gibraltar) Ltd.
Acquisition of leasing activities from Spar Nord.
Seven acquisitions of small and medium-sized (2020).
banks and establishment of minor, foreign
Acquired parts of the client portfolio of
subsidiaries. Ready for new opportunities
Fjordbank Mors from Finansiel Stabilitet.
Growth through acquisitions is an ongoing
1989-2011 2013 strategic initiative and Jyske Bank remains
Organic growth while carrying out several Acquisition of Sparekassen Lolland. willing and able to participate in further
strategic initiatives. consolidation of the Danish financial sector.
2014
Acquisition of Jyske Realkredit from BRFfonden.
3379% mortgage lending share improves resilience and growth
Mortgage lending is low risk, high growth, more stable margins Credit quality of mortgage lending significantly stronger (bp)
Mortgage lending has ~10x lower cost of risk than bank lending 225
200
• Cost of risk has averaged 5bp for mortgage credit institutions vs. 51bp
175
for banks since 2000, peaking in 2009 at 20bp and 224bp, respectively.
150
Growth is resilient during times of financial distress and structurally higher 125
100
• Mortgage lending growth remained positive during the financial crisis and
75
has averaged 4.7% p.a. since 2004 vs. 2.5% p.a. for bank lending.
50
Mortgage lending supports a more stable margin development 25
0
• Due to a more consolidated competitive environment and full pass-
-25
through of interest rates, administration margins have risen 59% since 2000 2002 2004 2006 2008 2010 2012 2014 2016 2018
2003, whereas banks’ net interest margins have deteriorated 42%. Cost of risk, Danish mortgage credit institutions (bp)
Cost of risk, Danish banks (bp)
Mortgage lending growth stayed positive during the last crisis Administration margins are unaffected by falling interest rates
30% 4.0%
25% 3.5%
20% 3.0%
15% 2.5%
10% 2.0%
5% 1.5%
0% 1.0%
-5% 0.5%
-10% 0.0%
2010
2004
2005
2006
2007
2008
2009
2011
2012
2013
2014
2015
2016
2017
2018
2019
2020
2021
2009
2016
2004
2005
2006
2007
2008
2010
2011
2012
2013
2014
2015
2017
2018
2019
2020
Mortgage lending, Denmark (y/y) Bank lending, Denmark (y/y) Administration margin, mortgage credit institutions Net interest margin, banks
Sources: Statistics Denmark, Danish FSA. Note: Growth rates are based on lending to non-financial corporations and households. 34From above-market growth to repricing and cost initiatives
Introducing profitability initiatives in next phase of strategy Lower deposit rates increase net interest income (DKKm)
120
Repatriation of Totalkredit loans following merger in 2014 accomplished
• Following a prolonged period of above-market growth, the repatriation 100
of Totalkredit loans has been accomplished. Coincidentally, a 80
precautionary credit policy, implemented due to a late-stage credit
cycle, also reduced growth. 60
Significant repricing initiatives to improve profitability after growth period 40
• Jyske Bank has successfully introduced negative deposit rates for 20
private clients’ deposits and lowered deposit rates for corporate clients,
0
while also making significant changes to the fee structure.
-20
Branch network to be reduced amid elevated pace of headcount reduction
• Branches will be brought down by approximately 20% and FTEs will be -40
Q2'18 Q3'18 Q4'18 Q1'19 Q2'19 Q3'19 Q4'19 Q1'20 Q2'20 Q3'20 Q4'20
reduced by a further 4-6% from mid-2020 to mid-2021, given higher
demand for digital banking services and normalization of market share of
Interest income from deposits (excl. repo, triparty)
branches following period of above-market growth.
Reduction of headcount has accelerated since 2017 Branch network under structural pressure from digital banking
4,300 110
4,100 100
3,900 90
3,700 80
3,500 70
3,300 60
3,100 50
2,900 40
2007 2008 2009 2010 2011 2012 2013 2014 2015 2016 2017 2018 2019 2020 H1 2013 2014 2015 2016 2017 2018 2019 2020 H1
2021 2021
Full-time employees Targeted level by mid-2021 Locations in Denmark (2013=100) Targeted reduction by mid-2021
Sector (2013=100)
Source: Company data, FinansDanmark. 35Shareholder yield in focus
Shareholders’ view Total payout ratio
Book value per share has increased 45% since 2015, as the number of 100%
shares outstanding was reduced 24%. 90%
80%
Earnings per share increased 21% from 2015 to 2020 adjusted for intact
70%
management’s estimate related to COVID-19 pandemic.
60%
Total payout ratio at a level of approx. 70% in recent years (prior to COVID- 50%
19 pandemic) with increasing proportion of share repurchase programmes.
40%
Solid capital position with capital ratio of 22.9% and CET1 ratio of 17.9% vs. 30%
targets of 20-22% and 15-17% for the coming years, respectively. 20%
10%
Potential for capital distribution underpinned by increasingly low risk
0%
business model and ample excess capital.
2015 2016 2017 2018 2019
Share repurchase programmes Dividends
Earnings per share (DKK) Book value per share (DKK)
40 500
35 450
400
30
350
25 300
20 250
15 200
150
10
100
5 50
0 0
2015 2016 2017 2018 2019 2020 2015 2016 2017 2018 2019 2020
Earnings per share Book value per share
Note: Payout ratio is based on paid out dividends and conducted share repurchases in subsequent calendar year. 36Financial results and key figures
Jyske Bank
Loans and
Profit before tax Shareholders' Total assets
Year Net profit (DKKm) Return on equity advances Deposits (DKKbn) Number of FTEs
(DKKm) equity (DKKm) (DKKbn)
(DKKbn)
1997 584 443 4,772 9.6% 36.6 41.5 63.1 2,671
1998 710 511 5,173 10.3% 39.7 43.8 76.9 2,772
1999 1,276 897 5,421 16.9% 49.8 49.8 92.6 2,923
2000 1,255 1,083 5,887 19.2% 75.4 52.3 127.4 3,107
2001 890 623 6,174 10.3% 82.5 54.4 133.2 3,418
2002 1,083 511 6,658 8.0% 95.3 59.0 153.2 3,359
2003 1,809 1,284 7,843 17.7% 63.8 63.8 116.4 3,547
2004 1,960 1,407 7,858 17.9% 74.6 68.7 125.2 3,713
2005 2,174 1,701 9,477 19.6% 90.9 79.8 141.6 4,026
2006 2,810 2,134 9,637 22.3% 107.2 88.8 160.7 4,216
2007 2,273 1,735 9,704 17.9% 134.0 112.7 214.3 4,145
2008 1,307 988 10,722 9.7% 129.1 117.0 236.8 3,996
2009 597 471 12,523 4.1% 110.6 109.3 224.5 3,877
2010 1,003 757 13,352 5.9% 114.0 115.8 244.1 3,847
2011 601 493 13,846 3.6% 124.5 127.3 270.2 3,809
2012 851 596 15,642 4.0% 118.6 121.0 258.2 3,574
2013 2,301 1,808 17,479 10.9% 131.4 131.4 262.0 3,774
2014 3,103 3,089 27,561 13.7% 361.8 152.7 541.7 4,191
2015 3,204 2,476 30,040 8.6% 396.2 144.9 543.4 4,021
2016 3,906 3,116 31,038 10.1% 422.4 154.6 586.7 3,981
2017 4,002 3,143 32,023 9.7% 447.7 160.0 597.4 3,932
2018 3,140 2,500 31,786 7.6% 462.8 148.7 599.9 3,698
2019 3,079 2,440 32,453 7.1% 485.9 140.2 649.7 3,559
2020 2,110 1,609 33,325 4.4% 491.4 137.0 672.6 3,318
37Macroeconomics Summary 03 Financial results 12 Capital and liquidity 18 Volumes 21 Sustainability 26 Jyske Bank in brief 31 Macroeconomics 38 Calendar and contacts 42
Macroeconomics
Real gross domestic product (index 2010, y/y) Inflation rate (HICP, y/y)
10% 6%
5% 5%
4%
0%
3%
-5%
2%
-10%
1%
-15% 0%
-20% -1%
2009
2016
2004
2005
2006
2007
2008
2009
2010
2011
2012
2013
2014
2015
2016
2017
2018
2019
2020
2004
2005
2006
2007
2008
2010
2011
2012
2013
2014
2015
2017
2018
2019
2020
Denmark Euro area Denmark Euro area
Unemployment rate Interest rates, Denmark (monthly averages)
14% 7%
12% 6%
5%
10%
4%
8%
3%
6%
2%
4%
1%
2% 0%
0% -1%
2009
2016
2004
2005
2006
2007
2008
2009
2010
2011
2012
2013
2014
2015
2016
2017
2018
2019
2020
2004
2005
2006
2007
2008
2010
2011
2012
2013
2014
2015
2017
2018
2019
2020
Denmark Euro area 3-month interbank rate 10-year government bond yield
Source: Eurostat. 39Macroeconomics
Real estate prices, Denmark (y/y) House prices to disposable income (2015=100)
30% 140
25%
20% 130
15%
120
10%
5%
110
0%
-5% 100
-10%
-15% 90
-20%
80
2004
2005
2006
2007
2008
2009
2010
2011
2012
2013
2014
2015
2016
2017
2018
2019
2020
2004
2020
2005
2006
2007
2008
2009
2010
2011
2012
2013
2014
2015
2016
2017
2018
2019
One-family houses Owner-occupied flats Denmark Euro area
Lending growth, Denmark (y/y) Economic Sentiment Indicator
30% 130
25% 120
20%
110
15%
100
10%
5% 90
0% 80
-5%
70
-10%
60
-15%
2005
2021
2004
2006
2007
2008
2009
2010
2011
2012
2013
2014
2015
2016
2017
2018
2019
2020
50
2015
2004
2005
2006
2007
2008
2009
2010
2011
2012
2013
2014
2016
2017
2018
2019
2020
2021
Bank lending to households Mortgage lending to households
Bank lending to non-financial corp. Mortgage lending to non-financial corp. Denmark Euro area
Sources: Statistics Denmark, OECD, Eurostat. 40Forecast
Financial results and key figures DKKbn Real growth (%)
Danish economy
2019 2018 2019 2020 2021 2022
Consumer spending 1,076 2.7 1.4 -5.0 2.1 3.8
Public spending 557 0.3 1.2 -1.5 1.5 0.9
Fixed gross investment 513 4.8 2.8 1.1 3.6 3.7
Inventory investment* 18 0.3 -0.3 -0.2 0.2 0.0
Exports 1,362 3.2 5.0 -9.2 4.7 6.7
Imports 1,190 4.8 2.4 -7.7 4.5 6.7
Gross domestic product (GDP) 2,335 2.2 2.8 -4.1 2.8 3.3
Balance of payments
- DKKbn 158 207 165 186 184
- percentage of GDP 7.0 8.9 7.3 7.9 7.5
Public budget balance
- DKKbn 16 88 -73 -45 -45
- percentage of GDP 0.7 3.8 -3.2 -1.9 -1.8
Unemployment
- Gross unemployment, average (thousands) 108 104 134 131 115
- Percentage of workforce 3.5 3.4 4.3 4.2 3.7
Employment, avg. (thousands) 2,966 3,003 2,979 2,994 3,022
Inflation (%) 0.8 0.8 0.4 0.9 1.4
Wage index (Private, %) 2.2 2.0 1.9 2.1 2.4
House prices (nominal prices, %) 3.8 3.0 3.2 4.1 2.3
Danmarks Nationalbank’s lending rate, year-end (%) 0.05 0.05 0.05 0.05 0.05
Danmarks Nationalbank’s CD rate, year-end (%) -0.65 -0.75 -0.60 -0.60 -0.60
* Contribution to growth as a percentage of the preceding year's GDP.
Sources: Statistics Denmark, Jyske Bank as of 17 December 2020. 41Financial calendar and contacts Financial calendar 2021 23 Feb. 2021 Announcement of the 2020 results 23 Feb. 2021 Annual report 23 Feb. 2021 Risk Management Report 2020 23 Mar. 2021 Annual General Meeting 04 May. 2021 Interim report for the first quarter of 2021 17 Aug. 2021 Interim report for the first half of 2021 02 Nov. 2021 Interim report for the first nine months of 2021 Trine Lysholt Nørgaard Head of Investor Relations & Sustainability Phone: +45 89 89 64 29 Mobile: +45 21 58 25 15 E-mail: trine.norgaard@jyskebank.dk Simon Hagbart Madsen Senior Analyst, Investor Relations & Sustainability (Equity IR) Phone: +45 89 89 71 85 Mobile: +45 24 44 83 70 E-mail: simonhagbart@jyskebank.dk Note: ir@jyskebank.dk and investor.jyskebank.com/investorrelations for further information.
Disclaimer

This presentation and the information contained therein is furnished and has been prepared solely for information purposes by Jyske Bank A/S. It is furnished for
your private information with the express understanding, which recipient acknowledges, that it is not an offer, recommendation or solicitation to buy, hold or
sell, or a means by which any security may be offered or sold.

The information contained and presented in this presentation, other than the information emanating from and relating to Jyske Bank A/S itself, has been
obtained by Jyske Bank A/S from sources believed to be reliable. Jyske Bank A/S can not verify such information, however, and because of the possibility of
human or mechanical error by our sources, Jyske Bank A/S or others, no representation is made that such information contained herein is accurate in all
material respects or complete. Jyske Bank A/S does not accept any liability for the accuracy, up-to-dateness, adequacy, or completeness of any such
information and is not responsible for any errors or omissions or the result obtained from the use of such information. The statements contained herein are
statements of our non-binding opinion, not statement of fact or recommendations to buy, hold or sell any securities. Changes to assumptions may have a
material impact on any performance detailed. Historic information on performance is not indicative of future performance. Jyske Bank A/S may have issued, and
may in the future issue, other presentations or information that are inconsistent with, and reach different conclusions from, the information presented herein.
Those presentations or the information reflect the different assumptions, views and analytical methods of the analysts who prepared them and Jyske Bank A/S
is under no obligation to ensure that such other presentations or information are brought to the attention of any recipient of the information contained herein.

Nothing in this presentation constitutes investment, legal, accounting or tax advice, or a representation that any investment or strategy is suitable or
appropriate to your individual circumstances, or otherwise constitutes a personal recommendation to you. This presentation is intended only for and directed to
persons sufficiently expert to understand the risks involved, namely market professionals. This publication does not replace personal consultancy. Prior to
taking any investment decision you should contact your independent investment adviser, your legal or tax adviser, or any other specialist for further and more
up-to–date information on specific investment opportunities and for individual investment advice and in order to confirm that the transaction complies with
your objectives and constraints, regarding the appropriateness of investing in any securities or investment strategies discussed herein.

Jyske Bank A/S or its affiliates (and their directors, officers or employees) may have effected or may effect transactions for its own account (buy or sell or have a
long or short position) in any investment outlined herein or any investment related to such an investment. Jyske Bank A/S or its affiliates may also have
investment banking or other commercial relationship with the issuer of any security mentioned herein. Please note that Jyske Bank A/S or an associated
enterprise of Jyske Bank A/S may have been a member of a syndicate of banks, which has underwritten the most recent offering of securities of any company
mentioned herein in the last five years. Jyske Bank A/S or an associated enterprise may also have, within the last three years, served as manager or co-manager
of a public offering of securities for, or currently may make a primary market in issues of, any or all of the entities mentioned herein or may be providing, or have
provided within the previous 12 months, significant advice or investment services in relation to the investment concerned or a related investment.

Any particular security or investment referred to in this presentation may involve a high degree of risk, which may include principal, interest rate, index, currency,
credit, political, liquidity, time value, commodity and market risk and is not suitable for all investors. Any securities may experience sudden and large falls in their
value causing losses equal to the original investment when that investment is realized. Any transaction entered into is in reliance only upon your judgment as to
both financial, suitability and risk criteria. Jyske Bank A/S does not hold itself out to be an advisor in these circumstances, nor does any of its staff have the
authority to do so.

                                                                                                                                                                     43
You can also read