Market developments in 2019 - Mortgage credit institutions - The Danish FSA
←
→
Page content transcription
If your browser does not render page correctly, please read the page content below
Mortgage credit institutions

Market developments in
         2019
Contents 1. Summary ..........................................................................................................................1 2. Mortgage credit institutions' earnings ..............................................................................3 3. Interest rate trends ...........................................................................................................6 4. Mortgage credit institutions' lending activity ....................................................................8 5. Property market .............................................................................................................12 6. Supplementary collateral ...............................................................................................14 7. Supervision and regulation ............................................................................................16 8. Annex 1: Financial statements of mortgage credit institutions 2015–2019...................24 9. Annex 2: Mortgage credit institutions, financial ratios 2015–2019 ................................26
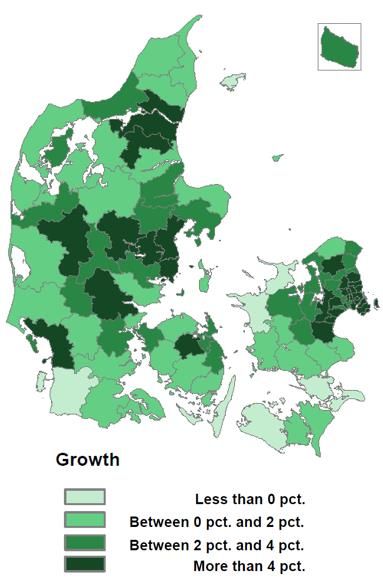
1.   Summary
Mortgage credit institutions saw their total profits rise from DKK 18.5 billion in 2018 to DKK
21.7 billion in 2019, thereby achieving their highest level for the period 2007-2019. This rise
is mainly attributable to higher value adjustments through capital gains on fund holdings.
Mortgage credit lending grew 3.8 per cent in 2019, and positive lending growth for owner-
occupied housing was widespread throughout the country, except for a few areas where
the lending growth fell, see Figure 1.

Figure 1: Positive mortgage credit lending growth for owner-occupied housing in
most of the country

Note: Mortgage credit lending growth for owner-occupied housing by municipality.
Source: Reports to the Danish FSA.

Short and long-term mortgage bond yields continued to decline in general in 2019. This re-
sulted in a historically high remortgaging activity against low fixed interest rates. The long
period of falling mortgage bond yields turned after the outbreak of COVID-19, which has led
to economic and financial turmoil worldwide. The mortgage credit market experienced ma-
jor declines in value during the week when the COVID-19 pandemic seriously impacted
Denmark. This happened as part of a general movement across bond markets, including
the safest government bonds, and not specifically for mortgage credit. In particular, it was
long-term mortgage bonds which dropped in price. The values have partially readjusted
and market participants are reporting the mortgage credit market's return to normal. Meas-
ured in relation to the government bond curve, long-term convertible mortgage bonds are
trading at the same spread as in the autumn of 2019.

Market developments for mortgage credit institutions in 2019                                  1
The low interest rate level in 2019 supported an overall rise in property prices, positive mort-
gage credit lending growth for most property categories and, along with the guidelines on
risky loans, an increase in mortgage credit loans with instalments and fixed interest rates. If
or when interest rates rise, this may have a downward effect on property prices, thereby
dampening the mortgage credit institutions' future lending growth. In the event of interest rate
increases, it is positive that many existing borrowers have secured fixed-rate loans so that
their payments are not affected.

The economic and financial turmoil accompanying the current COVID-19 crisis is expected
to primarily affect mortgage credit institutions' future earnings through a lower level of lend-
ing activities, value adjustments and increased loan impairments for the households and
businesses which will be under pressure during and after the crisis. Impairments are ex-
pected, among other things, to rise for loans granted by mortgage credit institutions to of-
fice and business properties since business enterprises stand to be hit particularly hard by
the crisis. On the other hand, interest rate fluctuations may lead to higher earnings for mort-
gage credit institutions as a result of higher remortgaging activity. The Danish mortgage
credit sector is well-capitalised and well-equipped to withstand and absorb losses.

Mortgage credit institutions have been granted a temporary exemption from carrying out
physical inspections of primarily residential properties as a result of the infection risk from
COVID-19. This helps ensure that mortgage credit loans can continue to be granted
through property sales and additional loans for these segments.

Market developments for mortgage credit institutions in 2019                                      2
2. Mortgage credit institutions' earnings
Mortgage credit institutions' earnings rose in 2019 and remain at a high level from a historical
perspective. The institutions' financial statements contain the following highlights for 20191:
Pre-tax profit increased by 17.7 per cent. The pre-tax return on equity rose from 8.6 to
9.7 per cent.
The rise in profit can mainly be attributed to an increase in value adjustments.
Net interest income increased by 3 per cent despite a decline in interest income.
Fees and commission income increased by DKK 1.6 billion (55.6 per cent), while fees
and commissions paid increased by DKK 2.6 billion. (40.2 per cent). This led to a de-
crease in net fee income.
Loan impairments rose by 10.1 per cent, but this happened from a low starting point. The
increase is primarily attributable to increases in impairments on private residential prop-
erties for rent, as well as on office and business properties.
Lending increased by 3.8 per cent, which was supported by low bond yields and generally
rising property prices.
The mortgage credit institutions' total pre-tax profit was DKK 21.7 billion in 2019, see Figure
2. Earnings rose in relation to a pre-tax profit of DKK 18.5 billion in 2018. Both inclusive and
exclusive earnings in subsidiaries were at the highest level for the period 2007-2019. Lending
also continued to rise from DKK 2,884 billion in 2018 to DKK 2,992 billion in 2019 and was
also at the highest level for the period 2007-2019.
Figure 2: Earnings and lending increased in the Danish mortgage credit institu-
tions
DKK bn DKK bn %
25 3,500 10
9
3,000
20 8
2,500 7
15 6
2,000
5
10 1,500 4
1,000 3
5 2
500
1
0 0 0
2011
2006
2007
2008
2009
2010
2012
2013
2014
2015
2016
2017
2018
2019
Profit before tax, incl. earnings in subsidiaries
Loans Lending growth
Profit before tax, excl. earnings in subsidiaries
Note: The graph on the left shows the trend for the mortgage credit institutions' pre-tax profit, including and excluding
the result of equity investments in associates and affiliates. Loans in the figure on the right are calculated excluding
guarantees, after impairments and excluding loans to other MFIs.
Source: Reports to the Danish FSA.
1 The full financial statement and financial ratio table for mortgage credit institutions can be seen in Annexes 1 and 2.
Market developments for mortgage credit institutions in 2019 3Return on equity before tax indicates how much of a return on investment owners have received on capital invested2. The increase in the return on equity between 2018 and 2019 was mainly driven by higher capital gains on fund holdings that were widespread and driven by shares, bonds and derivatives, as well as by increased activity as a result of remortgaging. Figure 3 illustrates how mortgage credit institutions' expenditure and income categories affected the pre-tax return on equity between 2018 and 2019. Figure 3: Increase in the return on equity, primarily driven by value adjustments Note: The figure shows the factors which have affected the return on equity before tax (ROE) from 2018 to 2019. Other items include loan impairments and receivables, etc., the profit from equity investments in associates and affiliates, other operating expenses, staff and administration expenses, income from activities during liquidation and from amorti- sation and write-downs on intangible and tangible assets. Source: Reports to the Danish FSA. Administration charges in 2019 was on a par with 2018. Its amount fell relative to lending, see Figure 4. This is partly due to the fact that a number of borrowers chose loans with instalments and fixed interest rates, where the administration rate is generally lower. Figure 4 also shows that fee revenues and expenses increased substantially in 2019, which must be seen in light of the historically high remortgaging activity3. The remortgaging activity oc- curred as interest rates fell, and the difference between short-term and long-term interest rates continued to decrease in 2019. This development made it both attractive to convert from a higher to a lower fixed interest rate and to convert from a variable to a fixed interest rate loan. The remortgaging activity had a positive impact on the mortgage credit institutions' fee income, while the fees paid and commission expenses also increased, as the mortgage credit institutions pay fees to the banks for arranging their loans. 2 Profit before tax/equity. 3 Mortgage credit institutions routinely pass on a portion of their core earnings to the intermediary banks, which is included in the item fees and commission expenses. It generally supports the large difference between fees and commission in- come and fees and commission expenses. Market developments for mortgage credit institutions in 2019 4
Figure 4: Administration charges to lending decreased and fee income increased
substantially

DKK bn                                                   % DKK bn
30                                                    1.00 11

                                                      0.90
                                                             9
25
                                                      0.80
                                                             7
                                                      0.70
20
                                                      0.60   5

15                                                    0.50   3
                                                      0.40
                                                             1
10
                                                      0.30
                                                             -1
                                                      0.20
  5
                                                      0.10 -3

  0                                                   0.00 -5
      2007
      2008
      2009
      2010
      2011
      2012
      2013
      2014
      2015
      2016
      2017
      2018
      2019

                                                                  2005
                                                                  2006
                                                                  2007
                                                                  2008
                                                                  2009
                                                                  2010
                                                                  2011
                                                                  2012
                                                                  2013
                                                                  2014
                                                                  2015
                                                                  2016
                                                                  2017
                                                                  2018
                                                                  2019
           Net interest income                                        Fee and commision income
           of which administration charges                            Fees paid and commission expenses
           Net interest income as % of lending                        Dividends on shares etc.
           Administration income as % of lending                      Net fee and commission income

Note: Loans in the left graph are calculated after impairments and exclusive loans to other MFIs. Net interest earnings
as % of lending and administration charges as % of lending are shown on the right axis.
Source: Reports to the Danish FSA.

Market developments for mortgage credit institutions in 2019                                                              5
3. Interest rate trends
The long-term and short-term mortgage interest rates fell overall in 2019, see Figure 5. The
long-term interest rate fell more than the short-term one, leading to a fall in the interest rate
spread between the two interest rates of 0.6 percentage points. The Danish mortgage bond
market is generally considered a safe haven by investors. It was therefore as expected that
the Danish mortgage credit rates continued to fall at the beginning of 2020, coinciding with
the spread of the COVID-19 virus and the greater uncertainty on the financial markets which
this entailed.
Figure 5: Interest rate level remained low
%
10
9
8
7
6
5
4
3
2
1
0
-1
-2
Short-term rates Long-term rates Interest rate spread
Note: The long-term interest rate covers 30-year fixed-rate, convertible newly-issued mortgage bonds during the relevant
week. The short-term interest rate covers the one and two-year non-convertible newly issued mortgage bonds during the
relevant week, which underlie the repayment of variable-rate mortgages.
Source: Finance Denmark.
When Europe was hit by the COVID-19 pandemic, it generally caused major capital losses,
including for oil, shares, credit bonds and even government bonds. The trend in Danish
mortgage interest rates also reversed the week when COVID-19 impacted Denmark. Prices
for Danish mortgage bonds fell significantly and interest rates rose, see Box 1. Prices for
mortgage bonds have subsequently readjusted, but interest rates remain above the histori-
cally low levels immediately before the COVID-19 crisis. Measured in relation to the gov-
ernment bond curve, long-term convertible mortgage bonds are trading at the same spread
as in the autumn of 20194.
4 The duration of convertible mortgage bonds is increased when interest rates increase due to their built-in conversion
right (negative convexity), whereas the duration of government bonds in the event of interest rate increases is largely
unchanged. In isolation, this results in an increased exchange rate spread for interest rate increases.
Market developments for mortgage credit institutions in 2019 6Box 1: The impact of the COVID-19 crisis on the mortgage bond market
Uncertainty during the COVID-19 crisis has also impacted traditionally safe securities such
as mortgage bonds and government bonds, which have provided a safe haven in other cri-
ses, see Figures 6 and 7. The mortgage credit market experienced major price drops during
the week when the COVID-19 pandemic impacted Denmark, one of the reasons being that
many investors did not want additional long-term items on the books in the uncertain market.
In particular, it was long-term mortgage bonds which dropped in price. The price falls oc-
curred in a market with limited turnover and did not reflect large sell-back transactions. Prices
have subsequently readjusted and market participants are reporting the mortgage credit mar-
ket's return to normal.
Figure 6: COVID-19 affected interest rates and prices for mortgage bonds
Price Effective interest rate as %
106 2.0
104 1.5
102
1.0
100
98 0.5
96
0.0
94
92 -0.5
90 -1.0
1-year bullet bond 1-årig stående obl.
3-year bullet bond 3-year bullet bond
20-year bullet bond, 0.5% 20-year bullet bond, 0.5%
30-year bullet bond, 1% 30-year bullet bond, 1%
Price 100 0 pct.
Note: The data covers selected mortgage bonds for the period from 20 June 2019 to 27 April 2020. The prices used are
Nasdaq CPH Consolidated reference prices.
Source: Nasdaq.
Figure 7: Major increase in government bond yields due to COVID-19
%
0
-0.1
-0.2
-0.3
-0.4
-0.5
-0.6
-0.7
-0.8
-0.9
10-year government bond yield
Note: Data for the period 20/06/2019 to 27/04/2020.
Source: Bloomberg.
Market developments for mortgage credit institutions in 2019 74. Mortgage credit institutions' lending activity
The low interest rate level in 2019 coincided with positive lending growth for mortgage credit
institutions. In 2019, the majority of mortgage credit institutions' lending consisted of loans
involving fixed interest rates and instalments, see Figure 8. The amount of outstanding vari-
able interest rate loans continued to decline. Loans involving instalments increased from 49.5
per cent of the mortgage credit institutions' lending portfolio to 51.7 per cent in 2019, while
fixed-rate loans rose from 35.1 per cent in 2018 to 37.9 per cent in 20195.
Figure 8: Fixed-rate loans rose, while the number of interest-only variable-rate
loans declined
% of total lending
45%
40%
35%
30%
25%
20%
15%
10%
5%
0%
2011 2012 2013 2014 2015 2016 2017 2018 2019
Fixed-rate loans with instalments
Interest-only fixed-rate loans
Variable-rate loans with instalments
Interest-only variable-rate loans
Loans with money-market-based interest with instalments
Interest-only loans with money market-based interest
Note: Lending is calculated as the mortgage credit institutions' loans secured by mortgages on property before impair-
ments at fair value at the end of the period. Index loans are not included. Interest-only mortgage loans include interest-
only mortgage loans where the option is both currently exercised and not currently exercised.
Source: Reports to the Danish FSA.
The fact that more borrowers chose fixed-rate loans must be viewed in light of the historically
low interest rate level and the decreasing interest rate spread between the short-term and
long-term mortgage rates in 2019, which made it cheap and attractive for borrowers to protect
themselves against future interest rate increases. In addition, the guidelines for access to
risky loans restrict mortgage credit institutions from granting customers with a high LTV ratio
and debt factor the riskier types of loans, see Chapter 7. In 2019, for the first time in Denmark
in the history of mortgage lending, the possibility emerged of 10-year convertible mortgage
credit loans with a negative fixed interest rate of -0.5 per cent. This type of loan had, as of
early March 2020, a circulating amount of around DKK 1.8 billion6.
Mortgage credit institutions' lending rose in 2019 for the majority of the property categories,
see Figure 9. The only exceptions were agricultural properties and properties for social, cul-
tural and educational purposes, with loans falling by 1.0 and 0.3 per cent respectively. At the
5 Index loans are not included in these calculations.
6 Source: Nasdaq. The circulating amount denotes the amount of the total bond issue that is in circulation.
Market developments for mortgage credit institutions in 2019 8top of the list were private residential properties for rent, where lending increasing by 12.8
per cent.
Figure 9: Lending for owner-occupied housing and residential rental properties is
sharply on the rise
DKK bn DKK bn
350 1,750
1,550
300
1,350
250
1,150
200
950
150
750
100
550
50 350
Cooperative housing
Owner-occupied housing
Agricultural properties
Private residential properties for rent
Subsidised residential buildings
Office and commercial properties
Holiday properties
Note: Lending is calculated as the mortgage credit institu-
tions' loans before impairments at fair value at the end of the period. Index loans are not included. Industrial and handi-
craft business properties, as well as properties for social, cultural and educational purposes are not included in the fig-
ure, as mortgage lending for both of these property categories was rounded below DKK 50 billion in 2019.
Source: Reports to the Danish FSA.
Mortgage credit loans for office and business properties accounted for the majority of com-
mercial lending in 2019, see Figure 9. Office and business properties include retail stores,
restaurants, hotels, recreational facilities, conference and training centres. These are all
properties in sectors which stand to be severely affected during the COVID-19 crisis, with
many of them having been forced to close since mid-March. There is a risk that a number of
companies in these sectors will not be able to pay their rents as long as the outbreak of
COVID-19 and restrictions on their operations continue7. If this trend continues and spreads,
it may affect mortgage credit institutions, as property owners may be unable to pay the in-
stalments on their loans. There is the added problem that certain sectors, including clothing
stores, have already been subject to pressure by competition from e-commerce.
Figure 10 shows the trend in the mortgage credit sector's impairment rates for loans for office
and business properties, other properties excluding owner-occupied homes and holiday
7 The Government has launched a number of initiatives aimed at alleviating the losses suffered by companies as a result
of the COVID-19 crisis, including for instance, businesses which have leases in mortgage-financed commercial properties.
Market developments for mortgage credit institutions in 2019 9homes and total lending respectively. The impairment rate on loans for office and business
properties has historically been higher than for total loans, but on par with loans for other
properties. Overall, the impairment rates have followed the same trend throughout the period.
The impairment rate may rise as a result of the COVID-19 crisis, including as a result of
possible lockdowns and potential bankruptcies affecting retail stores, hotels and restaurants,
etc.
Figure 10: Relatively high impairments on office and business properties
%
1.00
0.90
0.80
0.70
0.60
0.50
0.40
0.30
0.20
0.10
0.00
2009 2010 2011 2012 2013 2014 2015 2016 2017 2018 2019
Office and commercial properties
Other properties excluding owner-occupied homes and holiday homes
Total
Note: The impairment rate is defined as the accumulated impairments for the year in relation to mortgage credit loans
before write-downs. Other properties, excluding owner-occupied and holiday homes, covered by mortgage lending in-
clude subsided buildings for housing, cooperative housing, private residential rental properties, industrial and handicraft
association properties, agricultural properties, social, cultural and educational properties, as well as other properties. In
total, mortgage credit loans for owner-occupied homes and holiday homes are also included.
Source: Reports to the Danish FSA.
LTV ratios
Mortgage credit institutions' loan-to-value (LTV) ratio expresses the ratio of the loans with
security in the properties to the values of these properties. For total mortgage lending, the
average LTV ratio has overall been in decline since 2014, see Figure 11, as a result of rising
housing prices and the fact that more people are choosing mortgages with instalments. The
average LTV ratio for new loans has been more volatile over the same period, but has fallen
by 7 percentage points since 2016, and the gap with the average LTV ratio for total lending
has decreased. At the end of 2019, the average LTV ratio for total lending and new lending
was 57 per cent and 62 per cent respectively.
Market developments for mortgage credit institutions in 2019 10Figure 11: Average LTV ratio fell in 2019
%
80
75
70
65
60
55
50
2014 2015 2016 2017 2018 2019
LTV (total lending) LTV (new lending)
Note: The LTV ratio is calculated as a simple average of the mortgage credit institutions' exposure-weighted LTV ratios
for loans.
Source: Reports to Danish the FSA.
Market developments for mortgage credit institutions in 2019 115. Property market
The low interest rate level in 2019 also coincided with overall rising property prices, and the
number of sales increased for single-family houses as well as for factory and warehouse
properties, see Figures 12 and 138.
Figure 12: Prices of owner-occupied houses rose
Index (2006=100) Number
140 100,000
90,000
120
80,000
100 70,000
80 60,000
50,000
60 40,000
40 30,000
20,000
20
10,000
0 0
Single-family houses, sales Owner-occupied flats, sales
Single-family houses, price Owner-occupied flats, price
Note: The number of sales covers the total sales and is shown on the right axis.
Source: Statistics Denmark.
Figure 13: Prices rose for several selected property categories
Index (2006=100) Number
160 4500
140 4000
120 3500
3000
100
2500
80
2000
60
1500
40 1000
20 500
0 0
1998
2005
2012
2019
1992
1993
1994
1995
1996
1997
1999
2000
2001
2002
2003
2004
2006
2007
2008
2009
2010
2011
2013
2014
2015
2016
2017
2018
Properties with 4 apartments or more, sales Purely commercial properties, sales
Factories and warehouses, sales Agriculture total, sales
Purely commercial properties, price Factories and warehouses, price
Agriculture total, price Properties with 4 apartments or more, price
Note: The price trend for properties with four or more apartments is used here as a measure of the price trend for rental
properties. The number of sales covers annual sales with a price calculation and is shown on the right axis.
Source: Statistics Denmark.
8 Based on the selected property categories as shown in the figures.
Market developments for mortgage credit institutions in 2019 12Interest rate increases result in higher payments on new loans and variable rate loans. There- fore, all things being equal, interest rate increases will have an adverse effect on property prices. The effect will be amplified if it coincides with borrowers generally refraining from property purchases or an economic downturn, including as a result of COVID-19. The COVID-19 crisis is expected to cause a fall in housing prices. At the beginning of April, the Danish Economic Councils published an analysis of the situation in which they set out two scenarios9. According to the analysis, prices for single-family houses are expected to fall between 8.2 and 11.1 per cent in 2020. The COVID-19 crisis may also affect the prices of other property categories. This may hap- pen, for example, as a result of lower expectations of the earning potential generated through, among other things, office and business properties. 9 https://dors.dk/oevrige-publikationer/prognoseopdatering/corona-scenarier-dansk-oekonomi-offentlige-finanser. Market developments for mortgage credit institutions in 2019 13
6. Supplementary collateral
The requirement for supplementary collateral under Danish covered bonds legislation obliges
mortgage credit institutions issuing covered bonds and covered mortgage bonds to provide
compensatory collateral to bond holders if property prices fall so much that the loan limit is
exceeded.

Conversely, a favourable economic climate with rising property prices reduces the need to
post supplementary collateral for mortgage credit institutions when the level of lending is
unchanged. Figure 14 shows that the statutory requirement for supplementary collateral has
declined since late 2012.

Figure 14: The statutory requirement for supplementary collateral has declined
  DKK bn                                                                                                  % of issuances
 300                                                                                                                   8

                                                                                                                       7
 250

                                                                                                                       6

 200
                                                                                                                       5

 150                                                                                                                   4

                                                                                                                       3
 100

                                                                                                                       2

  50
                                                                                                                       1

   0                                                                                                                   0

              Additional supplementary collateral
              Mandatory supplementary collateral
              Mandatory supplementary collateral vs. covered bond/covered mortgage bond (right-hand axis)

Source: Reports to the Danish FSA.

If property prices fall drastically, individual mortgage credit institutions may be forced to ob-
tain financing from the market to meet the supplementary collateral requirement10. Mortgage
credit institutions typically have sufficient capital adequacy to meet the statutory requirement
for supplementary collateral so that, among other things, they can obtain a high credit rating
for the bonds. Additional supplementary collateral for Q4 2019 amounted to DKK 151 billion,
as opposed to DKK 122 billion for the same period the previous year.

10 Only particularly safe asset types can be used as supplementary collateral. In practice, they are predominantly gov-
ernment bonds and exposures to credit institutions, including, under certain conditions, guarantees from credit institutions.

Market developments for mortgage credit institutions in 2019                                                               14
Mortgage credit institutions stress-test and annually assess the impact of a property price
drop on their statutory supplementary collateral. Figure 15 shows the impact that a decline
in property prices of 5, 10 and 20 per cent respectively is expected to have on the mortgage
credit institutions' statutory requirement to provide supplementary collateral in relation to the
actual supplementary collateral posted as at Q4 2019, when all other factors are retained.
This is compared to the total supplementary collateral posted in Q4 2019.
Figure 15: Mortgage credit institutions should be able to counteract major property
price drops
180%
160%
140%
120%
100%
80%
60%
40%
20%
0%
Q4 2019 Property price Property price Property price
drop of 5% drop of 10% drop of 20%
Statutory supplementary collateral in relation to actual supplementary collateral for Q4 2019
100%
Note: The figure shows statutory vs. supplementary collateral actually provided as at Q4 2019 and the statutory supple-
mentary collateral vs. supplementary collateral actually provided as at Q4 2019 in the event of a property price drop of
5, 10 and 20 per cent respectively, estimated by selected mortgage credit institutions.
Source: Reports to the Danish FSA.
At sector level, the selected mortgage credit institutions still expect to be able to absorb a
property price drop of more than 10 per cent with their most recently reported supplementary
collateral, when all other factors are retained. A general property price drop of 20 per cent
will, on the other hand, mean that the statutory requirement for supplementary collateral will
be greater than the mortgage credit institutions initially anticipated at the end of 2019, see
Figure 15. This is potentially one of the biggest risks for the mortgage credit sector. The
Danish mortgage credit model is otherwise generally structured with the aim of ensuring that
risks other than credit risk, such as liquidity and market risks, do not significantly affect the
mortgage credit institution.
Market developments for mortgage credit institutions in 2019 157. Supervision and regulation The Danish FSA strives to ensure that supervision and regulation continuously help reduce the overall risks for mortgage credit institutions, consumers and businesses, and reinforce financial stability. Mortgage credit given COVID-19 exemption From mid-March 2020, the Danish FSA has decided to grant a temporary exemption from the requirement that internal inspections must be carried out during the mortgage credit in- stitutions' valuation of primarily residential properties. This is being done to minimise the risk of spreading the infection. Mortgage credit institutions can therefore price properties and provide loans without physi- cally entering the properties, if they consider that the basis for assessing the properties' value is adequate. Therefore, in the coming period, external inspection of owner-occupied proper- ties will be sufficient. The exemption ensures that mortgage credit institutions can continue to provide loans, thereby helping to support the housing market. The exemption increases the risk of incorrect valuation of properties, but the FSA considers that the risk is limited, one of the reasons being that the right to grant an exemption is only temporary. The institutions will register the cases where they have used the right to grant an exemption, and the FSA will follow up on these if it is considered relevant. Supervisory Diamond is now fully implemented The Supervisory Diamond for mortgage credit institutions is a supervisory instrument de- signed to prevent excessive risk taking by individual mortgage credit institutions. It was intro- duced in 2014 with partial effect from 2018 and full effect from 2020. The Supervisory Diamond for mortgage credit institutions contains five benchmarks which broadly limit the risk in mortgage credit institutions11. 1. Restricting lending growth (in segments) lowers the risk that excessive growth will occur at the expense of credit quality and that a mortgage credit institution will therefore end up with bad loans on the books. 2. Restricting borrowers' interest rate risk. Customers with variable-rate loans run the risk that their monthly payments will increase significantly when the new interest rate is to be fixed. As a result, the institutions have a higher credit risk than with fixed-rate loans. At the same time, an interest rate increase can affect many customers simultaneously, which poses a significant concentration risk for mortgage credit institutions. The bench- mark addresses this risk by limiting the proportion of the loan portfolio that is variable- interest (with a fixed-interest term of up to two years) and where the LTV ratio is relatively high. 3. Restricting interest-only periods for private individuals. Interest-only periods increase the credit risk in mortgage credit institutions if customers do not use the interest-only period to consolidate in other ways. This is especially true with high LTV ratios, where 11 The Supervisory Diamond's benchmarks with associated boundaries are shown in Figure 16. Market developments for mortgage credit institutions in 2019 16
the institutions are most at risk of losses in the event of declining property prices. The
     benchmark addresses this risk by limiting the proportion of the loan portfolio with rela-
     tively high LTV ratios involving interest-only loans.

4. Restricting loans with short-term funding ensures a certain resilience in the mortgage
   credit system in relation to situations where it may prove difficult for various temporary
   reasons to refinance matured bonds. The quarterly part of the benchmark is intended to
   limit the risk of short-term refinancing problems, while the annual part of the benchmark
   aims to limit the risk of longer-term challenges in refinancing matured bonds. The bench-
   mark therefore ensures that a refinancing auction with, for instance, low investor demand
   for the bonds in question both affects mortgage credit institutions less and affects fewer
   borrowers.

     The Supervisory Diamond's benchmark on the refinancing risk is supplemented by the
     interest rate trigger in the Danish Mortgage Credit Act. The interest rate trigger means
     that matured bonds can be extended by 12 months at a time if there are no purchasers
     for all the necessary new bonds to refinance the matured bonds. The interest rate trigger
     is an emergency solution to refinancing problems.

5. Restricting the concentration risk ensures that a large part of the mortgage credit insti-
   tution's exposures are not concentrated on a few large customers, which could otherwise
   lead to significant losses for the mortgage credit institution if even just one large customer
   get into difficulties.

In fourth quarter of 2019, the mortgage credit institutions were, at sector level, largely com-
pliant with all of the Supervisory Diamond's benchmarks, see Figure 1612. Since 2014, mort-
gage credit institutions at sector level have moved further within the framework for the ma-
jority of benchmarks. So far, two mortgage credit institutions have received a risk warning, in
both cases as a result of exceeding lending growth.

12 Sector level is calculated as all mortgage credit institutions taken together.

Market developments for mortgage credit institutions in 2019                                  17
Figure 16: All benchmarks in the Supervisory Diamond are complied with at sector
level
2019Q4
Concentration risk (100%
2018Q4
of actual core capital)
2014Q4
Interest-only loans (10%
of portfolio – owner- Lending growth – private
occupied houses and 39,0 (15% p.a.)
holiday homes) 8,2 2,9
Limitation of loans with
Lending growth –
short-term funding –
5,0 corporate for residential
annual (12,5% of total 3,3 purposes (15% p.a.)
mortgage credit lending)
Limitation of loans with 0,7
14,5
short-term funding – Lending growth –
annual (25% of total agriculture (15% p.a.)
mortgage credit lending) 13,6 0,6
Interest rate risk in
private property (25% of Lending growth – other
portfolio – extended business (15% p.a.)
housing segment)
Note: The figure shows where mortgage credit institutions were placed at sector level in 2014, 2018 and 2019 (grey,
blue and red lines), in relation to the benchmarks in the Supervisory Diamond (yellow line). The benchmark for lending
growth and loans with short-term funding is divided into subcategories. The values in the figure belong to the red line –
Q4 2019.
Source: Reports to the Danish FSA.
Status of best practice reports – tackling risky loans
The guidelines for best practice for mortgage credit define a number of loans as risky, see
Box 2. Credit institutions should not, as a rule, provide risky loans to high-debt customers.
Market developments for mortgage credit institutions in 2019 18Box 2: Best practice for risky loans
New guidelines for best practice in granting mortgage credit came into effect on Jan-
uary 1st 2018. They generally prevented credit institutions from granting risky real
estate loans to households with high debt.
According to the new guidelines, a loan is regarded as risky if the borrower has a
debt factor (debt as a proportion of income) of more than 4 and an LTV ratio of more
than 60 per cent, as well as one of the following loan types:
Loan with a variable-interest rate with a fixed-interest period of less than five
years, with or without instalments
Loan with interest-only and variable-interest rate with a fixed-interest period of
five years or more.
The objective of the new guidelines is to protect households with high debt so that
they are able to withstand interest rate increases without getting into financial prob-
lems. Concurrently with publication of the new guidelines, the Minister for Industry,
Business and Financial Affairs asked the Danish FSA to monitor trends in risky loan
types. The first report was for the reference period of Q4 2017.
Risky loans may be still be granted because the institutions have the option to devi-
ate from the guidelines in certain specified exceptions. However, a relatively high
proportion can also indicate that the institutions have not fully implemented the
guidelines. The Danish FSA is regularly in dialogue with institutions with sizeable
proportions of risky loans and will address inadequate implementation of the rules
with supervisory responses.
The Danish FSA has observed a continued positive development, where the proportion of
risky new lending in growth areas fell to 1.7 per cent in Q4 2019 against 4.0 per cent in Q4
2018, see Figure 1713. Outside growth areas, the proportion fell from 2.7 per cent to 1.1 per
cent in just a year. The proportion of risky loans in Q4 2019 continued to be higher in the city
of Copenhagen than in the rest of the country. However, the proportions fell significantly
across the regions.
13 Covers mortgage credit loans and similar loans made by banks.
Market developments for mortgage credit institutions in 2019 19Figure 17: Fewer risky new loans
% of gross new lending % of gross new lending
16 20
18
14
16
12
14
10 12
8 10
8
6
6
4
4
2 2
0 0
North Jutland
East Zealand
South Jutland
Copenhagen area
West Jutland
Copenhagen City
Funen
Bornholm
East Jutland
West and South Zealand
North Zealand
2nd quarter
2nd quarter
4th quarter
1st quarter
3rd quarter
4th quarter
1st quarter
3rd quarter
4th quarter
2017 2018 2019
Growth areas Rest of the country
Rest Growth areas 2017 - 4th quarter 2018 - 4th quarter 2019 - 4th quarter
Note: Gross new lending is calculated according to the guidance on mortgage lending for customers with high debt fac-
tors: https://www.finanstilsynet.dk/Ansoeg-og-Indberet/Indberetning-for-finansielle-virksomheder/System/KGFS.
Source: Reports to the Danish FSA.
Examination of 30-year interest-only periods
Most mortgage credit institutions are offering a new type of mortgage that differs substantially
from traditional mortgages which are interest-only for up to 10 years. The new type of home
loan allows for a long-term interest-only period of up to 30 years – for a maximum of 60 per
cent of the property value – combined with a variable-interest rate under certain conditions.
One of these conditions is that the property does not significantly decrease in value during
the term of the mortgage. If this happens, the institution will be able to require the customer
to pay off the loan by instalments anyway. The new types of loan entail more risks for bor-
rowers, which increases expectations for the mortgage credit institutions and the banks
providing the loans, see Box 3.
Market developments for mortgage credit institutions in 2019 20Box 3: New loan types
The new types of loan entail more risks for borrowers and are aimed at a more clearly
defined target group than ordinary mortgage credit loans. Borrowers' finances must
be sufficiently robust so that they can, for instance:
cope with interest rate increases
tolerate their debt not being continuously reduced
tolerate the situation that their debt will still have to be repaid during the term
if the LTV ratio changes drastically.
In addition, it is important that borrowers have a plan for how the debt will be repaid
in time, without causing a situation where borrowers risk ending up with a home
which they cannot afford to live in.
This requires the mortgage credit institutions and banks which arrange the loan to
focus on which customers are suitable for the loan and especially on those who are
not suitable for it. This must be reflected in the marketing for the loan type and guid-
ance and advisory material must ensure that the borrower is aware of the loan's
features and requirements with regard to the person's finances.
In case of loans with long-term interest-only periods, the particular challenge in-
volved is that it may be difficult for borrowers to relate to a distant future. This in turn
may lead to a sense of over-optimism in relation to any future challenges.
The Danish FSA has initiated a study looking at which procedures mortgage credit institutions
have followed when developing the products14. The study focuses in particular on whether
the institutions have defined a target group for the product and tested how this target group
could handle any financial stress. The study also looks at how the institutions advise custom-
ers on the type of loan, both when the agreement is concluded and during the term of the
loan. In light of all this, the Danish FSA will announce what is best practice when the institu-
tions sell these types of loans to consumers and how they should treat customers during the
term of the loan.
Box 4: Product approval procedure rules
Mortgage credit institutions and banks must have procedures for developing new
products. The procedures must ensure that each institution establishes a relevant
target group for which the new product is appropriate and identifies those customers
for whom the product is not suitable. The procedures must also ensure that the in-
stitution tests the product to assess how it will affect customers in a variety of sce-
narios, including stress scenarios. The institutions must provide any distributors with
information about target groups to ensure that the products are only distributed to
relevant customers, and they must monitor the product after it is marketed.
14 See Box 4 for further rules on product approval procedures.
Market developments for mortgage credit institutions in 2019 21Status of use of the general balance principle
In June 2018, the Danish FSA published best practice principles for adhering to the general
balance principle.
At the end of 2018, the Danish FSA asked mortgage credit institutions how they were com-
plying with the new principles. On 19 December 2019, the Danish FSA published an updated
version of the June 2018 article based on the institutions' replies.
Based on the follow-up, the Danish FSA can confirm that two out of six mortgage credit
institutions (including a group with two mortgage companies) currently use the degrees of
freedom featuring in the general balance principle.
The updated article contains the following additions:
The principles will also be widely applied in a modified form to Denmark's Ship Finance
and Danske Bank's covered bond issuances.
The framework for issuances where a derivative link is needed to reduce imbalances
should not exceed 10 per cent of total issuances.
This only applies to issuances which finance properties located in Denmark.
A group approach can be taken when companies are involved, where
both parent and subsidiary companies issue bonds.
If the framework is greater than 5 per cent, it places greater demands for manage-
ment involvement and risk management.
In their choice of product offerings, the institutions should also explicitly consider the conse-
quences of the product offering for the funding side.
Status of the covered bonds directive
On 18 December 2019, two new EU regulations on covered bonds were published:
Directive (EU) 2019/2162 of the European Parliament and of the Council of 27 Novem-
ber 2019 on the issue of covered bonds and covered bond public supervision and
amending Directives 2009/65/EC and 2014/59/EU
Regulation (EU) 2019/2160 of the European Parliament and of the Council of 27 No-
vember 2019 amending Regulation (EU) No 575/2013 as regards exposures in the
form of covered bonds.
The Directive sets out the frameworks for issuing and supervising the issuance of covered
bonds. The directive is intended to replace the earlier general definition of covered bonds in
the UCITS directive. In other words, principles are being set out for bonds to safeguard in-
vestors' legal position. This includes requirements for suitable assets, use of derivatives,
liquidity, supervision and labelling of covered bonds.
The amendment to the regulation tightens the requirements for covered bonds which are
subject to preferential treatment. The key aspect for Denmark is that a requirement for a
minimum level of overcollateralisation is introduced and that the monitoring frequency is in-
creased for residential properties.
Market developments for mortgage credit institutions in 2019 22The directive must be implemented in Danish law if the provisions are not already covered
by existing legislation. In addition, the level of the new overcollateralisation requirement from
the amending regulation must be determined and implemented.
The implementation itself is aimed at providing at least a consolidation law, which must
amend the relevant provisions of the Danish law on mortgage credit loans and mortgage
credit bonds, etc., the Financial Business Act, the law on a ship finance institution and the
law on restructuring and liquidation of certain financial establishments.
The Danish regulation of covered bonds is already largely in line with the directive's require-
ments. However, the legal basis will contain some material changes that will lead to new
requirements for the issuing institutions:
requirements for coverage and overcollateralisation
introduction of new liquidity requirements for the institutions
information for investors
valuation of all immovable property at market value (which is the main rule in Denmark
today).
In addition, the changes will entail some adjustments of a mainly formal nature concerning:
licence provisions
intragroup joint funding
general adaptation to new definitions and disclosure requirements.
The changes are being discussed with industry representatives and Finansiel Stabilitet dur-
ing the spring of 2020. The bill is scheduled to be heard in the autumn of 2020 and tabled in
February 2021.
The directive must be implemented by 8 July 2021 and must apply from 8 July 2022 at the
latest. The amendment to CRR, Article 129, will come into force at the same time, with the
same deadline for implementation and application as the directive, i.e. 8 July 2022.
Market developments for mortgage credit institutions in 2019 238. Annex 1: Financial statements of mortgage credit institutions 2015–2019
2015 2016 2017 2018 2019 Change, 1 year Change, 5 years
DKK mil-
Income statement lions %
Interest income 86,939 78,223 73,150 69,524 67,766 -2.53 -22.05
Interest expenses 63,252 54,625 49,236 46,251 43,790 -5.32 -30.77
Net interest income 23,686 23,599 23,914 23,274 23,975 3.02 1.22
Dividends from assets, etc. 134 173 177 252 217 -13.89 62.14
Fee and commission income 3,186 3,013 2,973 2,833 4,409 55.62 38.38
Fee expenses and commission 5,595 5,542 6,197 6,380 8,946 40.23 59.90
Net interest and fee income 21,412 21,243 20,866 19,980 19,656 -1.62 -8.20
Expenses for staff and administration 4,828 5,876 5,561 5,373 5,077 -5.51 5.15
Other operating income 105 1,126 1,239 1,995 3,074 54.07 2833.76
Other operating expenses 137 266 202 162 204 26.02 49.00
Amortisation and write-downs of intangible and tangible assets 2,155 176 237 99 284 186.28 -86.82
Basic earnings 14,396 16,052 16,106 16,340 17,165 5.04 19.23
Value adjustments - 1,132 805 870 - 916 1,562
Loan write-downs and receivables, etc. 1,868 1,209 874 905 996 10.13 -46.67
Profit from investments in associates 3,195 3,206 5,134 3,933 3,987 1.38 24.80
Profits before tax 14,591 18,853 21,236 18,453 21,717 17.69 48.84
Tax 3,098 3,359 3,417 2,980 3,317 11.31 7.09
Net profit for the year 11,493 15,494 17,820 15,473 18,400 18.92 60.10
Note: The figures are based on the institutions that existed in the individual years. The table shows selected items. In 2019, the mortgage credit sector consisted of Nykredit Realkredit,
Realkredit Danmark, Totalkredit, Jyske Realkredit, DLR Kredit, LR Realkredit and Nordea Kredit. In the profits from investments and equity, Totalkredit is a double entry due to it being part of
the Nykredit Group. The profits from investments can mainly be attributed to subsidiaries in Nykredit Realkredit: Totalkredit and Nykredit Bank. Subsidiaries are included with their net earn-
ings. This means that, in the part of the result attributable to Totalkredit, contribution margin income and expenditure with banks are included in connection with distribution and administration
for the mortgage credit institution. In Nykredit Bank, the net result is also affected by the mortgage credit business and customer relations, e.g. value adjustments of interest rate swap agree-
ments entered into to hedge customers' interest rate risk.
Source: Reports to the Danish FSA.
Market developments for mortgage credit institutions in 2019 242015 2016 2017 2018 2019 Change, 1 year Change, 5 years
Balance sheet items DKK millions %
Cash in hand and demand deposits with central banks 1,915 853 898 809 295 -63.57 -84.60
Receivables from credit institutions and central banks 731,966 793,107 851,461 844,379 1,099,373 30.20 50.19
Loans 2,652,662 2,720,556 2,819,304 2,883,600 2,991,737 3.75 12.78
Loans excl. repos 2,652,662 2,720,556 2,819,304 2,883,600 2,991,737 3.75 12.78
Bonds 199,649 204,058 205,372 167,003 211,208 26.47 5.79
Shares etc. 5,021 5,630 6,095 6,961 6,716 -3.52 33.75
Equity investments in associates 155 161 162 54 49 -9.80 -68.63
Equity investments in affiliates 36,251 39,303 47,360 49,851 59,260 18.88 63.47
Assets linked to pool schemes - - - - -
Intangible assets 220 202 201 257 307 19.50 39.60
Land and buildings 516 523 545 141 795 462.60 54.09
Other property, plant and equipment 218 166 112 113 159 40.23 -27.26
Tax assets 119 172 605 387 273 -29.58 129.57
Assets held temporarily 1,070 1,102 721 667 208 -68.85 -80.57
Other assets 17,154 14,976 12,594 10,174 12,379 21.68 -27.84
Accruals and deferred income 255 273 334 424 464 9.52 81.89
Total assets 3,647,170 3,781,081 3,945,763 3,964,820 4,383,223 10.55 20.18
Debts to credit institutions and central banks 665,453 676,904 711,303 727,340 857,165 17.85 28.81
Deposits - - - 10,500 11,950 13.81
Deposits excl. repos - - - - -
Issued bonds 2,749,817 2,859,033 2,971,770 2,970,099 3,248,851 9.39 18.15
Other liabilities 427 - 8,501 3 3 17.18 -99.24
Accruals and deferred income 26 45 39 26 36 40.29 41.68
Liabilities, total 3,452,839 3,569,879 3,720,646 3,734,095 4,142,826 10.95 19.98
Provisions 620 508 674 513 745 45.08 20.09
Subordinated debt 12,907 19,278 15,792 15,861 16,516 4.13 27.96
Equity 180,804 191,416 208,651 214,350 223,136 4.10 23.41
+Total liabilities 3,647,170 3,781,081 3,945,763 3,964,820 4,383,223 10.55 20.18
Note: The figures are based on the institutions that existed in the individual years. The table shows selected items. In 2019, the mortgage credit sector consisted of Nykredit Realkredit,
Realkredit Danmark, Totalkredit, Jyske Realkredit, DLR Kredit, LR Realkredit and Nordea Kredit. In the profits from investments and equity, Totalkredit is a double entry due to it being part of
the Nykredit Group. The profits from investments can mainly be attributed to subsidiaries in Nykredit Realkredit: Totalkredit and Nykredit Bank. Subsidiaries are included with their net earn-
ings. This means that, in the part of the result attributable to Totalkredit, contribution margin income and expenditure with banks are included in connection with distribution and administration
for the mortgage credit institution. In Nykredit Bank, the net result is also affected by the mortgage credit business and customer relations, e.g. value adjustments of interest rate swap agree-
ments entered into to hedge customers' interest rate risk.
Source: Reports to the Danish FSA.
Market developments for mortgage credit institutions in 2019 259. Annex 2: Mortgage credit institutions, financial ratios 2015–2019
2015 2016 2017 2018 2019
Capital ratio (%) 23.09 23.57 23.46 23.66 22.87
Core capital ratio (%) 21.47 21.75 21.64 21.92 21.09
Actual core capital ratio (%) 20.92 20.72 20.80 21.09 20.31
Return on equity before tax (%) 8.07 9.85 10.18 8.61 9.73
Return on equity after tax (%) 6.36 8.09 8.54 7.22 8.25
Ratio of op. income to op. expenses (DKK) 2.62 3.35 4.08 4.16 4.19
Accumulated write-down rate (%) 0.44 0.43 0.38 0.36 0.34
Write-down percentage for the period (%) 0.08 0.04 0.03 0.04 0.04
Lending in relation to equity (ratio) 14.67 14.21 13.51 13.45 13.41
Total risk exposures (DKK bn) 815 864 909 929 1,003
Note: The table shows selected items. The figures are based on the institutions that existed in the individual years.
Source: Reports to the Danish FSA.
Market developments for mortgage credit institutions in 2019 26You can also read