Interim Report - First Half 2018
←
→
Page content transcription
If your browser does not render page correctly, please read the page content below

Interim Report - First Half 2018

Management’s report
     Financial highlights – Realkredit Danmark Group                                                            3
     Overview, First Half 2018                                                                                  4
     Outlook for 2018                                                                                           7

Interim financial statements – Realkredit Danmark Group
    Income statement and Comprehensive income                                                                  8
    Balance sheet                                                                                              9
    Statement of capital                                                                                      10
    Cash flow statement                                                                                       11
    Notes                                                                                                     12

Interim financial statements – Realkredit Danmark A/S                                                         22

Statement by the management                                                                                   27

Supplementary information                                                                                     28

Interim Report – First Half 2018 is a translation of the original report in the Danish language
(Delårsrapport – 1. halvår 2018). In case of discrepancies, the Danish version prevails.

                                                                                                  Realkredit Danmark – First Half 2018 2/28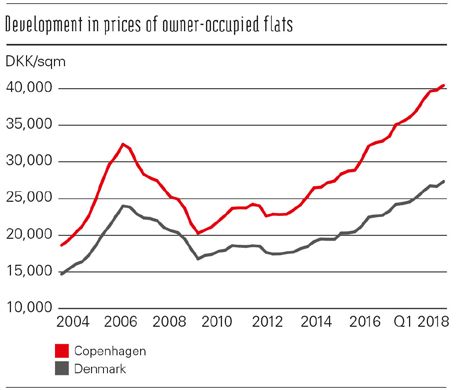
Financial highlights – Realkredit Danmark Group
 NET PROFIT FOR THE PERIOD                    First half   First half   Index        Q2           Q1          Q4          Q3          Q2     Full year
 (DKK millions)                                   2018         2017     18/17      2018         2018        2017        2017        2017         2017

 Administration margin                           3,115        3,075       101      1,556       1,559       1,560       1,551        1,537       6,186
 Net interest income                                73            6     1,217         35          38          35          18           -1          59
 Net fee income                                   -311         -280       111       -151        -160        -158        -163         -148        -601
 Income from investment portfolios                 386          350       110        155         231         184         128          104         662
 Other income                                       67          105        64         33          34          36          39           69         180

 Total income                                    3,330        3,256      102       1,628       1,702       1,657       1,573        1,561       6,486
 Expenses                                          348          362       96         165         183         192         182          185         736

 Profit before loan impairment charges           2,982        2,894      103       1,463       1,519       1,465       1,391        1,376       5,750
 Loan impairment charges                          -191          122        -        -108         -83          54         -29           85         147

 Profit before tax                               3,173        2,772      114       1,571       1,602       1,411       1,420        1,291       5,603
 Tax                                               698          610      114         345         353         313         312          284       1,235

 Net profit for the period                       2,475        2,162      114       1,226       1,249       1,098       1,108        1,007       4,368

 BALANCE SHEET (END OF PERIOD)
 (DKK millions)

 Due from credit
 institutions etc.                               7,116       10,040       71      7,116       24,222      30,072      29,575      10,040       30,072
 Mortgage loans                                794,178      773,959      103    794,178      788,200     788,765     786,207     773,959      788,765
 Bonds and shares                               54,038       63,993       84     54,038       51,008      54,851      52,105      63,993       54,851
 Other assets                                    3,068        3,587       86      3,068        3,966       3,202       2,991       3,587        3,202

 Total assets                                  858,400      851,579      101    858,400      867,396     876,890     870,878     851,579      876,890

 Due to credit institutions etc.                 1,513        9,530       16      1,513        4,083       4,294       9,654       9,530        4,294
 Issued mortgage bonds                         799,313      779,312      103    799,313      804,777     810,050     797,741     779,312      810,050
 Issued senior debt                              5,952       10,722       56      5,952        5,951       6,616       9,896      10,722        6,616
 Other liabilities                               3,877        4,334       89      3,877        6,053       6,039       4,799       4,334        6,039
 Shareholders' equity                           47,745       47,681      100     47,745       46,532      49,891      48,788      47,681       49,891

 Total liabilities and equity                  858,400      851,579      101    858,400      867,396     876,890     870,878     851,579      876,890

 RATIOS AND KEY FIGURES

 Net profit for the period as % p.a.
 of average shareholders' equity                   10.1          8.9                10.4        10.4          8.9         9.2         8.5         8.8
 Impairment charges as % p.a. of
 mortgage lending                                 -0.05         0.03               -0.05       -0.04        0.03        -0.01        0.04        0.02
 Cost/income ratio (%)                             10.5         11.1                10.1        10.8        11.6         11.6        11.9        11.3
 Total capital ratio (%)                           28.9         28.4                28.9        28.6        28.3         28.5        28.4        28.3
 Tier 1 capital ratio (%)                          28.6         27.9                28.6        28.3        28.1         28.2        27.9        28.1
 Full-time-equivalent staff (end of period)        230          235                 230         232         232          233         235         232

Throughout the Management’s report, Realkredit Danmark’s performance is assessed on the basis of the financial highlights and segment reporting,
which represent the financial information regularly provided to management. The financial highlights are alternative performance measures which deviate
from the presentation according to IFRS. See note 2 for an explanation of the differences and a reconciliation between these measures and IFRS.

                                                                                                             Realkredit Danmark – First Half 2018 3/28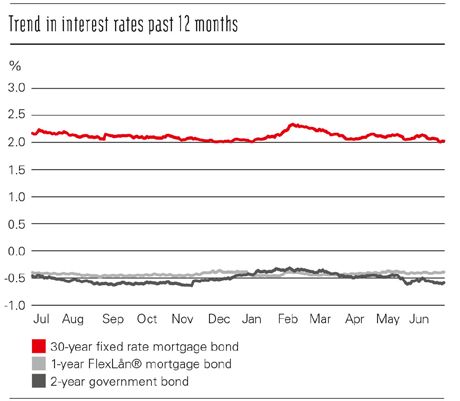
Overview, first half 2018
•   The Realkredit Danmark Group recorded a net profit of DKK 2,475 million in the first half of 2018, against
    DKK 2,162 million in the first half of 2017. The profit for the first half of 2018 was supported by a larger loan
    portfolio.
•   Impairments amounted to an income of DKK 191 million in the first half of 2018, against an expense of DKK 122
    million in the first half of 2017.
•   There is still strong customer demand for the new mortgage loan product FlexLife®. FlexLife® accounted for
    19% of all new loans to personal customers, and in the 60+ age group the figure is 48%.
•   In the first half of 2018, borrower demand centred primarily on fixed-rate loans and FlexLån® loans with refi-
    nancing intervals of five years.
•   Realkredit Danmark complies with all threshold values of the supervisory diamond for mortgage credit institu-
    tions.
•   Realkredit Danmark still expects the profit for 2018 to be at the same level as in 2017.

Homeowners across Denmark have welcomed                          Mortgage credit market
FlexLife®                                                        The Danish economy is a few years into an economic
Danish homeowners have really taken to FlexLife®                 recovery which has continued into 2018 with moderate
and its possibilities for up to 30-year interest-only            GDP growth and rising employment levels. The
periods and, not least, the option of much greater indi-         buoyant trend has positively affected the housing mar-
vidual flexibility compared with other mortgage loan             ket and the market for commercial property.
products. Since they were launched in September
2017, FlexLife® loans have accounted for nearly one              House prices continued their upward trend in the first
in five new loans disbursed to Danish homeowners,                half of 2018, both in terms of the individual housing
and by the end of June Realkredit Danmark had dis-               segments and across Denmark. Prices of single-family
bursed loans for DKK 12 billion.                                 detached houses are expected to rise by roughly 4% in
                                                                 2018. Prices of holiday houses have also trended up-
                                                                 ward, driven, among other factors, by the new lending
Homeowners across Denmark have welcomed the new
                                                                 regulations enacted in May 2017, which allow bor-
loan options, and Realkredit Danmark has disbursed
                                                                 rowers to mortgage a holiday home at up to 75% of its
FlexLife® loans in each of Denmark’s 98 municipali-              value. Prices are expected to continue to trend upward
ties. The largest urban areas of Copenhagen, Aarhus,             in the Danish market for holiday houses in 2018.
Odense and Aalborg together account for a little over
25% of FlexLife® loan disbursements, which is in line            Trading activity in the housing market is slightly lower
with the population distribution.                                than it was in 2017. The slowdown is primarily due to
                                                                 softer activity in the market for owner-occupied flats,
In addition, the fair amounts of home equity among               especially in Copenhagen. The rate of price increases
FlexLife® loan homeowners are reflected in their                 in the Copenhagen market for owner-occupied flats
average loan-to-value ratio of 55%. Nearly eight in ten          has declined in 2018 after strong increases in the pre-
borrowers have a loan-to-value ratio of less than 60%.           ceding years.

One of the principal innovations of FlexLife® is the
possibility of fixing the monthly payment according to
the borrower’s own needs and financial position. Bor-
rowers are thus no longer forced to choose between
interest-only loans and ordinary loans with repayment.
Instead, homeowners of all age groups with home
equity have a unique possibility of adapting their
mortgage loan to their situation and needs and are able
regularly to adjust their loans within agreed limits. For
example, they can choose to make changes when their
interest-only period expires, during periods of large
fluctuations in income or expenses, during periods of
home investment savings or as part of planning their
pension savings.

                                                                                       Realkredit Danmark – First Half 2018 4/28
Following rising rates early in the year, mortgage rates Total income was on a level with the first half of 2017.
again dipped to record-lows in the second quarter,
driven in particular by concerns about an Italian debt Expenses amounted to DKK 348 million in the first
crisis, slightly weaker economic data for the European half of 2018, against DKK 362 million in the first half
economy and persistently low underlying inflationary of 2017.
pressure. The market is now pricing in a first rate hike
by the European Central Bank (ECB) in the second Impairments totalled an income of DKK 191 million
half of 2019 instead of H1 2019. in the first half of 2018, compared with an expense of
DKK 122 million in the same period of 2017. In the
first halves of both 2017 and 2018, net provisions for
bad debts were reversed, primarily on business cus-
tomers. In addition, the new impairment principles of
IFRS 9 have resulted in a transition effect of DKK 400
million in the first half of 2018. This has been ex-
pensed in the IFRS financial statements of the
Realkredit Danmark Group, but recognised as a reduc-
tion of equity at 1 January 2018 in the financial high-
lights to show the actual activity during the half-year
period.
The Danish agricultural sector continues to struggle
with low grain prices. Pork and milk prices started at
lower levels in 2018 than last year, when prices
reached their peak in the current cycle. We expect the
low price level to continue. Unfortunately, the period
of high selling prices was relatively short-lived, and as
the sector remains challenged by the current low price
The favourable economic climate seems to have level and high debts, it has proven necessary to main-
pushed down vacancy rates in the commercial property tain impairment levels.
market.
Impairments equalled -0.05% p.a. of total mortgage
At 1 July 2018, the new Danish act on state guarantee, lending, which was on a level with 2017. The delin-
guarantee commission and payment commission in quency rate at 30 June 2018 was unchanged from the
connection with financing of subsidised housing en- level at end-2017.
tered into force. This means that the Danish State will
fully guarantee loans and the mortgage bonds financ- The tax charge totalled DKK 698 million. The effec-
ing loans in the subsidised housing area. In return for tive tax rate for the period was 22.0%.
the guarantee, the mortgage credit institutions must
pay commission to the State at 0.12% of the loan prin- Balance sheet
cipal. Gross lending amounted to DKK 62 billion, against
DKK 56 billion in the first half of 2017. Mortgage
Results lending at fair value rose DKK 5 billion to DKK 794
For the first half of 2018, Realkredit Danmark‘s net billion in the first half of 2018. The development in
profit was DKK 2,475 million, against DKK 2,162 mortgage lending at fair value is composed of an in-
million in the same period of 2017. The results for the crease in the nominal outstanding bond debt of DKK 7
period are exclusive of a DKK 400 million transition billion and a DKK 2 billion decline in the market val-
effect of IFRS 9 and tax hereof in the amount of ue adjustment in the same period.
DKK 88 million, for a net amount of DKK 312 mil-
lion, which is included in the IFRS financial state- There is still strong customer demand for the new
ments of the Realkredit Danmark Group. mortgage loan product FlexLife®. FlexLife® account-
The profit performance was driven by the reversal of ed for 19% of all new loans to personal customers, and
previous provisions for bad debts as well as lending in the 60+ age group the figure is 48%.
growth and a resulting rise in administration margin
income. Remortgaging activity was at the same level In the first half of 2018, fixed-rate loans accounted for
as in the first half of 2017. approximately 40% of all disbursed loans, while about
75% of all floating-rate loans were disbursed with
The administration margin income rose DKK 40 mil- refinancing intervals of five years.
lion, driven by a larger loan portfolio.
Other income rose DKK 34 million in the first half of
2018.
Realkredit Danmark – First Half 2018 5/28Under Danish law, Realkredit Danmark must publish
its total capital and solvency need on a quarterly basis.
The rd.dk site provides further information.
Supplementary collateral
Realkredit Danmark issues mortgage-covered bonds.
Under Danish law, it must provide supplementary
collateral to the bondholders when the LTV ratio
exceeds predefined limits, which are 80% for residen-
tial property and 60% for commercial property.
At the end of June 2018, the requirement for supple-
mentary collateral for mortgage-covered bonds was
DKK 19.6 billion, against DKK 22.7 billion at end-
2017.
Liquidity Coverage Ratio
The effective requirement for Realkredit Danmark’s
buffer of liquid assets resulting from the Liquidity
Low interest rates have made more customers lock-in Coverage Ratio is 2.5% of total mortgage lending. At
the interest rate on their loan for a longer period. the end of June 2018, this corresponded to approxi-
mately DKK 20 billion. Realkredit Danmark has liquid
At 30 June 2018, the average loan-to-value (LTV) assets of DKK 41 billion after haircuts and thus has a
ratio stood at 61%, which was on a level with the end buffer of DKK 21 billion relative to the requirement.
of 2017. An increase in loans calculated at market
value was offset by rising property prices. Rating
Realkredit Danmark’s mortgage bonds and mortgage-
The number of new foreclosures was 21 in the first covered bonds issued from capital centres S and T and
half of 2018. The number of foreclosures was un- under the Other reserves series continue to hold a
changed from year-end 2017, standing at 27, of which AAA rating from S&P Global.
24 were owner-occupied dwellings and 3 were com-
mercial properties. The value of the foreclosures was Ratings assigned by Fitch Ratings to capital centres S
DKK 26 million. and T are also unchanged at AAA and AA+, respec-
tively.
Capital and solvency
At the end of June 2018, shareholders’ equity stood at Realkredit Danmark holds an issuer rating of A from
DKK 47.7 billion, against DKK 49.9 billion at end- Fitch Ratings.
2017. The ordinary dividend payment of DKK 4.3
billion and the consolidation of the net profit for the Supervisory diamond for mortgage credit institu-
period accounted for the change. tions
Realkredit Danmark complies with all threshold val-
Realkredit Danmark’s total capital amounted to ues.
DKK 45.8 billion, and the total capital ratio calculated
in accordance with the Capital Requirements Regula- Threshold value Q2 2018 Limit
tion and Directive (CRR/CRD IV) was 28.9%. At 31
December 2017, the corresponding figures were Growth in lending1
Owner-occupied dwellings and
DKK 45.9 billion and 28.3%, respectively.
holiday homes 1.0% 15%
Residential rental property 1.6% 15%
Realkredit Danmark uses the internal ratings-based Agriculture -1.4% 15%
(IRB) approach to calculate the risk exposure amount Other 0.7% 15%
for credit risks. The total risk exposure amount (REA)
was DKK 158.5 billion at 30 June 2018, against Borrower interest-rate risk2
DKK 161.9 billion at the end of 2017. Properties for residential purposes 9.0% 25%
Interest-only option3
The binding capital requirement is the solvency need Owner-occupied dwellings and
ratio plus the combined buffer requirement. At 30 June holiday homes 8.2% 10%
2018, the capital requirement was calculated at 4
Loans with short-term funding
DKK 23.1 billion and 14.6% of the REA. Realkredit Refinancing, annually 13.9% 25%
Danmark thus has a capital buffer of DKK 22.7 bil- Refinancing, quarterly 0.3% 12.5%
lion.
Large exposures5
Loans relative to shareholders’ equity 43% 100%
Realkredit Danmark – First Half 2018 6/281
Annual growth must be lower than 15% unless the size of the segment is
smaller than the institution’s total capital.
2
The proportion of loans for which the loan-to-value ratio is at least 75% of
the statutory maximum loan limit and for which the interest rate has been
locked for up to two years must not represent more than 25% of the total loan
portfolio.
3
The proportion of interest-only loans for which the loan-to-value ratio is
more than 75% of the statutory maximum loan limit must represent less than
10% of the total loan portfolio.
4
The proportion of lending to be refinanced must be less than 12.5% per
quarter and less than 25% of the total loan portfolio.
5
The sum of the 20 largest exposures must be less than core equity tier 1
capital.
Management
On 26 April 2018, Lars Mørch, chairman of the Board
of Directors, resigned from the Board of Directors of
Realkredit Danmark. The Board of Directors elected
Jesper Nielsen as chairman and Jacob Aarup-Andersen
as vice chairman. At an extraordinary general meeting
held on 23 May 2018, Jakob Groot, Carsen Rasch
Egeriis and Christian Baltzer (the latter with effect
from 15 October 2018) were elected as members of the
Board of Directors.
Outlook for 2018
Realkredit Danmark expects that low interest rates will
continue to characterise the Danish economy in 2018
with moderately rising growth relative to the past few
years. Low interest rates will continue to support the
upward trend in house prices and general housing
market activity.
Realkredit Danmark expects income to be at the same
level as in 2017, as income will be supported by mod-
erate growth in the average loan portfolio, while a
decline in income from remortgaging activity and
lower returns on the bond portfolios will have down-
ward effect.
Through a persistent focus on cost control in 2018,
Realkredit Danmark aims to curb its expenses.
Loan impairment charges are expected to remain at a
low level in 2018.
Overall, Realkredit Danmark therefore expects net profit
to be at the same level in 2018 as in 2017.
Realkredit Danmark – First Half 2018 7/28Income statement and Comprehensive income –
Realkredit Danmark Group
First half First half Q2 Q2 Full year
Note (DKK millions) 2018 2017 2018 2017 2017
Income statement
Interest income 8,827 9,229 4,403 4,541 18,206
Interest expense 5,410 5,842 2,690 2,828 11,266
Net interest income 3,417 3,387 1,713 1,713 6,940
Dividends from shares - - - - -
Fee and commission income 260 264 116 116 572
Fee and commission expense 571 544 267 264 1,173
Net fee and commission income 3,106 3,107 1,562 1,565 6,339
Value adjustments 157 45 33 -73 -32
Other operating income 67 105 33 69 180
Staff costs and administrative expenses 347 361 165 185 733
Impairment, depreciation and amortisation charges 1 1 - - 3
3 Loan impairment charges 209 122 -108 85 147
Income from associates and group undertakings - -1 - - -1
Profit before tax 2,773 2,772 1,571 1,291 5,603
Tax 610 610 345 284 1,235
Net profit for the period 2,163 2,162 1,226 1,007 4,368
Comprehensive income
Net profit for the period 2,163 2,162 1,226 1,007 4,368
Other comprehensive income
Items that will not be reclassified to profit or loss
Actuarial gains/losses on defined benefit plans -12 -36 -17 -19 -30
Tax 3 8 4 4 6
Total other comprehensive income -9 -28 -13 -15 -24
Total comprehensive income for the period 2,154 2,134 1,213 992 4,344
Realkredit Danmark – First Half 2018 8/28Balance sheet – Realkredit Danmark Group
30 June 31 December 30 June
Note (DKK millions) 2018 2017 2017
ASSETS
Cash in hand and demand deposits with central banks 134 273 3
Due from credit institutions and central banks 6,982 29,799 10,037
Bonds at fair value 22,489 23,626 33,531
Bonds at amortised cost 31,547 31,223 30,460
4 Mortgage loans at fair value 794,178 788,765 773,959
4 Loans and other amounts due at amortised cost 606 627 774
Shares etc. 2 2 2
Holdings in associates - - -
Other tangible assets 7 7 8
Current tax assets 512 13 559
Deferred tax assets - - -
Assets temporarily taken over 26 38 64
4 Other assets 1,877 2,509 2,136
Prepayments 40 8 46
Total assets 858,400 876,890 851,579
LIABILITIES AND EQUITY
AMOUNTS DUE
Due to credit institutions and central banks 1,513 4,294 9,530
Issued mortgage bonds at fair value 799,313 810,050 779,312
5 Issued bonds at amortised cost 5,952 6,616 10,722
Current tax liabilities - - -
Deferred tax liabilities 38 41 51
Other liabilities 3,839 5,998 4,283
Deferred income - - -
Total amounts due 810,655 826,999 803,898
SHAREHOLDERS' EQUITY
Share capital 630 630 630
Other reserves
Reserves in series 43,171 43,171 44,611
Other reserves 3,944 1,790 2,440
Proposed dividends - 4,300 -
Total shareholders' equity 47,745 49,891 47,681
Total liabilities and equity 858,400 876,890 851,579
Realkredit Danmark – First Half 2018 9/28Statement of capital – Realkredit Danmark Group
CHANGES IN SHAREHOLDERS' EQUITY Share Reserves Other Proposed
(DKK millions) capital in series reserves dividends Total
Shareholders' equity at 1 January 2018 630 43,171 1,790 4,300 49,891
Net profit for the period - - 2,163 - 2,163
Other comprehensive income
Actuarial gains/losses on defined benefit plans - - -12 - -12
Tax - - 3 - 3
Total comprehensive income for the period - - 2,154 - 2,154
Dividends paid - - - -4,300 -4,300
Shareholders' equity at 30 June 2018 630 43,171 3,944 - 47,745
Shareholders' equity at 1 January 2017 630 44,611 306 3,800 49,347
Net profit for the period - - 2,162 - 2,162
Other comprehensive income
Actuarial gains/losses on defined benefit plans - - -36 - -36
Tax - - 8 - 8
Total comprehensive income for the period - - 2,134 - 2,134
Dividends paid - - - -3,800 -3,800
Shareholders' equity at 30 June 2017 630 44,611 2,440 - 47,681
At 30 June 2018, the share capital was made up of 6,300,000 shares of DKK 100 each. All shares carry the same rights; there is thus only one class
of shares. The company is wholly-owned by Danske Bank A/S, Copenhagen.
TOTAL CAPITAL AND TOTAL CAPITAL RATIO 30 June 31 December 30 June
(DKK millions) 2018 2017 2017
Shareholders´ equity 45,591 49,891 45,578
Revaluation of domicile property at fair value - - -
Tax effect - - -
Total equity calculated in accordance with the rules of the Danish FSA 45,591 49,891 45,578
Proposed/expected dividends - -4,300 -
Revaluation reserve - - -
Deferred tax assets - - -
Prudent valuation -10 -7 -17
Defined benefit pension fund assets -164 -138 -133
Common equity tier 1 capital 45,417 45,446 45,428
Difference between expected losses and impairment charges - - -
Tier 1 capital 45,417 45,446 45,428
Reserves in series subject to a reimbursement obligation - - -
Revaluation reserve - - -
Difference between expected losses and impairment charges 394 428 854
Total capital 45,811 45,874 46,282
Risk exposure amount 158,547 161,902 162,892
Common equity tier 1 capital ratio (%) 28.6 28.1 27.9
Tier 1 capital ratio (%) 28.6 28.1 27.9
Total capital ratio (%) 28.9 28.3 28.4
At 30 June 2018, the total capital and the total risk exposure amount is calculated in accordance with the Capital Requirements Directive (CRR/CRD
IV).
From 1 January 2017, the profit for the period will not be recognised in the statement of total capital and total capital ratio until in connection with the audit-
ed full-year financial statements. The statement of total capital and total capital ratio will therefore be based on shareholders’ equity at 1 January reduced by
the dividend distributed in March.
The solvency need calculation is described in more detail on rd.dk.
Realkredit Danmark – First Half 2018 10/28Cash flow statement – Realkredit Danmark Group
First half First half Full year
(DKK millions) 2018 2017 2017
Cash flow from operations
Profit before tax 2,773 2,772 5,603
Tax paid -1,109 -1,182 -1,274
Adjustment for non-cash operating items -124 -81 -275
Cash flow from operating capital -20,196 -17,168 319
Total -18,656 -15,659 4,373
Cash flow from investing activities
Acquisition/sale of tangible assets - - -
Total - - -
Cash flow from financing activities
Dividends -4,300 -3,800 -3,800
Total -4,300 -3,800 -3,800
Cash and cash equivalents at 1 January 30,072 29,499 29,499
Change in cash and cash equivalents -22,956 -19,459 573
Cash and cash equivalents, end of period 7,116 10,040 30,072
Cash and cash equivalents, end of period
Cash in hand and demand deposits with central banks 134 3 273
Amounts due from credit institutions and central banks
within 3 months 6,982 10,037 29,799
Total 7,116 10,040 30,072
Realkredit Danmark – First Half 2018 11/28Notes – Realkredit Danmark Group
Note
1 Significant accounting policies
and critical accounting estimates and assessments Stage 2: If the credit risk has increased significantly, the loan
The Group’s interim report for the first half of 2018 has been is transferred to stage 2 and an impairment equal to the life-
prepared in accordance with IAS 34, Interim Financial Re- time expected credit losses is recognised. A significant credit
porting, as adopted by the EU, and additional Danish disclo- risk increase is considered to occur when the following in-
sure requirements for interim reports of issuers of listed crease in the probability of default (PD) is observed:
bonds. • For loans originated below 1% in PD: An increase in the
loan’s 12-month PD of at least 0.5 percentage points since
Implementation of IFRS 9 and IFRS 15 origination and a doubling of the loan’s lifetime PD since
On 1 January 2018, the Group implemented IFRS 9, Finan- origination
cial Instruments, and IFRS 15, Revenue from Contracts with • For loans originated above 1% in PD: An increase in the
Customers. loan’s 12-month PD of 2 percentage points since origina-
tion or a doubling of the loan’s lifetime PD since origina-
Under IFRS 9, financial assets, including loans, are classified tion
on the basis of the business model adopted for managing the • Further, loans that are more than 30 days past due are
assets and on their contractual cash flow characteristics (in- moved from stage 1 to stage 2. Finally, customers subject
cluding embedded derivatives, if any) into one of the follow- to forbearance measures are placed at stage 2, if the Group,
ing measurement categories: in the most likely outcome, expects no loss or the custom-
• Amortised cost if the assets are held exclusively for the ers are in the 2-year probation period for performing for-
purpose of collecting contractual cash flows and if the cash borne exposures.
flows are payments of principal and interest on the princi-
pal amount outstanding solely. Stage 3: If a loan is in default or otherwise credit-impaired,
• Fair value through other comprehensive income if the it is transferred to stage 3, which is the same as stage 2,
assets are held for the purpose of both collecting contractu- except that interest income on loans recognised at amortised
al cash flows and selling and if cash flows are payments of cost must be recognised at the net carrying amount. The
principal and interest on the principal amount outstanding Realkredit Danmark Group has opted to continue to recognise
solely. interest income on mortgage loans measured at fair value on
• Fair value through profit or loss for all other financial the basis of the contractual interest rates.
assets.
The major change from IAS 39 is the calculation of expected
Implementation of the classification principles of IFRS 9 has credit losses (either as 12 months expected credit losses or
not resulted in reclassifications between amortised cost and lifetime expected credit losses depending on whether loans
fair value in the Realkredit Danmark Group, and no financial are at stage 1, 2 or 3) and the inclusion of forward-looking
assets are recognised at fair value through other comprehen- elements.
sive income. Accordingly, there are no changes to the valua-
tion of financial liabilities. As a result, mortgage loans and is- The expected credit loss is calculated for all individual loans
sued mortgage bonds are still recognised at fair value through as a function of the probability of default (PD), the exposure
profit or loss. However, there is a knock-on effect from IFRS at default (EaD) and the loss given default (LGD). In general,
9 on the calculation of the fair value of credit risk on mort- the Group’s IFRS 9 models and parameters draw on the
gage loans (see below). Realkredit Danmark Group’s existing internal models in
order to ensure alignment of models across the Group. New
Also, the fair value of mortgage loans is based on the fair models and calculations have been developed especially for
value of the underlying issued mortgage bonds adjusted for IFRS 9 purposes, including models for lifetime PD, prepay-
changes in the fair value of the credit risk on borrowers. As ment and forward-looking LGD.
previously, such adjustment is made on the basis of the IFRS
impairment principles that apply to loans at amortised cost. The lifetime expected credit losses cover the expected re-
From 1 January 2018, the fair value of this credit risk is thus maining lifetime of the loan. For most loans, the expected
measured on the basis of the expected credit loss approach of lifetime is limited to the remaining contractual maturity and
IFRS 9, including the allocation of the loans between stage 1, adjusted for expected prepayment. For exposures with weak
stage 2 and stage 3. credit quality, the likelihood of prepayment is not included.
Stage 1: If the credit risk has not increased significantly, the
impairment equals the expected credit losses resulting from
default events that are possible within the next 12 months.
Realkredit Danmark – First Half 2018 12/28Notes – Realkredit Danmark Group
Note
1 Significant accounting policies
and significant accounting estimates and assessments
cont´d
The forward-looking elements of the calculation reflect the Significant accounting estimates and assessments
current unbiased expectations of the management. The pro- Management’s estimates and assumptions of future events
cess consists of the creation of macroeconomic scenarios that will significantly affect the carrying amounts of assets
(base case, upside and downside), including an assessment of and liabilities underlie the preparation of the Group’s consol-
the probability for each scenario, by the Danske Bank idated financial statements. The amount most influenced by
Group’s independent macroeconomic research unit in FICC, critical estimates and assessments is the fair value measure-
the review and sign-off of the scenarios (throughout the or- ment of mortgage loans.
ganisation) and a process for adjusting scenarios given new
information during the quarter. Management’s approval of The estimates and assessments are based on assumptions that
scenarios can include adjustments to the scenarios, probabil- management finds reasonable but which are inherently uncer-
ity weighting and management overlays to cover the outlook tain and unpredictable. The premises may be incomplete, un-
for particular high-risk portfolios, which are not provided by expected future events or situations may occur, and other par-
the Group’s macroeconomists. The approved scenarios are ties may arrive at other estimated values.
used to calculate the impairment levels. Technically, the for-
ward-looking information is used directly in the PDs through Fair value measurement of mortgage loans
an estimate of general changes to the PDs and the LGDs in The fair value of mortgage loans is based on the fair value of
the expected credit loss calculation. However, for significant the underlying issued mortgage bonds As described above,
exposures at stage 3, an individual assessment of the scenari- adjustments are made for changes in the fair value of the
os, changes to expected credit losses and the related probabil- credit risk on borrowers using the new impairment model in
ities are performed by senior credit officers. IFRS 9, which is based on expected credit losses.
On top of the calculation of expected credit losses according The expected credit loss is calculated for all individual loans
to the principles of IFRS 9, some adjustments are made to re- as a function of PD, EaD and LGD and includes forward-
flect the measurement basis being fair value and not amor- looking elements. The forward-looking elements reflect man-
tised cost. The recognition of 12 months’ expected credit agement's expectations and involve the creation of scenarios
losses at initial recognition is inconsistent with fair value and (base case, upside and downside), including an assessment of
is therefore not recognised. On the other hand, increases in the probability of each scenario. On the basis of these as-
lifetime credit losses are considered for the purpose of fair sessments, the fair value adjustment of credit risk on mort-
value even if an increase in credit risk is insignificant. gage loans is calculated at DKK 3,008 million at 30 June
2018. The fair value adjustment would increase to
The implementation of the new method for measuring the fair DKK 3,375 million if the downside scenario was weighted at
value of credit risk on mortgage loans has increased the al- 100%. On the other hand, if the upside scenario was weighted
lowance account by DKK 400 million at 1 January 2018. This at 100%, the fair value adjustment would decrease to
increase is recognised as a change of an accounting estimate DKK 2,875 million.
in the IFRS income statement in the first quarter of 2018 and
results in a DKK 312 million reduction of the net profit for The Group's principal risks and external factors that may af-
the period. fect the Group are described in more detail in Annual Report
2017.
The implementation of IFRS 15 has not resulted in any sig-
nificant changes. However, income and expenses are offset
when Realkredit Danmark acts as agent and handles the re-
invoicing of expenses incurred. In the first half of 2018, this
led to a DKK 17 million reduction in Other operating income
and Staff costs and administrative expenses.
Other than this, the Group has not changed its significant
accounting policies from those followed in Annual Report
2017, which provides a full description of the Group’s signif-
icant accounting policies. The interim report has not been re-
viewed or audited.
Realkredit Danmark – First Half 2018 13/28Notes – Realkredit Danmark Group
Note (DKK millions)
2 Profit broken down by activity
Mortgage Own Reclassi-
First half 2018 finance holdings Highlights fication IFRS
Administration margin 3,115 - 3,115 - 3,115
Net interest income -104 177 73 229 302
Dividends from shares - - - - -
Net fee income -311 - -311 - -311
Income from investment portfolios 292 94 386 -386 -
Value adjustments - - - 157 157
Other income 67 - 67 - 67
Total income 3,059 271 3,330 - 3,330
Expenses 345 3 348 - 348
Profit before loan impairment charges 2,714 268 2,982 - 2,982
Loan impairment charges -191 - -191 400 209
Income from associates - - - - -
Profit before tax 2,905 268 3,173 -400 2,773
Tax 698 -88 610
Net profit for the period 2,475 -312 2,163
Total assets 807,315 51,085 858,400 - 858,400
Mortgage Own Reclassi-
First half 2017 finance holdings Highlights fication IFRS
Administration margin 3,075 - 3,075 - 3,075
Net interest income -170 176 6 306 312
Dividends from shares - - - - -
Net fee income -280 - -280 - -280
Income from investment portfolios 273 77 350 -350 -
Value adjustments - - - 45 45
Other income 105 - 105 - 105
Total income 3,003 253 3,256 1 3,257
Expenses 359 3 362 - 362
Profit before loan impairment charges 2,644 250 2,894 1 2,895
Loan impairment charges 122 - 122 - 122
Income from associates - - - -1 -1
Profit before tax 2,522 250 2,772 - 2,772
Total assets 794,931 56,648 851,579 - 851,579
Mortgage finance encompasses property financing services provided in Denmark, Sweden and Norway to personal and business customers. The
mediation of property financing services is made through Danske Bank’s branch network and finance centres and through Corporate & Institu-
tional Mortgage Finance at Realkredit Danmark. The segment also includes mediation of real estate transactions in Denmark offered through the
“home” real-estate agency chain. Own holdings comprise the net return on the part of the securities portfolio not relating to the mortgage finance
business. Under the Danish Financial Business Act, at least 60% of the total capital of a mortgage credit institution must be invested in bonds,
etc.
Realkredit Danmark has no branch offices or subsidiaries outside Denmark.
Realkredit Danmark – First Half 2018 14/28Notes – Realkredit Danmark Group
Note (DKK millions)
2 Profit broken down by activity
cont´d
Fees and other income
Fee income relates to mortgage credit activities and primarily concern income from the establishment and change of loans. These are recognised
at the date of transaction as the loans are measured at fair value through profit or loss. In the business segment reporting and internal manage-
ment, fees are presented as net figures, i.e. fee income and fee expenses are offset. Other income include franchise income, which is recognised
over the term of the franchise agreement.
Alternative performance measures
Financial highlights and reporting for the two business segments correspond to the information incorporated in the Management’s report, which
is regularly sent to management. The presentation in the financial highlights deviates in certain areas from the financial statements prepared un-
der IFRS and therefore represents alternative performance measures. There are generally no adjusting items, which means that net profit is the
same in the financial highlights and in the IFRS financial statements. However, in 2018 there is one adjusting item deriving from the implemen-
tation of IFRS 9. Mortgage loans are recognised at fair value (both under IAS 39 and under IFRS 9). After the implementation of IFRS 9, the
measurement of the fair value of the credit risk will continue to be based on the same approach as that used for impairment of loans recognised
at amortised cost. In the IFRS income statement, the effect of the new impairment principles is recognised as a change of an accounting esti-
mate. To better reflect current earnings in 2018, the effect in the financial highlights and reporting for the two business segments is recognised
as a reduction in shareholders’ equity at 1 January 2018. As a result, the profit for the period is DKK 312 million higher in the financial high-
lights than in the IFRS income statement.
The reclassification column shows the reconciliation between the presentation in the highlights and in the IFRS financial statements. Other than
the above-mentioned adjusting item concerning the fair value of the credit risk on mortgage loans in 2018, the difference between the presenta-
tion in the financial highlights and in the IFRS financial statements is due to the fact that income from trading activities in mortgage credit activ-
ities and income from own holdings, except for interest on bonds at amortised cost, is carried in the consolidated highlights as income from in-
vestment portfolios, while in the income statement according to IFRS it is carried under net interest income, value adjustments, etc.
As the distribution of income between the various income line items in the IFRS income statement can vary considerably from one year to the
next, depending on the underlying transactions and market conditions, the net presentation in the financial highlights is considered to better re-
flect income in those areas.
Realkredit Danmark – First Half 2018 15/28Notes – Realkredit Danmark Group
First half First half
Note (DKK millions) 2018 2017
3 Loan impairment charges
IFRS 9 transitional impact on implementation, 1 January 2018 400 -
ECL on new assets 43 -
ECL on assets derecognised 144 -
Impact of remeasurement -96 -
Impairment charges etc. during the period - 453
Reversals of impairment charges etc. for previous years - 534
Losses incurred 32 233
Received on claims previously written off 26 30
Total 209 122
4 Loans etc.
Of the total fair value adjustment for the credit risk on mortgage loans, impairments were recognised as an expense of DKK 3,008 million at
30 June 2018, against DKK 3,072 million at the beginning of the year.
Of total loan charges for the credit risk on loans and other amounts due at amortised cost, charges were recognised as an expense of DKK 95
million at 30 June 2018, against DKK 155 million at the beginning of the year.
Reconciliation of total impairment charges
Stage 1 Stage 2 Stage 3 Total
Collective and individual impairment charges under IAS 39 3,227
Transition effect (ECL at 1 January), incl. impact on loans 551 412 2,664 400
Transferred to stage 1 during the period 120 -82 -38 -
Transferred to stage 2 during the period -24 126 -102 -
Transferred to stage 3 during the period -19 -23 42 -
ECL on new assets 5 7 31 43
ECL on assets derecognised 16 29 99 144
Impact of remeasurement -39 4 -61 -96
Write-offs, allowance account 5 4 318 327
Impairment charges at 30 June 2018 573 411 2,119 3,103
Loans, Loans,
individual collective
impairment impairment Total
Impairment charges at 1 January 2017 2,690 815 3,505
Impairment charges during the period 602 143 745
Reversals of impairment charges for previous periods 934 89 1,023
Impairment charges at 31 December 2017 2,358 869 3,227
Value adjustments of assets taken over amounted to DKK 5 million at 30 June 2018, against DKK -2 million at end-2017.
Realkredit Danmark – First Half 2018 16/28Notes – Realkredit Danmark Group
Note (DKK millions)
5 Issued bonds at amortised cost
30 June 31 December
2018 2017
Nominal value of issued bonds 5,952 6,617
Premium/discount - -1
Total issued bonds 5,952 6,616
1 January 30 June
Nominal value 2018 Issued Redeemed 2018
Total issued bonds 6,617 - 665 5,952
Issued bonds at amortised cost consist of issued senior debt.
6 Assets deposited as collateral
At 30 June 2018, Realkredit Danmark had deposited securities worth DKK 9,904 million (end-2017: DKK 13,271 million) as collateral with the
Danish central bank.
In connection with repo transactions, which involve selling securities to be repurchased at a later date, the securities remain on the balance sheet,
and amounts received are recognised as due to credit institutions and central banks. Repo transaction securities are treated as assets provided as
collateral for liabilities. At 30 June 2018, the carrying amount of such securities totalled DKK 2,027 million (end-2017: DKK 4,289 million).
Counterparties are entitled to sell the securities or deposit them as collateral for other loans.
At 30 June 2018, mortgage lending totalling DKK 794,178 million and other assets totalling DKK 19,588 million were registered as security for
issued mortgage bonds, including mortgage-covered bonds, and issued bonds at amortised cost (end-2017: DKK 788,765 million and
DKK 22,665 million).
Realkredit Danmark – First Half 2018 17/28Notes – Realkredit Danmark Group
Note (DKK millions)
7 Financial instruments at fair value
Quoted Observable Non-observable
30 June 2018 prices input input Total
Bonds at fair value 15,515 6,974 - 22,489
Mortgage loans at fair value - 794,178 - 794,178
Shares - - 2 2
Derivatives - 19 - 19
Total 15,515 801,171 2 816,688
Issued mortgage bonds at fair value 799,313 - - 799,313
Derivatives - 7 - 7
Total 799,313 7 - 799,320
31 December 2017
Bonds at fair value 17,327 6,299 - 23,626
Mortgage loans at fair value - 788,765 - 788,765
Shares - - 2 2
Derivatives - 64 - 64
Total 17,327 795,128 2 812,457
Issued mortgage bonds at fair value 810,050 - - 810,050
Derivatives - 10 - 10
Total 810,050 10 - 810,060
Negative interest income and interest expenses due to negative interest rates were insignificant during the first six months of 2018. The amounts
are offset against interest income and interest expenses, respectively.
Note 35 to Annual Report 2017 provides a description of the valuation techniques used for financial instruments. Financial market developments
did not result in reclassification of bonds between listed prices and observable input during the first six months of 2018.
Realkredit Danmark – First Half 2018 18/28Notes – Realkredit Danmark Group
Note (DKK millions)
8 Contingent liabilities
Owing to its size and business volume, Realkredit Danmark Group is continually a party to various disputes. The Group does not expect the out-
comes of the disputes pending to have any material effect on its financial position.
As the sponsoring employer, Realkredit Danmark is liable for the pension obligations of Kreditforeningen Danmarks Pensionsafviklingskasse.
The pension fund and the Group's defined benefit plan have not accepted new members since 1971.
In connection with implementation of the EU Bank Recovery and Resolution Directive, a Danish resolution fund has been established. The reso-
lution fund must amount to 1% of the covered deposits of all Danish credit institutions by 31 December 2024. The first contribution to the fund
was made at 31 December 2015. The individual institution must make contributions to the fund on the basis of its size and risk relative to other
credit institutions in Denmark. The intention is that losses should be covered by the annual contributions made by the participating credit institu-
tions. If sufficient means are not available in the resolution fund, extraordinary contributions can be required of up to three times the latest annu-
al contribution. Realkredit Danmark pays an annual contribution to the resolution fund.
The company is registered jointly with all major Danish subsidiaries of the Danske Bank Group for financial services employer tax and VAT, for
which it is jointly and severally liable.
The company is jointly taxed with all Danish companies in the Danske Bank Group and are jointly and severally liable for their Danish income
tax, withholding tax, etc.
Realkredit Danmark operates out of leased premises. Leases are concluded by the parent company. Realkredit Danmark pays monthly rent to the
parent company.
Guarantees and indemnities issued by the Group, irrevocable loan commitments regarding reverse mortgages and other commitments not recog-
nised in the balance sheet amount to:
30 June 31 December 30 June
(DKK millions) 2018 2017 2017
Other contingent liabilities
Irrevocable loan commitments regarding reverse mortgages 2 6 6
Other commitments 33 46 89
Total 35 52 95
In addition to credit exposure from lending activities, loan offers made by the Group amounted to DKK 39,181 million (end-2017: DKK 37,470
million). These items are included in the calculation of the total risk amount in accordance with the CRR/CRD IV.
Realkredit Danmark – First Half 2018 19/28Notes – Realkredit Danmark Group
Note
9 Risk management
The Board of Directors defines Realkredit Danmark’s risk management framework, while the Executive Board monitors Realkredit Danmark’s
risks and ensures compliance with the framework. The principal risk faced by Realkredit Danmark is the credit risk on mortgage loans.
Realkredit Danmark has only limited exposure to market risk.
Credit risk
As a mortgage credit institution, Realkredit Danmark provides loans secured on real property. The credit risk on a mortgage loan basically de-
rives from two factors; the risk that the borrower is unable to repay the loan and the expected loss if the customer does not repay the loan. The
latter depends largely on the value of the mortgaged property. The table below shows a breakdown of the loan portfolio on customer classifica-
tion by creditworthiness (rating categories) and loan-to-value (LTV) ratios. Loans to customers with an LTV ratio of more than 80% in the four
lowest rating categories total DKK 3 billion, which corresponds to 0.4% of the total loan portfolio.
Portfolio broken down by LTV ratio and rating category Portfolio broken down by LTV ratio value and rating category
30 June 2018 31 December 2017
LTV ratio Total LTV ratio Total
Rating 0- 20- 40- 60- >80% DKK Rating 0- 20- 40- 60- >80% DKK
category 20% 40% 60% 80% billions category 20% 40% 60% 80% billions
1 - - - - - - 1 - - - - - -
2 8 5 2 - - 15 2 7 5 2 1 - 15
3 76 51 28 11 7 173 3 70 47 27 11 6 161
4 91 69 41 15 5 221 4 85 66 39 15 6 211
5 65 57 37 14 3 176 5 64 56 39 15 3 177
6 38 32 24 9 2 105 6 39 33 23 10 2 107
7 24 21 15 6 1 67 7 25 23 17 7 2 74
8 7 7 5 2 1 22 8 8 7 6 3 1 25
9 1 1 1 - - 3 9 1 1 1 1 - 4
10 3 3 2 1 1 10 10 3 3 2 2 1 11
11 1 1 1 1 1 5 11 2 2 1 1 1 7
Total 314 247 156 59 21 797 Total 304 243 157 66 22 792
In the financial statements, mortgage loans, and thus the associated credit risk, are recognised at fair value. Calculating the fair value of credit
risk involves significant estimates and assumptions. This is described in detail in note 1. The total fair value adjustment of credit risk is de-
scribed in note 4.
Realkredit Danmark – First Half 2018 20/28Notes – Realkredit Danmark Group
Note
9 Risk management
Cont´d
In the table below, mortgage loans and the fair value of credit risk is broken down by 11 rating categories and stages 1, 2 and 3 of IFRS 9 (DKK
billions):
PD level Gross Exposure Expected Credit Loss Net Exposure
Rating
category Lower Upper Stage 1 Stage 2 Stage 3 Stage 1 Stage 2 Stage 3 Stage 1 Stage 2 Stage 3
1 0.00 0.01 1 - - - - - 1 - -
2 0.01 0.03 16 - - - - - 16 - -
3 0.03 0.06 177 1 - - - - 177 1 -
4 0.06 0.14 223 1 - - - - 223 1 -
5 0.14 0.31 171 2 1 - - - 171 2 1
6 0.31 0.63 96 3 - - - - 96 3 -
7 0.63 1.90 55 9 1 - - - 55 9 1
8 1.90 7.98 13 7 1 1 - - 12 7 1
9 7.98 25.70 1 2 - - - - 1 2 -
10 25.70 100.00 - - 10 - - 1 - - 9
11 100.00 100.00 - - 6 - - 1 - - 5
Total 753 25 19 1 - 2 752 25 17
Market risk
Market risk comprises interest rate, equity market and exchange rate risks and, to a very limited extent, liquidity risk and operational risk. In ad-
dition, the Group is exposed to some degree to pension risk on defined benefit plans for current and/or former employees.
However, the statutory principle of balance eliminates most of the interest rate, exchange rate and liquidity risks on Realkredit Danmark’s loans.
Realkredit Danmark’s other assets and liabilities involve some degree of market risk, mainly in the form of interest rate risk. Realkredit Danmark
uses derivatives to hedge the interest rate risk on some of the bonds in the proprietary portfolio and on fixed-rate liabilities in the form of issued
senior debt. The derivatives and the hedged bonds are recognised at fair value, and fair value hedge accounting is used to the effect that the
hedged interest rate risk on the issued senior debt is also recognised at fair value in the financial statements. Realkredit Danmark has placed
DKK 31,547 million of its proprietary portfolio in fixed-rate bonds, which are recognised in the financial statements as held-to-maturity invest-
ments and are thus measured at amortised cost. As a result, Realkredit Danmark knows the return on the portfolio until maturity, and the fixed-
rate held-to-maturity portfolio is therefore not considered to entail an interest rate risk that needs to be hedged through derivatives.
The Group's management of credit risk and market risk is described in detail in the risk management note in Annual Report 2017.
Realkredit Danmark – First Half 2018 21/28Interim financial statements – Realkredit Danmark A/S
Note (DKK millions)
The financial statements of the parent company, Realkredit Danmark A/S, have been prepared in accordance with the Danish Financial Business Act and
the Danish FSA’s Executive Order no. 281 dated 26 March 2014 on Financial Reports of Credit Institutions and Investment Companies, etc. as amended
by Executive Order no. 707 of 1 June 2016 and Executive Order no. 1043 of 5 September 2017.
The rules are consistent with the Group’s measurement principles under IFRS with the exception that
• Domicile properties are valued at estimated fair value (revalued amount) through Other comprehensive income
The estimated fair value of domicile properties is determined in accordance with the Danish FSA’s Executive Order on Financial Reports of Credit
Institutions and Investment Companies, etc. Available-for-sale financial assets are measured at fair value through profit or loss.
The format of the parent company’s financial statements is not identical to the format of the consolidated financial statements prepared in accordance
with IFRSs.
The table below shows the differences in net profit and shareholders’ equity between the IFRS consolidated financial statements and the parent compa-
ny’s financial statements presented in accordance with Danish FSA rules.
Shareholders' Shareholders'
Net profit Net profit equity equity
First half First half 30 June 31 December
(DKK millions) 2018 2017 2018 2017
Consolidated financial statements (IFRS) 2,163 2,162 47,745 49,891
Domicile property - -39 - -
Tax effect - 8 - -
Consolidated financial statements (Danish FSA rules) 2,163 2,131 47,745 49,891
Realkredit Danmark – First Half 2018 22/28Income statement and Comprehensive income –
Realkredit Danmark A/S
First half First half
Note (DKK millions) 2018 2017
Income statement
Interest income 8,827 9,229
Interest expense 5,410 5,842
Net interest income 3,417 3,387
Dividends from shares - -
Fee and commission income 260 264
Fee and commission expense 571 544
Net fee and commission income 3,106 3,107
1 Value adjustments 157 45
Other operating income 6 -
Staff costs and administrative expenses 310 318
Impairment, depreciation and amortisation charges - -
Loan impairment charges 209 122
Income from associated and group undertakings 18 16
Profit before tax 2,768 2,728
Tax 605 597
Net profit for the period 2,163 2,131
Comprehensive income
Net profit for the period 2,163 2,131
Other comprehensive income
Items that will not be reclassified to profit or loss
Actuarial gains/losses on defined benefit plans -12 -36
Fair value adjustment of domicile property - -
Tax 3 8
Total comprehensive income -9 -28
Total comprehensive income for the period 2,154 2,103
Realkredit Danmark – First Half 2018 23/28Balance sheet – Realkredit Danmark A/S
30 June 31 December 30 June
Note (DKK millions) 2018 2017 2017
ASSETS
Cash in hand and demand deposits with central banks 134 273 3
Due from credit institutions and central banks 6,933 29,717 9,984
Bonds at fair value 22,489 23,626 33,531
Bonds at amortised cost 31,547 31,223 30,460
2 Mortgage loans at fair value 794,178 788,765 773,959
2 Loans and other amounts due at amortised cost 577 598 742
Holdings in associates - - -
Holdings in group undertakings 117 139 121
Other tangible assets 5 5 5
Current tax assets 511 16 557
Deferred tax assets - - -
Assets temporarily taken over 26 38 64
2 Other assets 1,828 2,468 2,091
Prepayments 39 6 44
Total assets 858,384 876,874 851,561
LIABILITIES AND EQUITY
AMOUNTS DUE
Due to credit institutions and central banks 1,513 4,294 9,530
Issued mortgage bonds at fair value 799,313 810,050 779,312
Issued bonds at amortised cost 5,952 6,616 10,722
Current tax liabilities - - -
Other liabilities 3,792 5,951 4,230
Deferred income - - -
Total amounts due 810,570 826,911 803,794
PROVISIONS
Deferred tax 41 43 53
Reserves in early series subject to a reimbursement obligation 28 29 33
Total provisions 69 72 86
SHAREHOLDERS' EQUITY
Share capital 630 630 630
Revaluation reserve - - -
Reserves in series 43,171 43,171 44,611
Other reserves 3,944 1,790 2,440
Proposed dividends - 4,300 -
Total shareholders' equity 47,745 49,891 47,681
Total liabilities and equity 858,384 876,874 851,561
Realkredit Danmark – First Half 2018 24/28Statement of capital – Realkredit Danmark A/S
CHANGES IN SHAREHOLDERS' EQUITY Share Revaluation Reserves Other Proposed
(DKK millions) capital reserve in series reserves dividends Total
Shareholders' equity at 1 January 2018 630 - 43,171 1,790 4,300 49,891
Net profit for the period - - - 2,163 - 2,163
Other comprehensive income
Actuarial gains/losses on defined benefit plans - - - -12 - -12
Realised fair value adjustment of domicile property - - - - - -
Tax - - - 3 - 3
Total comprehensive income for the period - - - 2,154 - 2,154
Dividends paid - - - - -4,300 -4,300
Shareholders' equity at 30 June 2018 630 - 43,171 3,944 - 47,745
Shareholders' equity at 1 January 2017 630 31 44,611 306 3,800 49,378
Net profit for the period - - - 2,131 - 2,131
Other comprehensive income
Actuarial gains/losses on defined benefit plans - - - -36 - -36
Realised fair value adjustment of domicile property - -39 - 39 - -
Tax - 8 - - - 8
Total comprehensive income for the period - -31 - 2,134 - 2,103
Dividends paid - - - - -3,800 -3,800
Shareholders' equity at 30 June 2017 630 - 44,611 2,440 - 47,681
At 30 June 2018, the share capital was made up of 6,300,000 shares of DKK 100 each. All shares carry the same rights; there is thus only one class
of shares. The company is wholly-owned by Danske Bank A/S, Copenhagen. Realkredit Danmark A/S and group undertakings are included in the
consolidated financial statements of Danske Bank A/S, Copenhagen.
The revaluation reserves relate to fair value adjustment of domicile property.
Realkredit Danmark – First Half 2018 25/28Notes - Realkredit Danmark A/S
First half First half
Note (DKK millions) 2018 2017
1 Value adjustments
Mortgage loans -1,618 2,842
Bonds -103 -189
Currency - -
Derivatives -1,179 -1,655
Other assets 6 6
Issued mortgage bonds 3,052 -982
Other liabilities -1 23
Total 157 45
2 Loans etc.
Of the total fair value adjustment for the credit risk on mortgage loans, impairments were recognised as an expense of DKK 3,008 million at
30 June 2018, against DKK 3,072 million at the beginning of the year.
Of total loan charges for the credit risk on loans and other amounts due at amortised cost, charges were recognised as an expense of DKK 92
million at 30 June 2018, against DKK 151 million at the beginning of the year.
Reconciliation of total impairment charges
Mortgage loans Other loans Loan commitments
Stage 1 Stage 2 Stage 3 Stage 1 Stage 2 Stage 3 Stage 1 Stage 2 Stage 3 Total
Collective and individual
impairment charges under IAS
39 3,223
Transition effect (ECL at 1
January), incl. impact on loans 531 400 2,585 15 11 71 2 1 7 400
Transferred to stage 1 during
the period 117 -80 -37 3 -2 -1 - - - -
Transferred to stage 2 during
the period -24 123 -99 - 3 -3 - - - -
Transferred to stage 3 during
the period -18 -23 41 -1 - 1 - - - -
ECL on new assets 5 7 30 - - 1 - - - 43
ECL on assets derecognised 16 28 96 - 1 3 - - - 144
Impact of remeasurement -38 4 -59 -1 - -2 - - - -96
Write-offs, allowance account 5 4 308 - - 9 - - - 326
Impairment charges at 30 June
2018 552 399 2,057 16 11 55 2 1 7 3,100
Other loans comprise the balance sheet items “Due from credit institutions and central banks”, “Loans and other amounts due at amortised cost”
and “Other assets”. These loans are valued at amortised cost.
Loans, Loans,
individual collective
impairment impairment Total
Impairment charges at 1 January 2017 2,685 815 3,500
Impairment charges during the period 602 143 745
Reversals of impairment charges for previous periods 933 89 1,022
Impairment charges at 31 December 2017 2,354 869 3,223
Value adjustment of assets taken over amounted to DKK 5 million at 30 June 2018, against DKK -2 million at end-2017.
Realkredit Danmark – First Half 2018 26/28You can also read