Supply, Demand & Elasticity - Economics Higher Level Rónán Murdock - Dublin Academy Of Education
←
→
Page content transcription
If your browser does not render page correctly, please read the page content below

th
                                  5 Year
                                 Economics
                                Higher Level
                               Rónán Murdock

         Supply, Demand & Elasticity

No part of this publication may be copied, reproduced or transmitted in any form or by any means,
electronic, mechanical, photocopying, recording, or otherwise, without prior written permission from The
Dublin School of Grinds.

Ref: 5/eco/h/rm/supply, demand & elasticity
EASTER
REVISION
COURSES                                                      EASTER REVISION COURSE FEES:

                                                             1st Course
                                                                                   PRICE
                                                                                   €295
                                                                                                   TOTAL
                                                                                                    €295
                                                                                                                  SAVINGS
                                                                                                                       -

Looking to maximise                                          2nd Course            FREE             €295            €295
                                                             3rd Course            €100             €395            €490
your CAO points?                                             4th Course            €100             €495            €685
                                                             5th Course            €100             €595            €880
Easter is well known as a time for students to vastly
improve on the points that they received in their mock       6th Course            €100             €695            €1,075
exams. To help students take advantage of this valuable      7th Course            €100             €795            €1,270
time, The Dublin School of Grinds is running intensive       8th Course            €100             €895            €1,465
exam-focused Easter Revision Courses. Each course
runs for five days (90 minutes per day).                     9th Course            €100             €995           €1,660

The focus of these courses is to maximise students’ CAO       NOTE: Any bookings for Junior Cert courses will also
points. Special offer: Buy 1st course and get 2nd course      receive a weekly grind in one subject for the rest of the
free. To avail of this offer, early booking is required as    academic year, free of charge. This offer applies to 3rd
courses were fully booked last year.                          and 2nd year students ONLY.

What do students get at                                            FREE DAILY BUS SERVICE
these courses?                                                For full information on our Easter bus service, see 3 pages ahead.

  99 90 minutes of intensive tuition per day for five
     days, with Ireland’s leading teachers.                  Oral Preparation Courses
  99 Comprehensive study notes.                              Separate to the Easter Revision Courses, The Dublin
  99 A focus on simple shortcuts to raise students’          School of Grinds is also running Oral Preparation
     grades and exploit the critically important             Courses. With the Oral marking component of the
     marking scheme.                                         Leaving Certificate worth up to 40%, it is of paramount
                                                             importance that students are fully prepared for these
  99 Access to a free supervised study room.                 examinations. These courses will show students how
  99 Access to food and beverage facilities.                 to lead the Examiner towards topics that the student
                                                             is prepared in. This will provide students with the
                                                             confidence they need to perform at their peak.
 NOTE: These courses are built on the fact that there
 are certain predicable trends that appear and reoccur
 over and over again in the State Examinations.              ORAL PREPARATION COURSE FEES:
                                                                                     PRICE          TOTAL          SAVINGS
   To book, call us on 01-442 4442 or book                   1st Oral Course          €140          €140                -
    online at www.dublinschoolofgrinds.ie                    2nd Oral Course          €100          €240              €40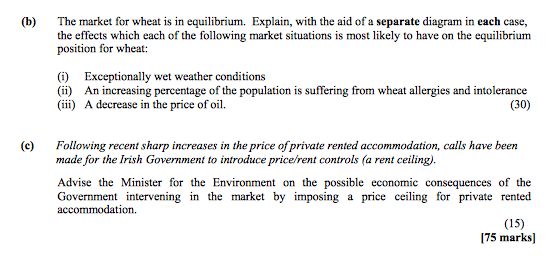
Timetable
An extensive range of course options are available over a two-week period to cater for students’
timetable needs. Courses are held over the following weeks:
   »» Monday 21st March – Friday 25th March 2016
   »» Monday 28th March – Friday 1st April 2016
All Easter Revision Courses take place in The Talbot Hotel, Stillorgan (formerly known as The Stillorgan
Park Hotel).

6th Year Easter Revision Courses                                                       6th Year Oral Preparation Courses
SUBJECT                LEVEL                DATES                     TIME             SUBJECT            LEVEL             DATES                       TIME
Accounting              H   Monday 21st March – Friday 25th March 8:00am - 9:30am      French              H            Sunday 20th March           10:00am - 2:00pm
Agricultural Science    H   Monday 28th March – Friday 1st April   2:00pm - 3:30pm     German              H           Saturday 26th March          10:00am - 2:00pm
Applied Maths           H   Monday 28th March – Friday 1st April   8:00am - 9:30am     Irish               H           Saturday 26th March          10:00am - 2:00pm
Art History             H   Monday 28th March – Friday 1 April     8:00am - 9:30am     Spanish             H           Saturday 19th March          1:00pm - 5:00pm
Biology Course A*       H   Monday 21st March – Friday 25th March 8:00am - 9:30am
Biology Course A*       H   Monday 21st March – Friday 25th March 12:00pm - 1:30pm
                                                                                       5th Year Easter Revision Courses
                                                                                       SUBJECT            LEVEL             DATES                        TIME
Biology Course A*       H   Monday 28th March – Friday 1st April   10:00am - 11:30am
                                                                                       Maths               H Monday 28th March – Friday 1st April   8:00am - 9:30am
Biology Course B*       H   Monday 21st March – Friday 25th March 10:00am - 11:30am
                                                                                       English             H Monday 28th March – Friday 1st April   4:00pm - 5:30pm
Biology Course B*       H   Monday 21st March – Friday 25th March 2:00pm - 3:30pm
Biology Course B*       H   Monday 28 March – Friday 1 April
                                       th                st
                                                                   8:00am - 9:30am     Note: 5th year students are welcome to attend any 6th year
Business                H   Monday 21st March – Friday 25th March 12:00pm - 1:30pm     course as part of our buy 1 get 1 free offer.
Business                H   Monday 28th March – Friday 1st April   8:00am - 9:30am     3rd Year Easter Revision Courses
Chemistry Course A*     H   Monday 28th March – Friday 1st April   12:00pm - 1:30pm    SUBJECT            LEVEL             DATES                       TIME
Chemistry Course B* H       Monday 28th March – Friday 1st April   2:00pm - 3:30pm     Business Studies    H Monday 28th March – Friday 1st April   8:00am - 9:30am
Classical Studies       H   Monday 21st March – Friday 25th March 8:00am - 9:30am      English             H Monday 21st March – Friday 25th March 8:00am - 9:30am
Economics               H   Monday 21st March – Friday 25th March 8:00am - 9:30am      English             H Monday 28th March – Friday 1st April   2:00pm - 3:30pm
Economics               H   Monday 28th March – Friday 1st April   10:00am - 11:30am   French              H Monday 28th March – Friday 1st April   12:00pm - 1:30pm
English Paper 1*        H   Monday 21st March – Friday 25th March 12:00pm - 1:30pm     Geography           H Monday 28th March – Friday 1st April   12:00pm - 1:30pm
English Paper 2*        H   Monday 21st March – Friday 25th March 10:00am - 11:30am    German              H Monday 21st March – Friday 25th March 8:00am - 9:30am
English Paper 2*        H   Monday 21st March – Friday 25th March 2:00pm - 3:30pm      History             H Monday 21st March – Friday 25th March 4:00pm - 5:30pm
English Paper 2*        H   Monday 28th March – Friday 1st April   10:00am - 11:30am   Irish               H Monday 28th March – Friday 1st April   2:00pm - 3:30pm
English Paper 2*        H   Monday 28th March – Friday 1st April   12:00pm - 1:30pm    Maths               H Monday 21st March – Friday 25th March 10:00am - 11:30am
French                  H   Monday 21st March – Friday 25th March 10:00am - 11:30am    Maths               H Monday 21st March – Friday 25th March 12:00pm - 1:30pm
French                  H   Monday 28th March – Friday 1st April   8:00am - 9:30am     Maths               H Monday 28th March – Friday 1st April   10:00am - 11:30am
Geography               H   Monday 28th March – Friday 1st April   8:00am - 9:30am     Maths               O Monday 28th March – Friday 1st April   12:00pm - 1:30pm
Geography               H   Monday 28th March – Friday 1st April   10:00am - 11:30am   Science             H Monday 28th March – Friday 1st April   2:00pm - 3:30pm
German                  H   Monday 21st March – Friday 25th March 10:00am - 11:30am    Science             H Monday 21st March – Friday 25th March 2:00pm - 3:30pm
History (Europe)*       H   Monday 21st March – Friday 25th March 2:00pm - 3:30pm      Spanish             H Monday 21st March – Friday 25th March 12:00pm - 1:30pm
History (Ireland)*      H   Monday 21st March – Friday 25th March 12:00pm - 1:30pm
Home Economics          H   Monday 21st March – Friday 25th March 10:00am - 11:30am    2nd Year Easter Revision Courses
Irish                   H   Monday 21 March – Friday 25 March 10:00am - 11:30am
                                       st                 th                           SUBJECT            LEVEL             DATES                       TIME

Irish                   H   Monday 28 March – Friday 1 April
                                       th                st
                                                                   12:00pm - 1:30pm    Maths               H Monday 21st March – Friday 25th March 2:00pm - 3:30pm

Maths Paper 1*          H   Monday 21st March – Friday 25th March 8:00am - 9:30am

                                                                                               BUY 1ST COURSE
Maths Paper 1*          H   Monday 21st March – Friday 25th March 12:00pm - 1:30pm
Maths Paper 1*          H   Monday 28th March – Friday 1st April   10:00am - 11:30am
Maths Paper 1*          H   Monday 28th March – Friday 1st April   2:00pm - 3:30pm
Maths Paper 2*          H   Monday 21st March – Friday 25th March 10:00am - 11:30am
                                                                                               GET 2ND COURSE

                                                                                               FREE!
Maths Paper 2*          H   Monday 21st March – Friday 25th March 2:00pm - 3:30pm
Maths Paper 2*          H   Monday 28th March – Friday 1st April   12:00pm - 1:30pm
Maths Paper 2*          H   Monday 28th March – Friday 1st April   4:00pm - 5:30pm
Maths                   O   Monday 21st March – Friday 25th March 8:00am - 9:30am
Maths                   O   Monday 28th March – Friday 1st April   12:00pm - 1:30pm
Physics                 H   Monday 28 March – Friday 1 April
                                       th                st
                                                                   10:00am - 11:30am
Spanish                 H   Monday 21st March – Friday 25th March 2:00pm - 3:30pm
Spanish                 H   Monday 28th March – Friday 1st April   10:00am - 11:30am      NOTE: Any bookings for Junior Cert courses will also
                                                                                          receive a weekly grind in one subject for the rest of
* divided
  Due to large course content, these subjects have been
          into two courses. For a full list of topics covered in
                                                                                          the academic year, free of charge. This offer applies
                                                                                          to 3rd and 2nd year students ONLY.
   these courses, please see 3 pages ahead.

                         BOOK EARLY TO AVAIL OF THE SPECIAL OFFER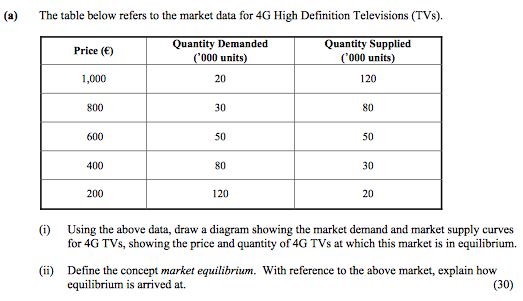
Supply, demand and elasticity has always appeared as at least one full long question in the
leaving cert. (18.75%). This chart below outlines the marks allocated on each section.

Topic                15 14 13 12 11 10 09 08 07 06 05 04 03 02 01 00 99
Supply & Demand      75 75 75 25 75 45 30 60 75 15 75    75    75 75 75
Elasticity              75    50    30 45 15    60    75 75 75 75    75

Checklist for mastering this topic

      1.   Definitions learnt off
      2.   Bullet points covered on past questions
      3.   Marking scheme for graphs covered
      4.   Aware of the common trick questions (especially with elasticity)

The four areas above are essential to achieving a high grade in this section.

                             Topic                      Page
        The Consumer                                     2
        Demand                                           7
        Supply                                           11
        Supply & Demand – Long Questions                 14
        Supply & Demand – Short Questions                38
        Elasticity                                       44
        Elasticity Long and Short Questions              53

 © Dublin School of Grinds                    Page 1                            Rónán Murdock
The Consumer
The individual who makes the decision to buy goods or services for their own personal use.
SLIDER
Assumptions about Consumer Behaviour
1. The consumer aims to gets maximum Satisfaction from that income
A consumer will spend their limited income in such a way that they will achieve
S the most satisfaction from their money.
He will obey the Equi-Marginal Principal of Consumer Behaviour.
2. The consumer has a Limited Income
LI
The consumer’s income is not large enough to satisfy their needs and wants,
therefore the consumer must choose between those goods he wishes to buy.
3. The consumer is subject to the law of Diminishing marginal utility
D
As a consumer consumes additional units of a good their marginal utility for this
good will eventually decline.
E 4. Economic goods
The consumer will only spend his/her income on economic goods.
5. The consumer acts Rationally
R The consumer acts in that manner consistent with his preferences. If the person
sees an identical commodity priced differently in two adjoining shops they will
buy it at the lower price.
Economic Goods
Is a product or service which commands a price, derives utility and is transferable.
Characteristics of Economic Goods à PUT – PUT – PUT - PUT
1. It must command a Price
Its supply must be scarce in relation to the demand for it. If not people will not be
prepared to pay a price to obtain it.
2. It must provide you with Utility
The good must give you a feeling of satisfaction. Anything which is a nuisance does
not and so is not an economic good.
3. It must be Transferable
For an item to be considered an economic good it must be capable of being transferred
from one person to another
© Dublin School of Grinds Page 2 Rónán MurdockExamples of Goods which are not Economic Goods
1) Fresh Air
They are plentiful in supply/not scarce – commands no price
2) Weeds
They do not provide you with utility – you are not prepared to pay
3) Beauty/Good Health
They are not capable of being sold.
Utility
Utility à Is the amount of satisfaction derived from the consumption of a good.
Marginal Utility à Is the change in satisfaction resulting from consuming an extra unit of
a good.
The Law of Diminishing Marginal Utility
This law states that as a consumer consumes additional units of a good the marginal utility/
extra satisfaction derived from each additional unit consumed will eventually decline.
TOOM
Assumptions under the Law of Diminishing Marginal Utility
1. Time lapse
Time Lapse between consumption of successive units. Sufficient time has not
elapsed between the consumption of successive units.
If a person eats an orange on Monday, one on Thursday and one on Sunday,
because of the time which has elapsed between the consumption of each extra
orange marginal utility may not diminish.
2. Applies after a certain point called the Origin.
The origin is the minimum quantity of the commodity which can be used effectively
and until this stage has been reached, marginal utility may not diminish.
3. ‘Other factors’ affecting utility do not change.
The law is based on the assumption that other factors which may affect a
consumer’s utility do not change including income levels, the nature of successive
units of the commodity; and the consumer’s taste for the commodity.
4. Addictive Goods & Medicine
It does not apply to Addictive goods. The consumer may gain increasing marginal
utility by consuming each additional unit of an addictive good.
© Dublin School of Grinds Page 3 Rónán MurdockSample Leaving Cert Question
As consumers consume more units of a good their marginal utility will eventually fall.
(i) Explain the underlined term.
_____________________________________________________________
(ii) Suggest one good a person may consume which may not result in a fall in
their marginal utility. Explain your answer.
(iii) Complete the following table in your answerbook. State at what point
diminishing marginal utility sets in and explain your choice.
Number of units consumed 1 2 3 4 5 6
Total utility in units 10 35 75 95 110 115
Marginal utility in units 10
2009 – Section A – Question 7 – 17 Marks
(a) State the Law of Diminishing Marginal Utility. Definition @ 9 marks
This law states that as a consumer consumes additional units of a good the marginal utility/
extra satisfaction derived from each additional unit consumed will eventually decline.
(b) The table below illustrates the Law of Diminishing Marginal Utility.
Number of units consumed 1 2 3 4 5 6
Total Utility in units 30 65 85 100 110 115
Marginal Utility in units 30
5 figures @ 1mark each= 5 marks
Complete the table and state the point after which diminishing utility set in. 3 marks
Diminishing utility sets in after the consumption of the 2nd unit/when the 3rd unit is
consumed.
© Dublin School of Grinds Page 4 Rónán MurdockConsumer Equilibrium
A consumer is in equilibrium when they follow the equi-marginal principal.
(i.e. they are maximising their utility, they are spending their income the best way possible)
The Law of Equi-Marginal Returns
“A consumer will enjoy maximum satisfaction when the ratio of MU to price is the same for
all the different types of goods which he buys”.
YOU NEED TO LEARN THIS
FORMULA OFF BY HEART, YOU
MU1 = MU2 DON’T GET IT ON THE DAY!!
P1 P2
A consumer is in equilibrium buying item A for €2 and item B for €6. the marginal utility of
item A is 5 utils and the marginal utility of item B is 15 utils.
Illustrate this using the Equi-marginal returns formula.
Answer
MU of Good A = MU of Good B = 5 utils = 15 utils
Price of Good A Price of Good B €2 €6
When two items are the same price the one with greater utility is purchased.
2000 – Section B – Question 1a – 20 Marks
1. (a) Explain, with the aid of an example, the Principle or Law of Equi-Marginal Returns
of Consumer Behaviour.
USE ABOVE ANSWER!!
2006 – Section A – Question 6 – 17 Marks
In equilibrium a consumer buys 8 bars of chocolate at €1.00 each and 12 sandwiches at
€4.00 each. The marginal utility of the eight bar of chocolate is 10 utils. Using the Equi-
Marginal Principle of Consumer Behaviour - calculate the marginal utility of the twelfth
sandwich. Show all your workings.
Note
Answer: 3 Stages in this question.
You must always put in the
formula as they usually give half
1 MU1 = MU2 the marks for writing it down
P1 P2
Marginal Utility of Chocolate = Marginal Utility of Sandwiches
2
Price of Chocolate Price of Sandwiches
10 = MUS MU Sandwiches = 40 utils
3
€1.00 €4.00
© Dublin School of Grinds Page 5 Rónán Murdock2005 – Section A – Question 6 – 17 Marks
A consumer in equilibrium buys 10 cups of coffee at €2 each and 10 phone cards at €6 each.
The marginal utility of the cups of coffee is 5 utils. What is the marginal utility of phone
cards? Show your workings.
Try this question yourself
Formula
1 2
Workings
3
Answer à Marginal utility of phone cards ___________
SAMPLE QUESTION
A woman wins a shopping voucher worth €350. She can pick any quantity of goods A and B
in her local furniture shop to the value of €350. The woman calculates her utility for each of
the two goods to be as follows.
Quantity GOOD A à €30 GOOD B à €20
Total Marginal Total Marginal
Utility Utility Utility Utility
1 130 130 100 100
2 200 180
3 250 240
4 285 280
5 315 300
6 330 305
(i) Fill in the figures for marginal utility in the table provided.
(ii) Prove that this woman should buy 5 units of good A and 4 units of good B in order
to maximise her total utility?
© Dublin School of Grinds Page 6 Rónán MurdockDemand
The Demand Curve slopes
downwards from L to R
indicating that the higher the
price the less the quantity that
will be demanded and the
lower the price the greater the
quantity that will be
demanded.
Demand curves which slope downwards from L to R are called Normal Demand Curves.
Exceptions to the Law of Demand
1) Giffen Goods
Essentials which constitute a large proportion of the expenditure of low-income
families e.g. white bread, potatoes, rice. If the price of bread is increased then people
would probably continue to buy the quantity they require after the price increase.
Example à White Bread
Paul earns a low wage. After all his bills he has €20 per day to feed his family. His family
needs 4 kilos of food every per day to live. Paul can buy either meat or bread to feed his
family. Meat is charged @ €8 per kilo and bread is charged at €4 per kilo.
Ideally Paul would like to buy as much meat as he can afford as it is tastier and healthier. With
food prices at this rate Paul can afford to buy 1 kilo of meat (€8) and 3 kilos of bread
(€4 x 3 = €12). à €8 + €12 = €20
However, if the price of bread was to rise to €5 per kilo and the price of meat was to stay the
same Paul would have to buy more bread as he can no longer afford to buy any meat. (€5 x
4kg = €20). So with Giffen Goods if prices rise it has a Neutral or Positive effect on demand.
2) Snob items or Goods of Ostentation
When the price of these goods falls (Rolls Royce) they lose their exclusiveness as
more people can now afford them and so demand amongst the more wealthy for these
goods decreases.
Example à Rolex
3) Specualtitive Goods
Goods, the demand for which is influenced by What is the shape of their
expectations – when the price of such goods increase, demand curve?
(stocks, houses) the quantity demanded may also increase
because of the expectation of future price increases.
Example à Houses , Shares
© Dublin School of Grinds Page 7 Rónán MurdockShifts in and Movements along a Demand Curve
Movement
A change in price results in a movement along a demand curve.
Shift
A change in any of the other Six conditions leads to a shift in the demand curve.
1) Future Expectations
2) Unplanned Events
3) Change in price of Substitute good
4) Change in consumer Taste / preferences
5) Income Levels
6) Change in Price of Complimentary goods.
To remember the 6 factors that cause a shift think if the word FUSTIC .
These factors can create more or less demand.
More Demand Less Demand
Demand Curve Shifts to Right Demand Curve Shifts to Left
© Dublin School of Grinds Page 8 Rónán MurdockRemember nothing has happened to the consumers
income / wages. That is still the same.
WHAT HAPPENS WHEN THE PRICE OF A GOOD FALLS?
òòPrice Fallsòò Price Falls òò Price Falls òò Price Falls òò Price Falls òò
Two things happen
1. The substitution effect
2. The income effect
The Substitution Effect
i. The good becomes cheaper compared to other goods.
ii. The substitution effect will always push the consumer in one direction.
HE
/
SHE
WILL
BUY
MORE
OF
THE
GOOD.
Income Effect
i. When a good drops in price it means that the consumer’s purchasing power
increases as a result of his/her real income increasing.
ii. However this doesn’t necessarily mean that the consumer will buy more of the
good.
Normal
Good
=
More
consump2on
For
a
normal
good
the
fact
that
real
income
has
increased
(as
a
result
of
the
good
being
cheaper)
will
cause
the
consumer
to
buy
more.
Inferior
/
Giffen
Good
=
Less
consump2on
If
the
good
is
inferior
or
giffen,
the
increase
in
real
income
will
cause
the
consumer
to
buy
less
of
the
good.
On
the
next
page
we
will
see
what
happens
when
the
income
effect
and
substitution
effect
are
combined.
© Dublin School of Grinds Page 9 Rónán MurdockEffects
of
a
Price
Reduction
on
the
following
goods
Substitution Income Effect Overall Effect
Effect
Positive Positive
Good X Demand rises as Demand rises as real
Normal good is relatively + income rises = Demand Rises by 20
Good cheaper (+10 units) (10 Units) units
Positive Negative Demand rises by 4
Good Y Demand rises as Demand falls as real units because the
Inferior good is relatively + income rises = positive substitution
Good cheaper (- 6 Units) effect is greater than
(+10 units) the negative Income
effect
Positive Negative Demand falls by 2
Good Z Demand rises as Demand falls as real units because the
Giffen good is relatively + income rises = negative Income effect
Good cheaper (- 8 Units) is greater than the
(+6 Units) positive substitution
effect
2013 Section B – Question 1c- 20 Marks
A fall in the price of a consumer product has both a substitution effect and an income effect.
(i) Explain the underlined terms.
Substitution effect Income effect
When the price of a good rises customers When the price of a good falls it means that
may shift to cheaper substitutes to maximise the consumer’s real income will rise.
utility.
(ii) If the price of an inferior product falls (all other things being equal) will more or less of
the product be purchased? Explain your answer with reference to the substitution effect and
the income effect.
Price of inferior Substitution effect Income effect
product falls
Effect on demand Demand will rise Demand will fall
Explanation The consumer is getting more Because the good is an inferior good,
marginal utility for this good demand will fall as the consumer will
now that it is cheaper. buy less as income has increased.
NB→ This point must be added to get full marks:
If positive substitution effect is greater than the negative income effect then demand for the
product will increase
© Dublin School of Grinds Page 10 Rónán MurdockSupply
The supply of a good/service is the total quantity which is made available at any given price
over a specific time period.
The Supply Equation - Sx = f(Px, Pog, C, Tn)
The Supply Curve slopes
upwards from L to R
because the higher the
price the greater the
quantity supplied i.e. a
positive relationship
between P and Q.
Other Types of Supply Curves
1) Perfectly Inelastic Supply Curve
There is a supply available
and the quantity supplied
will not fall even if there is a
price reduction – not
common – fish
2) Minimum Price
No supply will be made
available below a certain
price.
3) Limited Capacity
At a certain point there will be
no further increase in quantity
supplied as the firm has now
reached maximum productive
capacity even though prices
may continue to rise.
© Dublin School of Grinds Page 11 Rónán MurdockShifts in and Movements Along a Supply Curve
A change in price leads to a movement along the Supply Curve. Changes in anything else
leads to a shift in the Supply Curve
CUTEST
The following factors causes shifts in a supply curve
1. The Cost of producing the product.
2. Unplanned factors.
3. The state of the firm’s production TEchnology
4. Number of Sellers in the industry.
5. Taxation / Subsidy.
These factors can create more or less Supply .
More Supply Less Supply
Supply Curve Shifts to Right Supply Curve Shifts to Left
© Dublin School of Grinds Page 12 Rónán MurdockSupply and Demand Combined
Market Price for a commodity is determined by the
intersection of Supply and Demand Curves
Effects of Shifts on Equilibrium
There are 4 possible outcomes you must figure out what happens first.
1. More Demand Demand Curve Shifts to Right
2. Less Demand Demand Curve Shifts to Left
3. More Supply Supply Curve Shifts to Right
4. Less Supply Supply Curve Shifts to Left
© Dublin School of Grinds Page 13 Rónán MurdockPast Leaving Cert Questions
2014 Section B – Question 1a- 25 Marks
No of Units Consumed 1 2 3 4 5
Total Utility in Units 20 45 60 70 75
Marginal Utility in Units 10 25 15 10 5
(i) State and explain the law illustrated in the above table.
(ii) Outline two assumptions underlying this law.
T
O
O
M
2014 Section B – Question 1b - 30 Marks
(i) State the ‘Law of Supply’, and illustrate with a labelled diagram.
(ii) Explain how technical progress affects the supply curve.
(iii) Outline, with the aid of labelled diagrams, two other factors that would cause a
shift in the supply curve.
© Dublin School of Grinds Page 14 Rónán Murdock2014 Section B – Question 1c - 20 Marks Macklemore announces a concert in Ireland at a venue with a maximum capacity of 80,000 people. The tickets are priced at €65 and the concert sells out in hours. (i) Draw one labelled diagram, showing a market demand curve and a market supply curve that would be consistent with the above information. Explain your answer. (ii) Explain, using the concept of Consumer Surplus, why it might make sense for the concert promoters to have different ticket prices (e.g. VIP section, seating section and standing section) for this concert. © Dublin School of Grinds Page 15 Rónán Murdock
2013 Section B – Question 1a- 25 Marks
(i) Distinguish between the terms ‘effective demand’ and ‘derived demand’.
(ii) Outline two possible exceptions to the Law of Demand.

(i) Effective
  demand:
  Effective
  demand
  is
  demand
  supported
  by
  the
  necessary
  purchasing
power.
(ii) Derived
  demand:
  Where
  a
  factor
  or
  production
  is
  demanded
  not
  for
  its
  own
  use
  but
  for
its
  contribution
  to
  the
  production
  process.

2013 Section B – Question 1b – 30 Marks
The market for a brand of blue jeans is in equilibrium. Explain, with the aid of a separate
diagram in each case, the effects which each of the following is most likely to have on the
equilibrium position:
 Whenever
  you
  are
                              D.E.R.E. – D.E.R.E. – D.E.R.E. – D.E.R.E.
ask
  to
  graph
  a
  change
                Discuss
  to
  the
  Supply
  and
                        1. Effect
Demand
  curve
  think
                            2. Reason
         of
  D.E.R.E.
                             3. Equilibrium (New Price and New Quantity)

(i)                                                                                                                   DERE
Due to the economic downturn there is a reduction in the real income of consumers.
                       Effect

                                        Reason

                                        Equilibrium

A fall in the price of cotton, a key input in the production of the blue jeans.
                           Effect

                                        Reason

                                        Equilibrium

The blue jeans have recently been endorsed by a popular sports star.
                        Effect

                                        Reason

                                        Equilibrium

 © Dublin School of Grinds                                        Page 16                                           Rónán Murdock
Solution to the question on previous page.
(i) Due
to
the
economic
downturn
there
is
a
reduction
in
the
real
income
of
consumers.
Effect
Demand curve shifts to the left. DERE
Reason
Consumer income has fallen and they can’t afford the product.
Equilibrium
There is a new lower price and new lower quantity.
(ii) A
fall
in
the
price
of
cotton,
a
key
input
in
the
production
of
the
blue
jeans.
Effect
Supply curve shifts to the right.
Reason
The costs of production have fallen.
Equilibrium
There is a new lower price and new higher quantity.
(iii) The
blue
jeans
have
recently
been
endorsed
by
a
popular
sports
star.
Effect
Demand curve shifts to the right.
Reason
Consumers’ preference for these jeans has increased.
Equilibrium There is a new higher price and new higher
quantity
The Paradox of Value
Adam Smith identified the problem that certain goods have a high value in use and a low
value in exchange e.g. water, while others have a low value in use and a high value in
exchange e.g. diamonds
Therefore, it is the MU of a good and not its total utility which determines the price to be
paid.
Random question.
How could the government reduce the consumption of soft drinks?
1. ____________________________
2. ____________________________
3. ____________________________
© Dublin School of Grinds Page 17 Rónán Murdock2011 Section B – Question 1a – 20 Marks
(i) Define the economic terms: individual (consumer) demand; market demand.
(ii) Explain, with the aid of labelled diagrams, the relationship between individual
(consumer) demand and market demand.
Individual Demand: The quantity of a good an individual consumer demands at different prices.
Market Demand: The total quantity of a good that all consumers demand at different prices.
Consumer A Consumer B Market
2011 Section B – Question 1b – 30 Marks
(i) Distinguish between the economic meanings of a ‘movement along a demand curve’ and
a ‘shift in a demand curve’ for concert tickets. Illustrate your answer using diagrams. (16m)
Movement along a Demand Curve
This is a movement which is caused by a change in the selling price of the good itself, with
all other factors being equal.
Shift in a Demand Curve
If any of the factors other than the price of the good itself change this will result in a shift in
the demand curve.
Movement along a Demand Curve Shift in a Demand Curve
© Dublin School of Grinds Page 18 Rónán Murdock2011 Section B – Question 1b – 30 Marks
(ii) State and explain two factors that would cause a shift in a demand curve for concert
tickets. In each case explain how the factor affects the demand curve.
(14m) 2 Points @ 7 Marks
FACTORS
THAT
CAUSE
A
SHIFT
IN
THE
DEMAND
CURVE?
FUSTIC
1. Expectations About the Future
If consumers expects the performance not to repeated they may increase their demand.
If they expect ticket price to rise in the future they may buy the ticket now and demand
will increase.
Effect à
2. Unplanned Events
Factors such as the weather may influence the current demand for tickets e.g. good
weather may increase demand for an outdoor event.
Effect à
3. Change in price of Substitute Good
If the price of tickets for an alternative concert increased then demand for tickets for
this concert may increase.
Effect à
4. Taste / Preference
If the consumer’s preference for the artist/event becomes stronger then the demand for
concert tickets will increase.
Effect à
5. Income levels
If income rises then the demand for concert tickets will increase, assuming concert
tickets is a normal good.
Effect à
6. Change in price of Complementary good
If the price of hotel accommodation near the concert venue decreased then demand for
the concert tickets may increase.
Effect à
© Dublin School of Grinds Page 19 Rónán Murdock2012 – Section B – Question 1a – 25 Marks
(i) Explain the Equi-Marginal Principle of consumer behaviour.
(ii) State and explain three other economic assumptions used to analyse consumer
behaviour.
2011 Section B – Question 1c (i) – 25 Marks (12 Marks)
The Law of Diminishing Marginal Utility states that as more of a product is consumed,
eventually each additional unit of the good provides less additional utility (marginal utility).
(i) Explain two assumptions underlying the Law of Diminishing Marginal Utility. (2P X 6M)
(i) Assumptions underlying the Law of Diminishing Marginal Utility.
1. Applies after a certain point called the origin.
2. Addictive Goods
3. Time lapse
4. ‘Other factors’ affecting utility do not change.
2011 Section B – Question 1c (ii) – 25 Marks (13 Marks)
A consumer in equilibrium buys 6 health bars at €0.80 each and 9 cartons of juice at €1.50
each. The marginal utility of the 6th health bar is 40 utils.
(ii) Using the Equi-Marginal Principle of Consumer Behaviour calculate the marginal
utility of the ninth carton of juice. (Show all your workings.)
MU1 = MU2
P1 P2
Marginal Utility of Health Bars = Marginal Utility of Juice .
Price of Health Bars Price of Juice .
40 = X
80 150
X = 75 Utils
© Dublin School of Grinds Page 20 Rónán Murdock2010 Section B – Question 2a – 25 Marks (Sample Paper)
(i) Outline the Law of Demand.
(ii) State and explain three exceptions to the Law of Demand.
i.
ii.
1)
2)
3)
2008 Section B – Question 3a – 20 Marks (Sample Paper) (7m, 7m, 6m)
For something to be considered an economic good, it must possess certain characteristics.
State and explain THREE of these characteristics. (20 marks)
P
U
T
2008 Section B – Question 3b – 25 Marks (Sample Paper)
State and explain FIVE factors which affect a consumer’s demand schedule.
This can be caused by a movement or shift
Movement à Price
Shift à FUSTIC
1.
2.
3.
4.
5.
© Dublin School of Grinds Page 21 Rónán Murdock2008 Section B – Question 3c – 30 Marks (Sample Paper)
(i) Show by means of a labelled diagram, the market demand and supply for a product.
Indicate equilibrium price and quantity;
(ii) Using a separate diagram in each case, show the effects of the following on
equilibrium price and quantity:
• A successful advertising campaign in favour of the product;
• A tariff on imports of the product is increased
Advertising Campaign Tariff on Imports
Effect Effect
Reason Reason
Equilibrium Equilibrium
© Dublin School of Grinds Page 22 Rónán Murdock2010 Section B – Question 1a – 30 Marks
The data below represents the market demand and the market supply schedules for the soft
drink ‘Quencher’.
Price Quantity Demanded Quantity Supplied New Quantity
€ (‘000 units) (‘000 units) Supplied
2.00 40 5
2.25 30 10
2.50 20 20
2.75 10 30
3.00 5 40
(i) Using the above data, draw the diagram showing the market demand and market supply
curves for the soft drink ‘Quencher’. Clearly mark the point of equilibrium and the
equilibrium price and quantity.
(ii) Explain what it means for the market ‘to be in equilibrium’.
(iii) Assume costs of production fell, resulting in an extra 20,000 units supplied at each of
the above listed prices. With reference to your diagram in 1(a) (i) above and assuming that
demand remains unchanged, draw the new supply curve. Clearly indicate the new point of
equilibrium and the new equilibrium price and quantity.
(ii)Answer
To be in Equilibrium, is where quantity demanded meets quantity supplied and there is no
tendency for prices to change.
© Dublin School of Grinds Page 23 Rónán MurdockAnswer to question on previous page.
(iii) Notes on the graph below
• The points on the curves are clearly laid out, make sure you do this.
• Make sure to leave the same space between each point on the X and Y axis.
2010 Section B – Question 1c – 15 Marks
Many health advisors wish to reduce the consumption of soft drinks. Advise the Minister for
Health and Children on possible economic actions that the Government could take to reduce
the consumption of soft drinks.
1. Taxation
Increase taxes on soft drinks. (V.A.T.)
2. Education and Awareness campaign
The government could increase spending on advertising campaigns to raise awareness
of the problems which may result from the consumption of soft drinks.
3. Legislation
It could ban the sale of soft drinks in schools and colleges / ban their sale in vending
machines.
4. Subsidisation
By doing this the prices of substitute goods may be more attractive and this may lead
to a drop in the demand for soft drinks e.g. the subsidisation of milk in schools.
© Dublin School of Grinds Page 24 Rónán Murdock2009 Section B – Question 1a – 30 Marks
(i) Show, by means of a labelled diagram, the market demand and supply curves for games
consoles e.g. Xbox, PlayStation, Nintendo DS. Identify and explain the market equilibrium
position.
(ii) Explain, with the aid of a separate diagram in each
case, the effects which each
of the
following is most likely to have on the above equilibrium position:
a. 50% reduction in the price of computer games used with the games console
b. Quota placed on the quantity of games consoles entering Ireland
c. Government introduce a 2% levy (tax) on all income earned
50% reduction in the price of computer games used with the games console
Effect
Reason
Equilibrium
Quota placed on the quantity of games consoles entering Ireland
Effect
Reason
Equilibrium
Government introduce a 2% levy (tax) on all income earned
Effect
Reason
Equilibrium
© Dublin School of Grinds Page 25 Rónán MurdockSolution to the Question on the previous page
Discuss Discuss Discuss
Effect Effect Effect
Demand Curve Shifts to the Supply curve shifts to the Demand Curve shifts to the
right left left
Reason Reason Reason
Because the complimentary The quota has reduced the As a result of the levy
good is now cheaper. supply of the product. consumers have less
disposable income
Equilibrium Equilibrium Equilibrium
Higher Price Higher Price Lower Price
Higher Quantity Lower Quantity Lower Quantity
2008 – Section B – Question 1 – 20 Marks
1. (a) (i) Explain, with the aid of an example, the ‘Law of Demand’. (5m)
The Law of Demand states that an increase in price leads to a decrease in quantity
demanded, or a decrease in price leads to an increase in quantity demanded.
For Example, If price of a bar chocolate increased by 5c per bar then quantity demanded or
purchased would fall.
(ii) State and explain three exceptions to the ‘Law of Demand’. (15m)
1. Giffen
Goods
2. Snob
items
3. Speculative
goods
4. Goods
of
Addiction
© Dublin School of Grinds Page 26 Rónán Murdock2008 – Section B – Question 1b – 16 Marks
The data below represents the market demand and supply schedules for MP3 Players.
Price Quantity Demanded Quantity Supplied New Quantity Demanded
€ (‘000 units) (‘000 units) (‘000 units)
20 100 20
30 80 40
40 60 60
50 40 80
60 20 100
(i) Using the above data, draw the diagram showing the market demand and supply curves
for MP3 Players. (14m)
(ii) Show on your diagram the price and quantity of MP3 Players at which this market is in
equilibrium. (2m)
2008 – Section B – Question 1 – 25 Marks
(i) With reference to your diagram in 1(b) (i), assume that consumer demand for MP3
Players increases by 40 units at each price listed above, while supply remains unchanged,
draw the new demand curve for this situation and show the new equilibrium price and
quantity.
(ii) Explain two possible reasons for the shift in the demand curve.
1.
2.
3.
© Dublin School of Grinds Page 27 Rónán MurdockSolution to the question on previous page.
In this diagram it is important that you have a (ii) It is important that you show
• Correctly labelled demand curve the following on the graph
• Correctly labelled supply curve A) Equilibrium price €40
• Correctly labelling Price and Quantity axes B) Equilibrium quantity 60
• Correctly labelling demand and supply curves units
2005 Section B – Question 1a – 25Marks
State and explain FIVE factors which affect a consumer’s demand schedule.
(can also be phrased as cause a shift in the demand curve for a particular good)
1) Future Expectations
FUSTIC
2) Unplanned Events
3) Change in price of Substitute good
4) Change in consumer Taste / preferences
5) Income Levels
6) Change in Price of Complimentary goods
© Dublin School of Grinds Page 28 Rónán Murdock2007 – Section B – Question 1a – 20 Marks
(i) Define the economic terms: individual
(firm)
supply;
market
supply.
(ii) Explain, with the aid of labelled diagrams, the relationship between individual (firm)
supply and market supply.
Individual
Supply:
The
quantity
of
a
good
an
individual
firm
is
willing
to
supply
at
different
prices.
Market
supply:
The
total
quantity
of
a
good
that
all
firms
are
willing
to
supply
at
different
prices.
Firm
A
Supply
Firm
B
Supply
Market
Supply
Explanation of Relationship between Firm and Market Supply
© Dublin School of Grinds Page 29 Rónán Murdock2007 – Section B – Question 1b – 30 Marks Explain, with the aid of a labelled diagram, the supply curve of an individual firm in each of the following circumstances. State one example in each case. (i) A firm is willing to increase supply as price rises, but there is a minimum price below which the firm will not supply at all. (ii) A firm can supply only up to a maximum production capacity. (iii) The product is fixed in supply (e.g. perishable good) and a firm is operating in the short run. © Dublin School of Grinds Page 30 Rónán Murdock
2007 – Section B – Question 1c – 25 Marks
Outline FOUR factors, other than price, which affect the supply curve of an individual firm.
In each case explain how the factor affects the supply curve.

                                                                            CUTEST
1. The Cost of producing the product.
If there is an increase in costs of factors of production, which a firm uses in the production of
their good, then it will be more costly to manufacture the good. They will not continue to
supply the same quantity of the good at the old prices – there will be a reduction in the
quantity supplied.

2. Unplanned factors.
There may be changes in the quantity supplied, which were never intended by the producer.
Examples include agriculture – due to changes in the weather; diseases etc. In industry there
may be shortages of raw materials, strikes etc.

3. The state of the firm’s production technology.
As new machinery is invented, as labour becomes more specialised and efficient the factors
of production become more efficient. It becomes possible to increase their output even
thought the payments they receive remain the same.

4. Number of Sellers in the industry.
If the number of firms in the industry decreased e.g. due to rationalisation then the overall
quantity supplied to the market would decrease

5. Taxation / Subsidy.
If the government were to reduce the rates of taxation on the raw materials used in the
manufacture of a commodity, this represents a reduction in the cost of production and hence
quantity supplied would increase. If a subsidy is granted on the raw materials or on the
labour employed by the firm, this has the effect of reducing costs and thereby resulting in an
increase in the quantity supplied.

2006 – Section B – Question 1 – 15 Marks
For analytical purposes economists make certain assumptions about consumer behaviour.
State and explain FOUR principal assumptions.

© Dublin School of Grinds                     Page 31                            Rónán Murdock
2005 Section B – Question 1 – 30 Marks
(i) Show, by means of a labeled diagram, the market demand and supply for a product.
Indicate the equilibrium price and quantity in this market. (6m)
(ii) Explain, with the aid of a separate diagram in each case, the effects which each of the
following may have on the above equilibrium position:
• A successful advertising campaign in favour of the product is introduced;
• A tariff on imports of the product is removed.
Advertising Campaign Tariff on Imports
Effect Effect
Reason Reason
Equilibrium Equilibrium
© Dublin School of Grinds Page 32 Rónán MurdockAnswer to the question on the previous page. 2003 – Section B – Question 3A – 30 Marks (i) State and explain FOUR factors which affect a consumer’s demand schedule, other than the price of a good itself. (ii) Explain the economic rationale for assuming that a person’s demand curve for a normal good slopes downward. The reason a person’s demand curve for a normal good slopes downward as the price of a good falls the consumer buys more of this cheaper good, because the marginal utility per cent spent on this good increases and the consumer aims to maximise his/her total utility. © Dublin School of Grinds Page 33 Rónán Murdock
2005 Section B – Question 1 – 20 Marks
Assume that the average spending on energy by a low-income family is €40 weekly. The
price of energy rises by 20% so that the same consumption by a low-income family would
now cost €48 weekly. The government is considering introducing one of the following
policy measures to assist low-income families:

         a. Giving low- income families an increased allowance of €8 weekly (income
            supplement);
         b. Subsidising the producers of energy so that energy can continue to be sold at the
            initial price (price subsidy).

Which policy measure would you advise the government to take? Explain the economic
reasons for your answer.
                                           (A)
      1. Cost Efficient
      As the income supplement specifically targets low-income families it is cost efficient
      and cheaper for the government than the price subsidy.

      2. Purchasing Power Maintained / No change to standard of living
      Low-income families will now receive an additional €8 weekly income. The family
      now have a choice in deciding how to allocate this. It can maintain existing energy
      consumption or economise on the use of energy and use the €8 in some alternative
      way.

      3. Efficient use of scarce resources by consumers
      As the price of energy rises, consumers seeing this may economise on energy use thus
      saving scarce resources.

                                                OR

                                                (B)
      1. Protecting employment
      By using a price subsidy the demand for energy will remain unchanged and so
      employment is protected.

      2. Prevent an increase in inflation / maintain competitiveness
      The government may use the price subsidy so that energy prices remain unchanged
      hence maintaining price stability and ensuring that our competitiveness is not affected,
      subject to EU rules.

© Dublin School of Grinds                    Page 34                           Rónán Murdock
2003 – Section B – Question 3 – 20 Marks
For something to be considered an economic good, it must possess certain characteristics.
State and explain THREE of these characteristics.
If you’re in doubt on this question go back to the
chart on page 9. Remember it is a normal good.
2003 – Section B – Question 3c – 25 Marks
A consumer spends all income on two goods, Good A and Good B. Both goods are normal
goods but they are not complementary goods. The price of Good A is reduced and the price
of Good B remains unchanged. The consumer continues to spend all income on the two
goods.
Distinguish between the substitution effect and the income effect of the price reduction in
Good A.
Substitution
Effect
Income
Effect
Demand
for
Good
A
Demand
for
Good
A
Increases Increases
Good
A
is
now
relatively
cheaper.
Consumer
has
additional
income,
Hence
the
consumer
is
getting
due
to
the
reduction
in
price
of
Good
A
increased
marginal
utility
for
this
As
good
A
is
a
normal
good
the
demand
good.
for
this
good
will
increase.
Cutest
2001 – Section B – Question 3 – 25 Marks
State FOUR factors that affect the supply of a good, other than the price of the good itself,
and explain how each factor affects supply.
1) Cost of Producing the good
2) Unplanned Factors
3) Technology
4) Number of Sellers in the Industry
5) Taxation
© Dublin School of Grinds Page 35 Rónán Murdock2001 – Section B – Question 3 – 25 Marks
State and explain the principal economic assumptions made about consumer behaviour.
1.
2.
3.
4.
2001 – Section B – Question 3 – 25 Marks
The law of diminishing marginal utility states that as additional units of a good are consumed
the marginal utility of this good will eventually decline.
ii(i) State and explain the assumptions underlying the law of diminishing marginal utility.
Assumptions under the Law of Diminishing Marginal Utility
1.
2.
3.
4.
i(ii) Give TWO examples of commodities which do not comply with this law. Justify each
choice with a brief explanation.
2000 – Section B – Question 1a – 20 Marks
1. (a) Explain, with the aid of an example, the Principle or Law of Equi-Marginal Returns
of Consumer Behaviour.
The Law of Equi-Marginal Returns
“A consumer will enjoy maximum satisfaction when the ratio of MU to price is the
same for all the different types of goods which he buys”.
MU1 = MU2
P1 P2
A consumer is in equilibrium buying item A @ 2 and item B @ €6. the marginal utility of
item A is 5 utils and the marginal utility of item B is 15 utils.
MU of Good A = MU of Good B à 5 utils = 15 utils
Price of Good A Price of Good B €2 €6
When two items are the same price the one with greater utility is purchased.
© Dublin School of Grinds Page 36 Rónán MurdockIf you’re in doubt on this question go back to the
chart on page 9. Remember it is a normal good.
2000 – Section B – Question 1b – 30 Marks
A consumer spends all income on two goods, Good X and Good Y. Both goods are normal
goods but they are not complementary goods. The price of good X is reduced and the price
of good Y remains unchanged. The consumer continues to spend all income on the two
goods.
Explain, using the Substitution effect and Income effect how this price reduction affects the
demand for both goods.
Demand for Good X
Substitution
Effect
Income
Effect
Increases Increases
Good
X
is
now
relatively
cheaper.
Consumer
has
additional
income,
Hence
the
consumer
is
getting
due
to
the
reduction
in
price
of
Good
X
increased
marginal
utility
for
this
As
good
X
is
a
normal
good
the
demand
good.
for
this
good
will
increase.
Demand for Good Y
Substitution
Effect
Income
Effect
Decreases Increases
Good
Y
is
now
relatively
Expensive.
Consumer
has
additional
income,
Hence
the
consumer
is
now
getting
due
to
the
reduction
in
price
of
Good
X
decreased
marginal
utility
for
this
As
good
Y
is
a
normal
good
the
demand
good
in
comparision
to
good
X.
for
this
good
will
increase.
© Dublin School of Grinds Page 37 Rónán Murdock2000 – Section B – Question 1c – 20 Marks
(i) Explain briefly, what is meant by the Law of Demand.
The Law of Demand states that an increase in price leads to a decrease in quantity
demanded, or a decrease in price leads to an increase in quantity demanded.
For Example, If price of a bar chocolate increased by 5c per bar then quantity demanded or
purchased would fall.
(ii) There are exceptions to the Law of Demand.
Explain clearly THREE of these exceptions.
1. Giffen
Goods
2. Snob
items
3. Speculative
goods
4. Goods
of
Addiction
Supply and Demand – Short Questions
2009 – Section A – Question 7 – 17 Marks
(a) State the Law of Diminishing Marginal Utility. Definition @ 9 marks
This law states that as a consumer consumes additional units of a good the marginal utility/
extra satisfaction derived from each additional unit consumed will eventually decline.
(b) The table below illustrates the Law of Diminishing Marginal Utility.
Number of units consumed 1 2 3 4 5 6
Total Utility in units 30 65 85 100 110 115
Marginal Utility in units 30 35 20 15 10 5
5 figures @ 1mark each= 5 marks
Complete the table and state the point after which diminishing utility set in. 3 marks
Diminishing utility sets in after the consumption of the 2nd unit/when the 3rd unit is
consumed.
© Dublin School of Grinds Page 38 Rónán Murdock2008 – Section A – Question 6 – 17 Marks
China will host the Beijing Olympic Games in August 2008 and 7 million tickets are
available for the event. On the diagram below draw the supply curve for tickets and explain
the reason for its shape.
(5 Marks)
Explanation:
• The supply of tickets available for the Olympics is fixed at 7 million.
• Regardless of price this seating capacity will remain unchanged. (12 Marks)
2006 – Section A – Question 6 – 17 Marks
In equilibrium a consumer buys 8 bars of chocolate at €1.00 each and 12 sandwiches at
€4.00 each. The marginal utility of the eight bar of chocolate is 10 utils. Using the Equi-
Marginal Principle of Consumer Behaviour - calculate the marginal utility of the twelfth
sandwich. Show all your workings.
Answer:
© Dublin School of Grinds Page 39 Rónán MurdockSolution:
MU1 = MU2
P1 P2
Marginal Utility of Chocolate = Marginal Utility of Sandwiches
Price of Chocolate Price of Sandwiches
10 = MUS MU Sandwiches = 40 utils
€1.00 €4.00
2005 – Section A – Question 6 – 17 Marks
A consumer in equilibrium buys 10 cups of coffee at €2 each and 10 phone cards at €6 each.
The marginal utility of the cups of coffee is 5 utils. What is the marginal utility of phone
cards? Show your workings.
Solution:
MU1 = MU2
P1 P2
Marginal Utility of coffee = Marginal Utility of Phone Cards
Price of Coffee Price of Phone Cards
5 = MU P.C. MU Phone Cards = 15 utils .
€2 €6
2004 – Section A – Question 6 – 17 Marks
Define the Law of Diminishing Marginal Utility and state TWO assumptions underlying
the law.
The law of diminishing marginal utility states that as a consumer consumes additional units
of a good their marginal utility for this good will eventually decline.
Assumptions under the Law of Diminishing Marginal Utility
1. Applies after a certain point called the origin.
2. Addictive Goods
3. Time lapse
4. ‘Other factors’ affecting utility do not change.
(Definition: 9 marks graded Assumptions: 8 marks: 2 x 4 marks each.)
© Dublin School of Grinds Page 40 Rónán MurdockYou can also read