TITLE VI EQUITY ANALYSIS WAY2GO PROGRAM UPDATE JULY 2021
←
→
Page content transcription
If your browser does not render page correctly, please read the page content below
Title VI
    Equity Analysis
Way2Go Program Update
      July 2021
TABLE OF CONTENTS SUMMARY ................................................................................................................... 4 BACKGROUND .............................................................................................................. 5 SAMTRANS OVERVIEW .................................................................................................................................................. 5 FARE PROPOSAL ........................................................................................................... 6 CURRENT FARES ............................................................................................................................................................. 6 PROPOSED FARES ........................................................................................................................................................... 6 SAMTRANS TITLE VI POLICIES........................................................................................ 7 MAJOR SERVICE CHANGE POLICY .................................................................................................................................. 7 DISPARATE IMPACT POLICY ........................................................................................................................................... 7 DISPROPORTIONATE BURDEN POLICY ........................................................................................................................... 8 PUBLIC ENGAGEMENT FOR POLICY DEVELOPMENT ...................................................................................................... 9 EQUITY EVALUATION OF PROPOSED CHANGES ............................................................. 9 FARE EQUITY METHODOLOGY OVERVIEW................................................................................................................... 10 COVID 19 ...................................................................................................................................................................... 11 POTENTIAL ADVERSE EFFECTS ..................................................................................................................................... 11 DATA USE AND ANALYSIS............................................................................................................................................. 11 RIDERSHIP DEMOGRAPHICS OVERVIEW ...................................................................................................................... 13 ANALYSIS METHODOLOGY ........................................................................................................................................... 17 FARE EQUITY ANALYSIS FINDINGS ............................................................................................................................... 20 PUBLIC OUTREACH AND INVOLVEMENT ACTIVITIES .................................................... 22
TABLES
TABLE 1: CURRENT AND PROPOSED WAY2GO PASS PRICING AND CONTRACT MINIMUM

TABLE 2: FARE PAYMENT METHOD BY RIDERSHIP GROUP

TABLE 3: MINORITY AND INCOME STATUS BY FARE PAYMENT METHOD

TABLE 4: PROJECTED DEMOGRAPHICS OF DIFFERENT PASS PROGRAMS

TABLE 5: AVERAGE FARE BY FULL FARE PAYMENT METHOD

TABLE 6: AVERAGE FARE BEFORE PROPOSED FARE CHANGES

TABLE 7: AVERAGE FARE BY PASS PROGRAM AFTER PROPOSED FARE CHANGES

TABLE 8: RESIDENTIAL PASS PROGRAM AVERAGE FARE ANALYSIS

TABLE 9: EDUCATIONAL PASS PROGRAM AVERAGE FARE ANALYSIS

TABLE 10: EMPLOYER PASS PROGRAM AVERAGE FARE ANALYSIS

FIGURES
FIGURE 1: RIDERSHIP MINORITY STATUS

FIGURE 2: RIDERSHIP INCOME STATUS

FIGURE 3: FARE PAYMENT METHOD BY RIDERSHIP GROUP

ATTACHMENTS
ATTACHMENT 1: SAMTRANS SYSTEM MAP

ATTACHMENT 2: SAMTRANS BOARD APPROVAL OF DISPARATE IMPACT AND DISPROPORTIONATE
BURDEN POLICIES

ATTACHMENT 3: EXISTING FARE CHART AND PROPOSED FARE STRUCTURE

ATTACHMENT 4: AVERAGE FARE BY PAYMENT METHOD

ATTACHMENT 5: STAKEHOLDER ENGAGEMENT: LIST OF ORGANIZATIONS SURVEYED &
INTERVIEWED

ATTACHMENT 6: PUBLIC COMMENTS
SamTrans
Title VI Equity Analysis:
Way2Go Program Update
SUMMARY
In September 2020, the San Mateo County Transit District (“District”) initiated the
SamTrans Way2Go Pass Program Study (Study). Established in 2007, the SamTrans Way2Go
Pass program allows residential complexes and businesses (“participants”) to purchase
annual unlimited-ride bus passes for all eligible residents or employees (“users”). The Study
has proposed changes to the program structure in order to meet the following goals:
• Increase participation in the Way2Go Pass program and overall bus ridership
• Ensure the program pricing structures are equitable for partners and financially-
sustainable for the District
• Improve the efficiency and effectiveness of Way2Go Pass implementation and
administration
Throughout the Study, Staff engaged and received guidance from stakeholders, including
non-profit housing developers, educational institutions, San Mateo County businesses, and
peer transit agencies. Based on this input as well as technical and financial analysis, the
following changes are proposed to the Way2Go Pass program:
1. Add an additional category for educational institutions, which would allow colleges
and K-12 schools to participate in the program
2. Adjust the per-pass price, making the program more affordable and better aligned
with the bulk pass programs of peer agencies and the goals of increasing
participation
3. Reduce the contract minimum in order to be more inclusive of smaller businesses,
housing complexes, and other eligible groups
In order for the District to update the Way2Go program, it must make several changes to
its Fare Structure.1 These changes to the Fare Structure are being considered as part of a
single board action that will be heard in August 2021. The changes to the Way2Go Pass
Program align with the SamTrans Fare Policy to encourage ridership growth by keeping
SamTrans affordable and simple to use.
Title VI of the Civil Rights Act of 1964 (Title VI) prohibits discrimination on the basis of race,
color, and national origin in programs and activities receiving federal financial assistance.
The District has committed to the Title VI objectives set forth in the Federal Transit
Administration (FTA) Circular 4702.1B ensuring that FTA-assisted benefits and related
services are made available and are equitably distributed without regard to race, color, or
national origin.
1
The Fare Structure is the legal document that outlines the specific fares for the SamTrans bus system.
Way2Go Pass: Title VI Fare Equity Analysis – Aug. 2021 Page17721842.1
4 of 54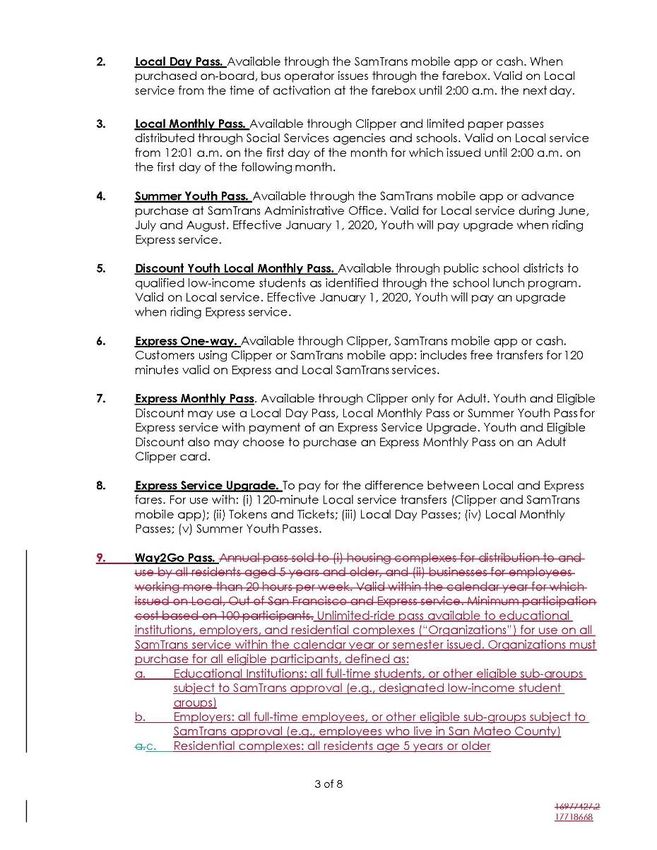
As a federal grant recipient, the District is required to maintain and provide to the FTA
information on District compliance with the FTA's Title VI regulations. At a minimum, the
District must conduct periodic compliance assessments to determine whether its services
are provided in a nondiscriminatory manner consistent with the law. Additionally,
SamTrans must ensure compliance by evaluating service and fare changes at the planning
and programming stages to determine whether those changes have discriminatory
impacts, including disparate impacts on minority populations and/or disproportionate
burdens on low-income populations. The indices of discrimination that could be monitored
for disparate impacts include fare structures that could consistently cause minority-group
riders to bear a higher fare burden than the overall riding public.
The changes to the Way2Go Pass program include changes to per-pass pricing and contract
minimums that would go into effect in 2022. The program would also be expanded to
include educational institutions. This assessment analyzes proposed changes to the
Way2Go Pass fare product and any potential impacts on minority and low-income
passengers. The analysis, contained in this report, found that the proposed changes do not
result in a disparate impact on minority passengers nor a disproportionate burden on low-
income passengers.
BACKGROUND
SAMTRANS OVERVIEW
The District provides SamTrans fixed-route bus service, as well as complementary ADA and
non-ADA paratransit and shuttle services in San Mateo County, California. The 446-mile
area also includes routes to San Francisco and Palo Alto. The District's diverse service area
contains both dense urban and suburban landscape with residents from an array of
different backgrounds. Prior to COVID-19, SamTrans operated approximately 78 routes
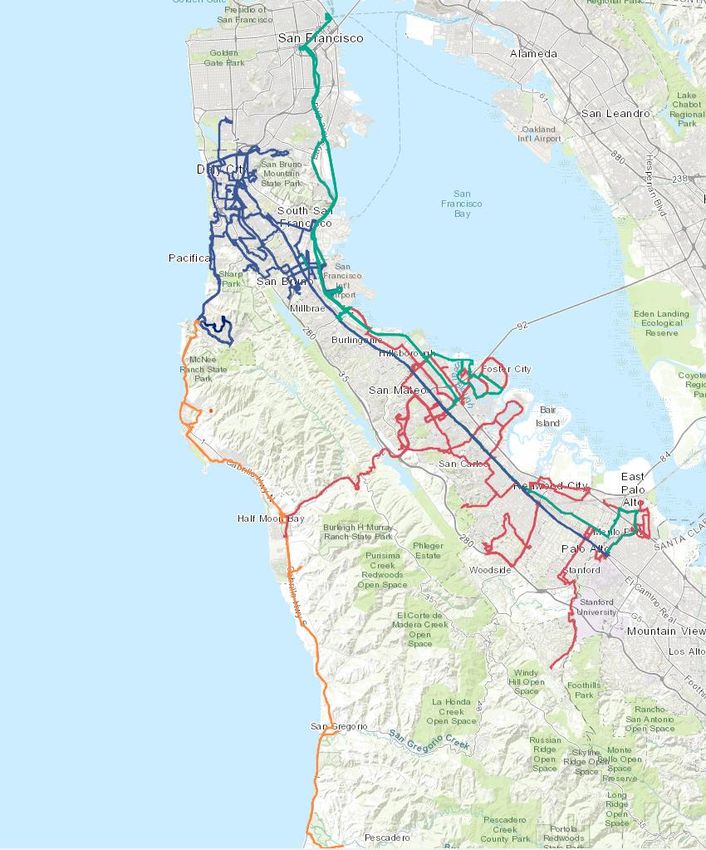
throughout San Mateo County and San Francisco County. Attachment 1 is a copy of the
SamTrans Service Map.
Established in 2007, the Way2Go Pass program allows residential complexes and
businesses (“participants”) to purchase annual unlimited-ride bus passes for all eligible
residents or employees (“users”). Way2Go Passes are loaded onto Clipper® regional fare
payment cards and are valid for a single calendar year for use on Local and Express services.
There are currently three non-profit residential properties participating in the program. The
Way2Go Pass program generated $48,625 in 2018, $67,334 in 2019, and $62,000 in 2020,
for a total of $177,959 over the past three years. In Fiscal Year 2019, the Way2Go Pass
generated approximately 0.5% of the agency's farebox revenue.
Way2Go Pass: Title VI Fare Equity Analysis – Aug. 2021 Page17721842.1
5 of 54
FARE PROPOSAL
CURRENT FARES
At present, Way2Go Pass program participants must purchase a pass for all eligible users,
as defined below:
• Residential complexes: All residents age five years old and older are considered
“Way2Go Users.”
• Business: All staff working more than 20 hours per week, excluding temporary
employees, interns, contractors and consultants, are considered “Way2Go Users.”
The 2021 Way2Go agreement specifies that employees of residential complexes and
temporary employees or contractors of businesses are not eligible for the program.
The annual cost of Way2Go Passes is $125 per resident or employee (i.e., per user) with a
contract minimum of $12,500, which equates to 100 passes. The cost is prorated if the
participant joins the program or adds a user for less than a full year. The initial sign-up fee
is paid upfront prior to the Way2Go Pass start date.
PROPOSED FARES
This Fare Equity Analysis analyzes the following proposed fare changes:
1. Add an additional category for educational institutions, which would allow
colleges and K-12 schools to participate in the program
2. Adjust the per-pass price, making the program more affordable and better aligned
with the bulk pass programs of peer agencies and the goals of increasing
participation
3. Reduce the contract minimum, in order to be more inclusive of smaller businesses,
housing complexes, and other eligible groups
The proposed pricing changes are reflected in Table 1.
Table 1: Current and Proposed Way2Go Pass Pricing and Contract Minimum
Pricing Category (Annual Price per Pass)
Contract
Residential Educational Minimum
Employer
Complex Institution
Current $125 Not Eligible $125 $12,500
$35 per
Proposed $40 $75 $2,500
semester*
*Semesters would be designed to cover the full calendar year (e.g., January through July, and August
through December)
Attachment 3 reflects the proposed changes to the SamTrans Fare Structure.
Way2Go Pass: Title VI Fare Equity Analysis – Aug. 2021 Page17721842.1
6 of 54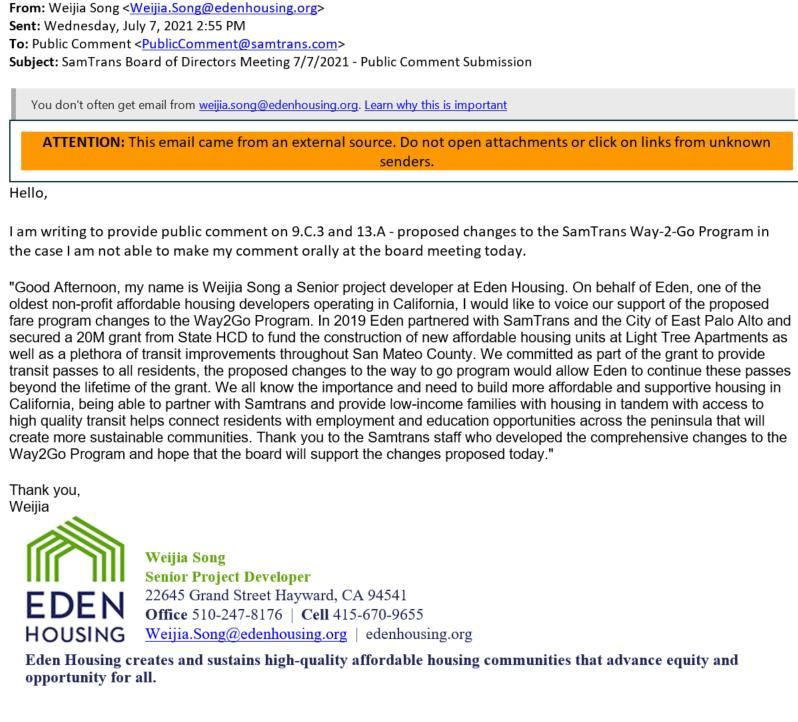
SAMTRANS TITLE VI POLICIES
The Federal Transit Administration updated its Title VI of the Civil Rights Act of 1964
guidance in October 2012, through FTA Circular 4702.1B. This guidance requires that the
governing authority of each federally assisted public transportation provider adopt three
policies including:
• Major Service Change Policy
• Disparate Impact Policy
• Disproportionate Burden Policy
The District adopted its policies based on a number of factors, including existing policies
already in use, consultation with other transit agencies, and analysis of impacts of past
service and fare change decisions. The District published its policies for public review in
January 2013 and conducted significant public outreach to solicit input. Following public
engagement, the District revised the policy proposals and the Board of Directors adopted
the revised policies at its March 13, 2013 meeting. The adopted policies follow and are
included in Attachment 2.
MAJOR SERVICE CHANGE POLICY
All major increases or decreases in transit service are subject to a Title VI Equity Analysis,
which must be completed and presented for Board consideration prior to Board approval
of the subject service change. A major service change is defined as a reduction or increase
of 25 percent or more in total vehicle revenue miles in service on any specific route over a
one-week period. Certain changes, such as temporary changes lasting less than 12 months,
are exempt.
DISPARATE IMPACT POLICY
This policy establishes a threshold for determining whether a given action has a disparate
impact on minority populations versus non-minority populations. Per FTA Circular 4702.1B:
Disparate impact refers to a facially neutral policy or practice that
disproportionately affects members of a group identified by race, color,
or national origin, where the recipient’s policy or practice lacks a
substantial legitimate justification and where there exists one or more
alternatives that would serve the same legitimate objectives but with less
disproportionate effect on the basis of race, color, or national origin….
The policy shall establish a threshold for determining when adverse
effects of [fare/]service changes are borne disproportionately by minority
populations. The disparate impact threshold defines statistically
significant disparity and may be presented as a statistical percentage of
impacts borne by minority populations compared to impacts borne by
non-minority populations. The disparate impact threshold must be
Way2Go Pass: Title VI Fare Equity Analysis – Aug. 2021 Page17721842.1
7 of 54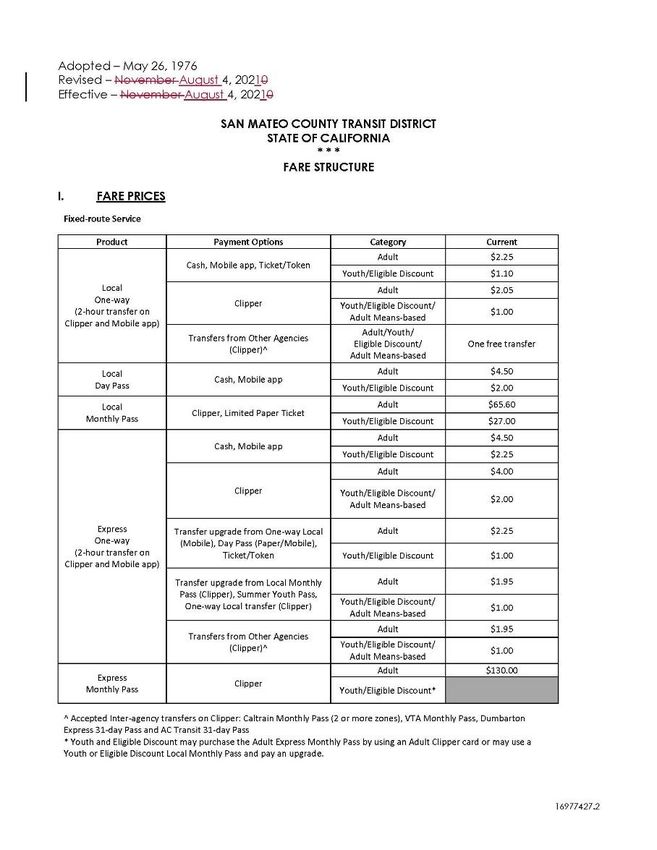
applied uniformly…and cannot be altered until the next Title VI Program
        submission.

In the course of performing a Title VI Equity Analysis, the District must analyze how the
proposed action would impact minority populations as compared to non-minority
populations. In the event the proposed action has a negative impact that affects minorities
more than non-minorities with a disparity that exceeds the adopted Disparate Impact
Threshold, or that benefits non-minorities more than minorities with a disparity that
exceeds the adopted Disparate Impact Threshold, the District must evaluate and
demonstrate a substantial legitimate justification that cannot otherwise be accomplished,
and that the proposed change is the least discriminatory alternative.

The District's Disparate Impact Threshold, which determines whether the impacts of a
major service change (as defined in the Major Service Change Policy) or a fare adjustment
are significant enough to require further analysis, is established at 20 percent based on the
cumulative impact of the proposed service and/or fare changes. This threshold applies to
the difference of the impacts borne by minority populations compared to the same impacts
borne by non-minority populations.

DISPROPORTIONATE BURDEN POLICY
This policy establishes a threshold for determining whether a given action has a
disproportionate burden on low-income populations versus non-low-income populations.
Per FTA Circular 4702.1B:

        The policy shall establish a threshold for determining when adverse
        effects of [fare/]service changes are borne disproportionately by low-
        income populations. The disproportionate burden threshold defines
        statistically significant disparity and may be presented as a statistical
        percentage of impacts borne by low-income populations as compared to
        impacts borne by non-low-income populations…. The disproportionate
        burden threshold must be applied uniformly…and cannot be altered until
        the next [Title VI] program submission.

        At the conclusion of the analysis, if the transit provider finds that low-
        income populations will bear a disproportionate burden of the proposed
        [fare/]service change, the transit provider should take steps to avoid,
        minimize or mitigate impacts where practicable. The provider should
        describe alternatives available to low-income populations affected by the
        [fare/]service changes.

The District's Disproportionate Burden Threshold, which determines whether the adverse
impacts of a major service change (as defined in the Major Service Change Policy) or a fare
adjustment is significant enough to require mitigation is established at 20% percent based
on the cumulative impact of the proposed service and/or fare changes. This threshold
applies to the difference of the impacts borne by low-income populations compared to the

Way2Go Pass: Title VI Fare Equity Analysis – Aug. 2021                           Page17721842.1
                                                                                       8 of 54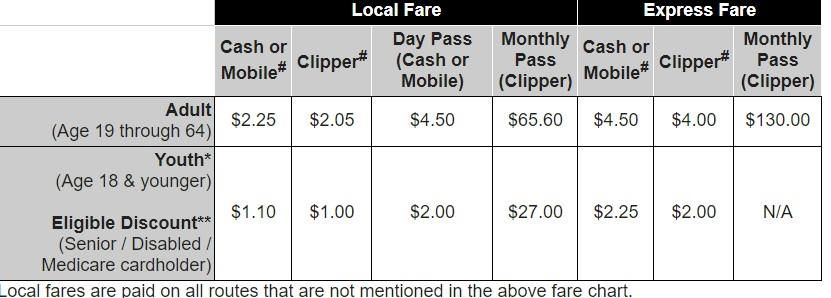
same impacts borne by non-low-income populations.
PUBLIC ENGAGEMENT FOR POLICY DEVELOPMENT
FTA Circular C 4702.1B requires transit agencies to seek public input before Board action to
adopt the Disparate Impact and Disproportionate Burden policies. Staff received public
input through four community meetings throughout the county to further develop the
District's Major Service Change, Disparate Impact and Disproportionate Burden policies.
Comments were also made through the mail, telephone, and the dedicated e-mail address
of TitleVI@samtrans.com.
The community meetings were held:
Tuesday, Feb. 12, 2013 6:30 p.m. to 8 p.m.
Pacifica Sharp Park Library
104 Hilton Way, Pacifica
Tuesday, Feb. 19, 2013 6:30 p.m. to 8 p.m.
War Memorial Activity Room
6655 Mission St., Daly City
Thursday, Feb. 21, 2013 10:00 a.m. to 11:30 a.m.
SamTrans Offices
1250 San Carlos Ave., San Carlos
Monday, Feb. 25, 2013 6:30 p.m. to 8 p.m.
Lewis and Joan Platt East Palo Alto Family YMCA
550 Bell St., East Palo Alto
A total of 15 members of the public participated in the meetings, providing valuable
comments for staff. Upon receipt of the input from meeting attendees, staff revised the
proposals for its standards and policies and submitted them for Board approval. The Board
of Directors approved the Policies on March 13, 2013.
More information regarding the District’s Title VI policies and standards can be found here:
http://www.SamTrans.com/riderinfo/TitleVI.html
EQUITY EVALUATION OF PROPOSED CHANGES
In accordance with 49 CFR Section 21.5 (b) (2), 49 CFR Section 21.5 (b) (7) and Appendix C
to 49 CFR part 21, grantees must evaluate all non-exempt fare changes to determine
whether those changes have a discriminatory impact on minority or low-income
populations.
In performing this analysis, it is concluded that the proposed Way2Go Pass program pricing
change would not have a disparate impact on minority customers nor impose a
Way2Go Pass: Title VI Fare Equity Analysis – Aug. 2021 Page17721842.1
9 of 54disproportionate burden on low-income customers based on the District's Policies.
FARE EQUITY METHODOLOGY OVERVIEW
Based on FTA Circular 4702.1B, for proposed changes to fares by payment type or fare
media, the District should analyze any available information generated from ridership
surveys that indicate whether minority and low-income passengers are more likely to use
the payment types subject to the proposed change and the associated fare changes
resulting from the change. If the difference in the percentage change experienced between
minority riders and non-minority riders is greater than 20%, that would suggest that the
fare change would result in disparate impacts on minority populations. If the percentage
difference in the change experienced between low-income riders and non-low-income
riders is greater than 20%, that would suggest that the fare change would result in a
disproportionate burden to low-income populations. A difference of less than 0% (any
negative percentage) would indicate that the fare change would benefit those populations
more than the others.
This particular Fare Equity Analysis does not follow the District's typical fare equity analysis
template because the subject fare product is paid for by purchasers who are not the end
users, and generally, if a developer, university, or employer pays the entire pass price for
their residents, students, or employees, no analysis is required. District staff reviewed
previous institutional pass analyses from peer agencies including AC Transit, VTA and
Sacramento Regional Transit as possible guides to conduct this type of analysis. Further,
the Way2Go Pass currently only has three residential properties participating and does not
have any employer participants, and the proposed fare changes would introduce a new
educational pass option. As result, limited data on current and potential users are available
to conduct the analysis, so alternative data sources were used as appropriate.
The analysis and methodology for this analysis use data from the SamTrans 2019 Origin-
Destination Survey from Fall 2019, the 2020 Way2Go User Survey, and the American
Community Survey (ACS) 5-Year for 2015-2019.
The methodology developed to analyze the impact of the fare proposal on minority
populations compared to non-minority populations and low-income populations compared
to non-low-income populations included the following steps:
1. Defining the term “minority” to mean those who self-identified as any ethnicity
other than “white” alone or indicated that they are of Hispanic, Latino, or Spanish
origin. Non-minority is defined as White/Caucasian and not of Hispanic, Latino, or
Spanish origin.
Way2Go Pass: Title VI Fare Equity Analysis – Aug. 2021 Page 17721842.1
10 of 542. Approximating the threshold for low-income status as those with an annual
household income at or below 200 percent of the U.S. Department of Health and
Human Services (HHS) poverty guidelines.2
3. Analyzing the average fare paid by current and potential users before and after
the proposed fare changes and the percentage change.
4. Using survey data and current fares and proposed change to the Fare Structure to
determine if the proposed fare change will have a disparate impact or
disproportionate burden on minority or low-income populations, respectively,
based on the agency’s associated policies.
COVID-19
In March 2020, the COVID-19 pandemic caused many counties, including San Mateo
County, to issue Shelter In Place (SIP) orders to prevent the spread of the COVID-19, and
many riders to cease their use of public transportation. These changes reduced ridership
on SamTrans by over 75% percent. At the time of writing this analysis, ridership has yet to
return to pre-COVID levels. As a result, the data used for this analysis may not reflect
ridership changes caused by COVID-19.
POTENTIAL ADVERSE EFFECTS
Typically, adverse effects associated with a fare change relate to the cost increase of a
transit trip, fare or fare media. The residential pass and educational pass pricing would
result in a decrease in average fare. Accordingly, this analysis does not anticipate any
potential adverse effects to current or potential users of these programs. Rather, the
residential and educational passes would create an overall benefit for the users of these
programs.
DATA USE AND ANALYSIS
For purposes of examining fare payment behavior, the following data were used:
• The SamTrans 2019 Origin-Destination Survey contains ridership demographics that
include ethnicity, race, income, and household size. The Survey has a sample size of
1,242, including weekday peak, off-peak, and weekend riders. Fieldwork for the
SamTrans 2019 Origin-Destination Survey was conducted during Fall 2019. The
collection of survey data in Spring 2020 has been postponed due to the COVID-19
pandemic. The data used in this analysis are weighted to overall monthly ridership
since a sample size sufficient to weight by time period has not yet been collected.
• For the SamTrans 2019 Origin-Destination Survey, respondents were asked to
2
The employer pass analysis defines an individual as low-income if the individual’s annual household
income was at or below or 150 percent of the poverty level due to limitations of the data available from
2019 ACS, 5-Year.
Way2Go Pass: Title VI Fare Equity Analysis – Aug. 2021 Page 17721842.1
11 of 54indicate whether they are of Hispanic, Latino, or Spanish origin in addition to their
ethnicity. "Minority" included riders who are Asian, Native Hawaiian/Pacific
Islander, Middle Eastern, Hispanic, Black/African American, American
Indian/Alaskan Native, and Other (including multi-racial). "Non-minority" was
defined as White/Caucasian and not of Hispanic, Latino, or Spanish origin.
• The 2020 Way2Go User Survey has a sample size of 216 surveys. Individuals were
required to complete this survey prior to obtaining a pass.
• For the 2020 Way2Go User Survey, "minority" included riders who are Asian, Native
Hawaiian or Other Pacific Islander, Hispanic/Latino, Black/African American,
American Indian or Alaskan Native, and Other. "Non-minority" was defined as
White/Caucasian.
• For the analysis using the SamTrans 2019 Origin-Destination Survey, a rider was
defined as "low-income" if the rider's household income was reported as 200% or
less of the federal poverty level to account for the region’s higher cost of living when
compared to other regions. This level is approximated by considering both the
household size; 2018 household income combinations that comprise “low-income”
are as follows:
HHS 2018 Poverty Guidelines
LOW INCOME
Household Household
Size Income
1+ Under $25K
2+ Under $35K
3+ Under $50K
4+ Under $75K
5+ Under $75K
6+ Under $75K
7+ Under $100K
8+ Under $100K
For example, a household of two or more persons with an income of $33,000 would
be considered low-income.
• The residential pass analysis uses the 2020 Way2Go User Survey. A Way2Go User
was defined as "low-income" if the individual’s household income was reported as
200% or less of the federal poverty level. This level was approximated by
considering both the household size, and household income combinations that
comprise “low-income” are as follows:
Way2Go Pass: Title VI Fare Equity Analysis – Aug. 2021 Page 17721842.1
12 of 54HHS 2019 Poverty Guidelines
LOW INCOME
Household Household
Size Income
1+ Under $25K
2+ Under $40K
3+ Under $50K
4+ Under $75K
5+ Under $75K
6+ Under $75K
7+ Under $100K
8+ Under $100K
The employer pass analysis uses data from 2019 ACS, 5-Year, Table S0804: Means
of Transportation to Work by Selected Characteristics for Workplace Geography. An
individual is defined as low-income in this data set if the individual’s household
income is 150% or less of the poverty level. This level is defined by the United States
Census Bureau following the Office of Management and Budget’s Directive 14.
Table S0804 does not provide data on individuals with household income of 200%
of the poverty level.
For calculating the average fare paid by potential users of the educational and
employer pass programs, Fiscal Year (FY) 2019 farebox ridership data as well as
monthly pass and transfer data from the SamTrans 2018 Triennial Survey were used
to determine usage rates for the different fare payment methods available to full
fare riders. These usage rates were applied to fare levels for the fare payment
methods effective January 2020 to determine average fare per boarding.
Data Assumptions:
• Even though the SamTrans 2019 Origin-Destination Survey data is a robust set,
some passengers preferred not to reveal their ethnicity, income and/or household
size. Based on the unavailable data, the useable data set includes those who
responded to the applicable questions to categorize respondent as minority and
low-income status.
RIDERSHIP DEMOGRAPHICS OVERVIEW
To support the Fare Equity analysis, we performed cross-tabulations of the survey data to
develop a breakdown of fare payment by minority and low-income riders, versus non-
minority and non-low-income riders, as shown in the figures and tables below.
System-wide SamTrans Ridership Demographics
Figures 1 and 2 provide a system-wide overview on ethnicity and income based on the
SamTrans 2019 Origin-Destination Survey. For SamTrans, “minority” riders are actually the
Way2Go Pass: Title VI Fare Equity Analysis – Aug. 2021 Page 17721842.1
13 of 54“majority” of SamTrans ridership.
Figure 1: Ridership Minority Status Figure 2: Ridership Income Status
Non- Low-
Minority, Minority, Non-Low- Income,
19% 81% Income, 52%
48%
Source: SamTrans 2019 Origin-Destination Survey, Fall 2019
We also reviewed the relationship between fare payment methods and ethnicity and
income as we recognize that various fare changes may impact some protected groups more
than others. Table 2 and Figure 3 present the fare payment method by minority and income
status, while Table 3 presents the percentage of minority and low-income ridership by fare
payment method. While minority and non-minority riders have similar distribution among
fare payment methods, low-income riders are more likely to use cash and less likely to use
a monthly pass compared to non-low-income riders.
It should be noted that for less commonly used fare payment methods (e.g., Full Fare -
Caltrain Monthly Pass (2+ zones) and Full Fare - Way2Go Pass) there were limited survey
responses on the SamTrans 2019 Origin-Destination Survey. As such, when analyzing the
demographics of these fare payment methods, there may be no survey responses for
certain populations and fare payment methods (e.g., there were no non-minority
respondents using a Way2Go Pass). This may skew the distribution of each ridership group
by fare payment method in Table 2 and the split between protected and non-protected
populations by fare payment method in Table 3.
Way2Go Pass: Title VI Fare Equity Analysis – Aug. 2021 Page 17721842.1
14 of 54Table 2: Fare Payment Method by Ridership Group
Non-
Non- Low-
Fare Payment Method Overall Minority Low-
Minority Income
Income
Full Fare - Cash / Token 18% 19% 16% 23% 17%
Full Fare - Clipper / Mobile 21% 22% 19% 21% 28%
Full Fare - Day Pass 5% 5% 6% 6% 5%
Full Fare - Monthly Pass 24% 24% 20% 18% 29%
Full Fare - Caltrain Monthly Pass (2+ zones) 0.2% 0.2% 0.4% n/a 0.6%
Full Fare - Way2Go Pass 0.3% 0.4% n/a 0.5% n/a
Eligible Discount - Cash / Token 11% 11% 10% 11% 7%
Eligible Discount - Clipper / Mobile 6% 5% 7% 5% 5%
Eligible Discount - Day Pass 2% 2% 1% 3% 1%
Eligible Discount - Monthly Pass 10% 9% 18% 9% 7%
Eligible Discount - Way2Go Pass 1% 1% 1% 1% 1%
Eligible Discount - Redi-Wheels 2% 1% 3% 3% 1%
Total 100% 100% 100% 100% 100%
Source: SamTrans 2019 Origin-Destination Survey, Fall 2019
Note: n/a – no survey responses
Figure 3: Fare Payment Method by Ridership Group
30%
25%
20%
15%
10%
5%
0%
Overall Minority Low-Income
Source: SamTrans 2019 Origin-Destination Survey, Fall 2019
Way2Go Pass: Title VI Fare Equity Analysis – Aug. 2021 Page 17721842.1
15 of 54Table 3: Minority and Income Status by Fare Payment Method
Non-
Non- Low-
Fare Payment Method Minority Total Low- Total
Minority Income
Income
Full Fare - Cash / Token 84% 16% 100% 59% 41% 100%
Full Fare - Clipper / Mobile 84% 16% 100% 45% 55% 100%
Full Fare - Day Pass 80% 20% 100% 56% 44% 100%
Full Fare - Monthly Pass 84% 16% 100% 40% 60% 100%
Full Fare - Caltrain Monthly Pass (2+ zones) 67% 33% 100% n/a 100% 100%
Full Fare - Way2Go Pass 100% n/a 100% 100% n/a 100%
Eligible Discount - Cash / Token 83% 17% 100% 64% 36% 100%
Eligible Discount - Clipper / Mobile 78% 22% 100% 55% 45% 100%
Eligible Discount - Day Pass 94% 6% 100% 76% 24% 100%
Eligible Discount - Monthly Pass 68% 32% 100% 58% 42% 100%
Eligible Discount - Way2Go Pass 69% 31% 100% 56% 44% 100%
Eligible Discount - Redi-Wheels 62% 38% 100% 80% 20% 100%
Overall 81% 19% 100% 52% 48% 100%
Source: SamTrans 2019 Origin-Destination Survey, fall 2019
Note: n/a – no survey responses
For each of the three Way2Go Pass categories, we also explored the demographics of
current users (Way2Go Users participating in the program through residential complexes)
and potential users (those who will be eligible for the pass through educational
institutions and employers), comparing these to systemwide ridership demographics, as
shown in Table 4. These demographics were important in considering the pricing of the
programs. Users who could access the pass through residential complexes are more likely
to be minority and have low incomes than the systemwide SamTrans ridership. The
demographics of potential users who could access the pass through educational
institutions are projected to be very similar to the systemwide SamTrans ridership with a
slightly higher proportion of users being having low incomes. The demographics of those
who could access the pass through their employers are projected to be very different than
the systemwide SamTrans ridership. Potential users of the pass through employers are
expected to be more likely to be non-minority and non-low income than systemwide
SamTrans ridership.
Table 4: Projected Demographics of Way2Go Pass Program Categories
Non- Non-Low-
Population Minority Minority Low-Income Income
Residential Complex Pass Users 96% 4% 82% 18%
Educational Institution Pass
83% 17% 57% 43%
Users
Employee Pass Users 61% 39% 6% 94%
Systemwide SamTrans
81% 19% 52% 48%
Ridership
Sources: 1) Residential Complex-Provided Pass – 2020 Way2Go User Survey; 2) Educational Institution-Provided Pass – SamTrans
2019 Origin-Destination Survey, Fall 2019 (full fare riders on routes serving campuses); 3) Employer-Provided Pass – 2019 ACS, 5-
Year, Table S0804: Means of Transportation to Work by Selected Characteristics for Workplace Geography; 4) Systemwide
SamTrans Ridership – SamTrans 2019 Origin-Destination Survey, Fall 2019.
Way2Go Pass: Title VI Fare Equity Analysis – Aug. 2021 Page 17721842.1
16 of 54For the pass acquired from residential complexes, the demographics from the 2020
Way2Go User Survey were used instead of the SamTrans 2019 Origin-Destination Survey
due to the larger sample size. The 2020 Way2Go User Survey had a sample size of 221
potential users compared to the 2019 Origin-Destination Survey with a sample size of 12.
Individuals are required to complete this survey prior to obtaining a pass. While only
approximately two-thirds of respondents provided the necessary demographic information
(e.g., ethnicity, household size, and income), there were still 140 records with sufficient
information to determine minority status and 124 records with sufficient information to
determine low-income status.
For the pass available through educational institutions, the demographics of potential users
were estimated based on the demographics of full fare riders on routes serving San
Francisco State University (route 122) and the three San Mateo County Community College
District (SMCCCD) campuses, including Skyline College located in San Bruno (routes 121,
140), College of San Mateo in San Mateo (routes 250, 260, 294), and Cañada College in
Redwood City (routes 274, 275, 278). The proportion of the student body that is “White,
non-Hispanic” generally aligns with the rider survey data for the routes serving the
campuses. Minority status data is available for these student bodies, but not income status.
For San Francisco State University, 15% of undergraduates indicated they identify as
“White, non-Hispanic” in academic year 2020-2021. For SMCCCD, 17% of the fall cohorts
for 2015-2019 indicated they identify as “White.”
In 2019, according to the United States Bureau of Labor Statistics, there were more than
21,000 employer establishments in San Mateo County. More than half had fewer than five
employees. Given the uncertainty of which employers would participate in the Way2Go
Pass option with the revised pricing, demographics of employees in San Mateo County were
used. Data on demographics of employees working in San Mateo County are available from
2019 ACS, 5-Year, Table S0804: Means of Transportation to Work by Selected
Characteristics for Workplace Geography. As noted previously, the definition of "low-
income" varies slightly from how low-income was defined for surveys administered by the
District, which apply HHS poverty guidelines. Table S0804 provides information on
individuals with household income under 150% of the poverty level while the SamTrans
rider survey defines "low income" as individuals with household incomes under 200% of
the poverty level.
ANALYSIS METHODOLOGY
This Fare Equity Analysis assesses how minority and low-income (protected) vs. non-
protected current and potential users would be affected by the proposed fare changes by
comparing the average fare before and after the proposed fare changes, and the
percentage changes, within each category of potential pass users: those acquiring it from
residential complexes, educational institutions and employers. In accordance with the
District's Disparate Impact Policy and Disproportionate Burden Policy, impacts are
considered disparate or disproportionate when the differences are greater than 20%. Due
to inconsistencies across the potential Way2Go Pass participants, each of the categories of
Way2Go Pass: Title VI Fare Equity Analysis – Aug. 2021 Page 17721842.1
17 of 54potential pass users are analyzed separately, rather than cumulatively.
Average Fare
This Fare Equity Analysis estimates the average fare paid (or received by SamTrans) before
and after the proposed fare changes for potential users. Due to impacts of COVID-19 on
ridership, pre-COVID average fare data were used. In addition, average fares were adjusted
to reflect fare changes that went into effect in January 2020.
Using historical data, the average fare for before the proposed fare changes is calculated
for:
Average fare per boarding for Way2Go Pass users (revenue per user of the
residential pass)
Average fare per boarding for SamTrans full fare riders (average fare paid by
potential users of the educational and employer passes)
For users of the pass program receiving passes through residential complexes, the analysis
uses the average fare for the Way2Go Pass program to approximate the average fare per
boarding before the proposed fare changes. The average fare per boarding was calculated
by using an average of the total annual contract values for calendar year 2018 and 2019
and the ridership from FY 2019 (July 2018 through June 2019).
For the users of the pass programs receiving passes through educational institutions and
employers, the average fare paid before introduction of the program, and proposed fare
changes, most aligns with the fare paid by full fare riders. The average fare per boarding
for full fare riders was developed using FY 2019 farebox ridership and estimated monthly
pass usage and transfer data from the SamTrans 2018 Triennial Survey. Adjustments to the
average fare for full fare SamTrans riders were made to reflect the fare changes
implemented in January 2020 that affected full fare riders including the introduction of free
transfers for Clipper and Mobile Ticketing users, decrease in day pass price from $5.50 to
$4.50, and transition from out of SF fares to Express fares ($4.00 to $4.50 for cash fare and
the corresponding increases in Clipper, day pass/transfer upgrade, and monthly pass
pricing). The estimated average fare per boarding by full fare payment method is shown in
Table 5. Attachment 4 includes comparison of the average fare by full fare payment
method to average fare for Way2Go Pass and systemwide average.
Way2Go Pass: Title VI Fare Equity Analysis – Aug. 2021 Page 17721842.1
18 of 54Table 5: Average Fare by Full Fare Payment Method
Full Fare Payment Method Avg. Fare
Local - Cash / Token $2.25
Local - Clipper / Mobile $1.52
Local - Day Pass $1.44
Local - Monthly Pass $0.90
Express - Cash / Token $4.50
Express - Clipper / Mobile $2.97
Express - Monthly Pass $1.78
Full Fare Average $1.51
The average fare per boarding for SamTrans full fare riders is assumed to vary for minority,
non-minority, low-income, and non-low-income riders based on distribution of ridership
among fare payment methods. To create a weighted average fare for each population, the
analysis applied the average fare by fare payment method to the distribution of full fare
riders for a specific population among the available subset of fare payment methods for
full fare riders, see Table 2.
The estimated average fare for before the proposed fare changes is shown in Table 6.
Table 6: Average Fare before Proposed Fare Changes
Non- Low- Non-Low-
Population – Baseline Average Fare Minority Minority Income Income
Residential Complex Users of Way2Go
$3.64
Pass
Passengers Using Passes through
Educational Institutions & Employers - $1.52 $1.51 $1.59 $1.48
Full Fare
The projected average fares after the proposed fare changes were calculated based on
the proposed pass pricing and the projected average number of boardings per user as
shown in Table 7. Given the proposed Way2Go Pass contract minimum, the projected
average fares are assumed to be based on the pass price and not the contract minimum.
In the baseline average fare, one of the participants had fewer than 100 residents and
paid the contract minimum rather than per pass. With the proposed contract minimum,
the cost based on number of users would exceed the contract minimum for this
participant (and consequently this participant as well as other residential pass participants
would experience a contract price decrease due to the decrease in pass price).
Way2Go Pass: Title VI Fare Equity Analysis – Aug. 2021 Page 17721842.1
19 of 54Table 7: Average Fare by Pass Program Category after Proposed Fare Changes
Boardings per
Pass Program Pass Price User Average Fare
Residential Complex $40/year 40.8 $0.98
Educational
$35/semester 29.6 $1.18
Institution
Employer $75/year 48.0 $1.56
The projected average number of boardings per pass obtained through residential
complexes was based on actuals from February 2020 extrapolated for an entire year. For
the passes acquired through educational institutions, the projected average number of
boardings was estimated based on a two-week long Try Transit pilot program in 2019 for
students of the San Mateo County Community College District. For the passes obtained
through employers, the projected average number of boardings was based on findings
from peer agencies’ employer pass programs and literature review.
FARE EQUITY ANALYSIS FINDINGS
The following analyzes whether the proposed fare changes would result in a Disparate
Impact or Disproportionate Burden for any of the three categories of pass users. Based on
the differences in proposed pass price and average fare, each category is analyzed
separately. Sufficient data is not available on how different populations will use their
passes to assume different average fares for protected and non-protected pass users, nor
to combine the data across the three categories of users. Residential complexes are the
only type of organization currently participating of the Way2Go pass program, and
therefore the average fare is based on actual usage. Usage assumptions for the other
categories are based on previous pilot programs and peer agency review, as described
below. The difference in usage assumptions is why the three categories cannot be
analyzed as one.
Users Accessing Way2Go Pass Through Residential Complexes
For those accessing the pass through residential complexes, the average fare per boarding
is expected to decrease 73% as shown in Table 8. The average fare and unit change
amounts shown below are the same for both protected and non-protected users. As
noted in Table 4, the demographics of these pass users are more likely to be minority and
low-income than the system-wide SamTrans ridership.
Table 8: Residential Complexes: Pass Program Average Fare Analysis
Average Fare Unit Change
Before After $ %
Way2GoPass-Residential
Complexes (Protected and
non-protected users) $3.64 $0.98 -$2.66 -73%
Way2Go Pass: Title VI Fare Equity Analysis – Aug. 2021 Page 17721842.1
20 of 54The decrease in pass price brings the average fare for the residential pass more in-line
with the average fare for SamTrans motorbus of $1.38 in FY 2019. Given that participants
pay for all residents five years old and older, and that all three current participants are
affordable housing properties, it is reasonable that the average fare under the proposed
fare changes is lower than the systemwide average fare. The lower average fare also
reflects the use of Clipper START pilot program, which launched in January 2021. This
program allows low-income residents to purchase One Way Clipper fares at 50% discount.
As more riders utilize the Clipper START pilot program, it’s likely the systemwide average
fare for SamTrans will decrease, which will better align with the decreased average fare
for the Way2Go residential pass.
Based on the analysis, all users are uniformly impacted and experience a benefit, as such
the difference in how protected and unprotected populations are impacted is 0%. Thus, it
is concluded that the changes to Way2Go Pass program pricing for residential
complexes would not have a disparate impact on minority users or impose a
disproportionate burden on low-income users based on the District's Title VI Policies.
Users Accessing Way2Go Pass Through Educational Institutions
For those accessing the pass through educational institutions, the average fare per
boarding is expected to decrease between 20% and 26% as shown in Table 9. As noted in
Table 4, the demographics of potential pass users accessing the pass through educational
institutions are projected to be very similar to the system wide SamTrans ridership with a
slightly higher proportion of users having low incomes.
Table 9: Educational Institutions: Pass Program Average Fare Analysis
% Difference
Average Fare Unit Change
between
Protected and
Before After $ %
Non-Protected
Minority User $1.52 $1.18 -$0.34 -22%
0%
Non-Minority User $1.51 $1.18 -$0.33 -22%
Low-Income User $1.59 $1.18 -$0.41 -26%
-6%
Non-Low-Income User $1.48 $1.18 -$0.30 -20%
While minority and non-minority users accessing the pass through educational
institutions would experience a similar decrease in average fare under an expanded
Way2Go Pass program, low-income users would experience a greater decrease in average
fare than non-low-income users. Thus, it is concluded that the educational pass program
pricing would not have a disparate impact on minority users nor impose a
disproportionate burden on low-income users based on the District's Title VI Policies.
Users Accessing Way2Go Pass Through Employers
Way2Go Pass: Title VI Fare Equity Analysis – Aug. 2021 Page 17721842.1
21 of 54For those acquiring passes from their employers, the average fare per boarding is
expected to remain relatively the same with the proposed fare changes as shown in Table
10. Minority and non-minority users are both expected to experience a 3% increase in
average fare. Low-income users are expected to experience a slight decrease of 2% while
non-low-income users are expected to experience a slight increase of 5%. As noted in
Table 4, the demographics of potential employer pass users are projected to be very
different than the system wide SamTrans ridership. Potential users of an employer-
provided pass are expected to be more likely to be non-minority and non-low income
than system wide SamTrans ridership.
Table 10: Employer/ees: Pass Program Average Fare Analysis
Average Fare Unit Change % Difference
between Protected
Employer Pass Program Before After $ % and Non-Protected
Minority User $1.52 $1.56 +$0.04 +3%
0%
Non-Minority User $1.51 $1.56 +$0.05 +3%
Low-Income User $1.59 $1.56 -$0.03 -2%
-7%
Non-Low-Income User $1.48 $1.56 +$0.08 +5%
While minority and non-minority users would both experience a 3% increase in average
fare, low-income users would experience a decrease of 2% in average fare while non-low-
income users would experience an increase of 5%. Thus, it is concluded that the changes
to pass program pricing for employer-provided passes would not have a disparate
impact on minority users nor impose a disproportionate burden on low-income users
based on the District's Title VI Policies.
PUBLIC OUTREACH AND INVOLVEMENT ACTIVITIES
Throughout the study and development of the proposed fare changes, Staff engaged and
received guidance from stakeholders, including Mid-Pen Housing and other non-profit
developers, educational institutions, San Mateo County businesses, and peer transit
agencies. A list of organizations that participated in a stakeholder survey and follow-up
surveys are included in Attachment 5.
This pass is not available for public purchase. Only Bay Area institutions are/are proposed
to be eligible to purchase this pass as a benefit to their residents, employees, or students.
Therefore, outreach was targeted towards institutional stakeholders as directed in
SamTrans Public Participation Plan. Upon approval of the new pricing, District staff will
develop a campaign to inform stakeholders and their constituents of the benefits and
procedures. As per the District's Language Access Plan, this campaign would include
materials in Spanish, Chinese, and other identified stakeholder languages.
Way2Go Pass: Title VI Fare Equity Analysis – Aug. 2021 Page 17721842.1
22 of 54Stakeholder Survey
The stakeholder survey was distributed to determine the needs and desires in a bulk pass
program, and how the Way2Go Pass program can be changed or improved to better fit
the needs of both current and potential future stakeholders. Stakeholders surveyed
included employers, educational institutions, and residential properties.
The stakeholder survey was distributed online via Survey Monkey in November 2020.
District staff reached out to twenty stakeholders, some of which shared with their
constituents/members and networks. Attachment 5 summarizes the stakeholders that
responded to the survey. The stakeholder survey received complete responses from eight
stakeholders.
Follow-up Conversations
Staff reached out to the stakeholders that completed the survey to see if they were
available for a follow-up conversation. Out of the eight stakeholders that completed the
survey, six were available. Staff had follow-up discussions with MidPen Housing, Eden
Housing, San Mateo Community College District, Stanford University, Stanford Health
Care, and Google. After the draft pricing structure was created, staff met with five of the
six stakeholders, from the initial follow-up discussions, to gain additional feedback. Those
five stakeholders included MidPen Housing, Eden Housing, San Mateo Community College
District, Stanford University, and Stanford Health Care.
District Board of Directors
Staff presented the proposed changes to the Way2Go Pass program via a PowerPoint
presentation at the District's July 2021 Board of Directors meeting. Several comments
were made by the directors about decreasing or eliminating the minimum contract
amount. Based on the feedback received, staff will bring back final recommendations for
Board action at the August 2021 Board meeting. The Board meetings are open to the
public and anyone is able to make a public comment. Representatives from MidPen
Housing and Eden Housing both made comments in support of the proposed Way2Go
Pass changes at the July meeting.
Previous Engagement Efforts - SMCCCD Try Transit Program
In 2019, District staff conducted a two-week free pass program for San Mateo County
Community College District (SMCCCD) students called the SMCCCD Try Transit pass
program. Try Transit passes were valid for the period August 14-31. Passes were
distributed on-site at each of the three community colleges campuses during Welcome
Week activities (August 14 and 15), as well as on additional days the following week
(August 19 and 20). Over four days, about 1,700 passes were distributed.
Staff developed a pre-pilot survey that participants were required to complete in order to
receive a Try Transit pass, as well as a post-pilot survey that was distributed electronically
via participant e-mail addresses collected in the pre-pilot survey. Both surveys were
Way2Go Pass: Title VI Fare Equity Analysis – Aug. 2021 Page 17721842.1
23 of 54designed to gather qualitative data including trip-making patterns and habit information
to supplement the pass usage data provided by the program's mag stripe cards. The post-
pilot survey provides the most relevant results to inform the expansion of the Way2Go
Pass to educational institutions.
The post-pilot survey was distributed to the 1,652 people who received passes and shared
their e-mail addresses in the pre-pilot survey. Of respondents to the post-pilot survey, 92
percent said they used their Try Transit pass, while 8 percent did not use the pass. Of the
92 percent who used their pass, 22 percent were trying SamTrans for the first time.
When asked if they would be interested in an unlimited pass for the entire school year, 97
percent said yes. And when asked a follow-up question about whether they would be
willing to add a mandatory transportation fee of less than $20 per semester to fund the
pass, respondents were receptive if the pass was coupled with improvements to the
service provided to the community college campuses. The top requests were more
frequent buses and buses that took less time to make the trip. However, “yes, if”
responses generated selections at just over 50 percent and the post-pilot survey as a
whole represents only a very small sample of the student population.
Way2Go Pass: Title VI Fare Equity Analysis – Aug. 2021 Page 17721842.1
24 of 54ATTACHMENT 1 – SAMTRANS SYSTEM MAP
(Effective August 16, 2020)
Way2Go Pass: Title VI Fare Equity Analysis – Aug. 2021 Page 17721842.1
25 of 54ATTACHMENT 2 –
BOARD APPROVAL OF DISPARATE IMPACT AND
DISPROPORTIONATE BURDEN POLICIES
Way2Go Pass: Title VI Fare Equity Analysis – Aug. 2021 Page 17721842.1
26 of 54Way2Go Pass: Title VI Fare Equity Analysis – Aug. 2021 Page 17721842.1
27 of 54Way2Go Pass: Title VI Fare Equity Analysis – Aug. 2021 Page 17721842.1
28 of 54Way2Go Pass: Title VI Fare Equity Analysis – Aug. 2021 Page 17721842.1
29 of 54Way2Go Pass: Title VI Fare Equity Analysis – Aug. 2021 Page 17721842.1
30 of 54Way2Go Pass: Title VI Fare Equity Analysis – Aug. 2021 Page 17721842.1
31 of 54Way2Go Pass: Title VI Fare Equity Analysis – Aug. 2021 Page 17721842.1
32 of 54Way2Go Pass: Title VI Fare Equity Analysis – Aug. 2021 Page 17721842.1
33 of 54Way2Go Pass: Title VI Fare Equity Analysis – Aug. 2021 Page 17721842.1
34 of 54Way2Go Pass: Title VI Fare Equity Analysis – Aug. 2021 Page 17721842.1
35 of 54Way2Go Pass: Title VI Fare Equity Analysis – Aug. 2021 Page 17721842.1
36 of 54Way2Go Pass: Title VI Fare Equity Analysis – Aug. 2021 Page 17721842.1
37 of 54Way2Go Pass: Title VI Fare Equity Analysis – Aug. 2021 Page 17721842.1
38 of 54Way2Go Pass: Title VI Fare Equity Analysis – Aug. 2021 Page 17721842.1
39 of 54ATTACHMENT 3 – EXISTING FARE CHART AND PROPOSED
FARE STRUCTURE
Existing Fare Chart
Way2Go Pass: Title VI Fare Equity Analysis – Aug. 2021 Page 17721842.1
40 of 54Proposed Fare Structure - August 2021
Way2Go Pass: Title VI Fare Equity Analysis – Aug. 2021 Page 17721842.1
41 of 54Way2Go Pass: Title VI Fare Equity Analysis – Aug. 2021 Page 17721842.1
42 of 54Way2Go Pass: Title VI Fare Equity Analysis – Aug. 2021 Page 17721842.1
43 of 54Way2Go Pass: Title VI Fare Equity Analysis – Aug. 2021 Page 17721842.1
44 of 54Way2Go Pass: Title VI Fare Equity Analysis – Aug. 2021 Page 17721842.1
45 of 54Way2Go Pass: Title VI Fare Equity Analysis – Aug. 2021 Page 17721842.1
46 of 54Way2Go Pass: Title VI Fare Equity Analysis – Aug. 2021 Page 17721842.1
47 of 54Way2Go Pass: Title VI Fare Equity Analysis – Aug. 2021 Page 17721842.1
48 of 54You can also read


