Student Loans Rising An Overview of Causes, Consequences, and Policy Options
←
→
Page content transcription
If your browser does not render page correctly, please read the page content below
May 2014

 Student Loans Rising
 An Overview of Causes, Consequences, and Policy Options

 William Gale, Director, Retirement Security Project, The Brookings Institution
 Benjamin Harris, Deputy Director, Retirement Security, The Brookings Institution
 Bryant Renaud, Research Assistant, Economic Studies, The Brookings Institution
 Katherine Rodihan, Claremont McKenna College

 The authors thank Elizabeth Akers, Matthew Chingos, Donald Marron, and Russ Whitehurst for helpful comments.
 The authors also acknowledge generous research support from the Ford Foundation.
Introduction                                                 The federal government currently offers several types
                                                             of direct student loans. Stafford Loans are the largest
As of 2013, outstanding student loan balances in the         source of federal student loans.2 In 2013, the federal
US exceeded $1.2 trillion, more than any other type          government issued $89.1 billion in Stafford Loans.
of household debt with the exception of mortgages.1          Students who demonstrate financial need are eligible
Following several years of rapid growth in outstanding       for subsidized Stafford loans, in which the federal
loan volumes, student debt burdens have attracted            government pays the interest while the student is in
increased attention in recent years. This policy brief       school, for the six months after graduation, and during
reviews trends, issues, and policy options related to        periods of authorized deferment (for example, military
student loans.                                               service or unemployment). Other students receive
Federal student loans offer several important benefits.      unsubsidized loans and are responsible for all interest
They help students attend institutions of higher             accrued, though payments may be delayed during
education and help families cover or defer the costs of      authorized deferment periods. The interest rate is capped
attendance. However, like other loans, student loans         at 3.86 percent, although Congress has occasionally
need to be repaid, which can strain borrowers’ income        lowered the rate for short periods. Almost half of all
and affect other economic choices. From the outset,          Stafford Loans are subsidized (Edmiston, Brooks, and
we note that isolating the impacts of student loan debt      Shelpelwich 2012). Most students in the program have
is a difficult exercise. Student loan debt represents        taken out a combination of subsidized and unsubsidized
debt undertaken to finance an investment in human            loans (Baum and Ma 2012). The maximum amount a
capital. Simply comparing the financial and economic         student can borrow in Stafford loans in a given year
circumstances of households with and without student         depends on his or her dependency status and year in
debt can be misleading if it does not also account for the   school. The lifetime cap on Stafford loans is $31,000 for
additional earnings capacity produced by the education       dependent undergraduates and $57,000 for independent
that was financed by that debt. Put differently, the key     undergraduates (Smole 2013).
question is how the combination of the debt-financed         PLUS Loans are available to graduate students and
education and student loan debt affect outcomes.             parents of dependent undergraduates. In 2013, the
To date, few studies have been able to measure both          federal government issued $18.9 billion in PLUS loans
aspects of student loan debt, and thus have instead          (Department of Education 2013). The interest rate
focused on either the effects of education or the            on PLUS Loans is 6.41 percent. Borrowers may defer
impacts of student loan debt. In this survey, we focus on    payment until the student leaves school, but are liable for
student loan debt, but the fact that the debt is financing   accruing interest. Borrowers may take out PLUS Loans
additional education should provide important context        up to the full cost of education (tuition, room, and board,
for interpreting the results.                                less other aid awarded).
                                                             Perkins loans are available to students who demonstrate
Background                                                   high need and attend participating institutions. In 2013,
The first federal student loan program was established       the federal government issued $1 billion in Perkins loans.
in 1958, offering direct, low-interest loans to students,    Perkins loans have a fixed interest rate of 5 percent and
and debt cancellation for students who became teachers       interest payments are covered by the government until
after graduation. Guaranteed student loans were              10 months after graduation.
created in 1965 via the Federal Family Education Loan        Borrowers may consolidate student loans for repayment.
Program. Over time, it became clear that the budgetary       Consolidated loans often have longer repayment
presentation of the two types of loans—based on cash         periods and allow borrowers to pay a single interest
flow—distorted the perceived cost relative to the actual     rate, a weighted average of the rates on the loans being
cost and created artificial incentives to offer guaranteed   consolidated. Students may also participate in repayment
loans. In 1990, this disparity was remedied so that, for     plans based on their income.3 The federal government
both direct and guaranteed loans, the budgetary cost         also offers loan forgiveness programs for teachers,
in the year the loan was initiated equaled the expected      public service employees, civil legal assistance attorneys,
subsidy value of the loan. Since then, federal policy has    and “service in areas of national need” (Smole 2013).
shifted strongly toward direct loans. As of 2010, the        Perkins loan recipients can also benefit from partial loan
federal government stopped guaranteeing new loans,           cancellation for each year as a full-time teacher or Peace
although it still honors guarantees made before 2010.        Corp volunteer (Department of Education 2011).

The Brookings Institution                                                              Student Loans Rising           1
Recent Trends that only 16 percent of households in this group have
any student loans, outstanding loan balances are quite
The volume of outstanding student loan debt more
large relative to income. Likewise, among all households
than tripled between 2004 and 2012. During this period
in the next two quintiles, student loans represent 10-12
there was a 70 percent increase in both the number of
percent of income, but only one-fifth or less of those
borrowers and the average outstanding balance per
households have any student debt. Among higher income
borrower (Lee 2013). Fry (2012) documents several
households, student loans are a smaller proportion of
important trends and patterns in student loan debt
income.
holdings, using data from successive cross-sections of
the Survey of Consumer Finances. Consistent with the rise in loans outstanding relative to
income and assets in recent years, delinquencies also
Student loan balances reported by households grew
rose over the last decade. The two-year cohort default
markedly over the past two decades. As shown in Table
rate on federal student loans rose from 5 percent in
1, the overall share of households with student debt
2004 to 9.1 percent in 2010 (Baum and Payea 2012.5
more than doubled from 1989 to 2010, with the share
Likewise, the share of borrowers who were 90 or more
rising slowly from 9 percent in 1989 to 12 percent in
days delinquent was 17 percent in 2012, up from under 10
2001 before jumping to 19 percent by 2010 (Fry 2012).4
percent in 2004, and had risen in every age group over
Although the increase throughout this period is largely
that period (Lee 2013).6
accounted for by increased prevalence of student debt
among households younger than 35, all age groups
showed an increase in likelihood of holding a student Causes of the Increase in Debt
loan between 2001 and 2010. As of 2010, student loans The increase in outstanding student loan debt over
were owed by more than 40 percent of households under the past decade can be attributed to a combination
the age of 35, 25 percent of households between 35 and of several factors. On the demand side, the first is an
44, 18 percent of households between 45 and 54, and increase in college enrollment, which rose by 27 percent
even 10 percent of households aged 55 to 64. The latter from 2002 to 2011.7 The second is an increase in college
groups presumably represent parents or grandparents costs, though this is not as obvious as it might seem.
who have taken out loans on behalf of their children. From 2002 to 2012, inflation-adjusted (2012 dollars)
In addition, between 2001 and 2010, the prevalence of college costs—defined as the sum of room, board and
loans rose significantly in all income groups (especially “net tuition” (tuition costs after subtracting federal,
the 60th to 90th percentiles) and in all educational state, and private [non-loan] aid, as well as any discounts
attainment categories (especially those with some offered by the institution)—rose by 41 percent within
college or who obtained degrees). public four-year institutions, by 9 percent for private
The median student loan debt outstanding, among four-year institutions, and actually fell 7 percent for
households with student loans, has also grown two-year public institutions. Accounting for the number
significantly. Between 1989 and 2001, nominal median of students at each type of institution, average college
outstanding debt rose from about $5,200 to about costs rose by about 16 percent.8 It is unclear how much
$10,000, before rising to about $13,400 in 2010 (Fry of the increase in the cost of attending college is due to
2012). By way of comparison, the consumer price index changes in public support for higher education and how
rose by 76 percent between 1989 and 2010, indicating much due to rising costs of providing higher education.
that the inflation-adjusted median student loan balance Taken together, the combination of 27 percent higher
among households with student loans rose by about 52 enrollment and 16 percent higher costs can explain at
percent over this period. least three-fifths of the 77 percent increase in aggregate
A small share of borrowers carry exceptionally high loan volume from 2002 to 2011.9 Some of the remaining
balances, but most carry relatively low levels of debt. As increase appears to relate to a change in the way
of 2010, about 25 percent of borrowers owed less than students pay for college. In 2000, student loans financed
$6,200 and three quarters owed less than $30,000. At 38 percent of net tuition, fees, room, and board whereas
the high end, 5 percent of borrowers owed $92,800 or loans have grown to finance about 50 percent of net
more, likely either parents financing multiple educations tuition over the last three years (Greenstone and Looney
or professional students in law, medicine, or business 2013). This, in turn, is accounted for by two factors: The
borrowing under the PLUS program. proportion of students who take out loans has increased
over time, and average borrowing per student debt
Student loans have also grown as a share of income. As holder has increased.
shown in Table 2, among all households in the lowest
fifth of the income distribution, outstanding student Others factors may be behind these trends. For example,
loans are about 24 percent of income (Fry 2012). Given there may have been a change in the proportion of
loans going to students at professional schools, where
The Brookings Institution Student Loans Rising 2loan volumes (through the PLUS program) are generally debt. Student debt can also affect students’ mental
larger. Likewise, the financial crisis and Great Recession health; Cooke et al. (2004) find that students in the UK
no doubt played a role in recent years, as family earnings with higher student debt experienced significantly higher
took a hit, which would have increased the demand for rates of stress and anxiety.
debt financing. Other changes to the composition of Student loan debt can influence career choice and post-
students—for example, increases in the enrollment of graduation employment decisions. Akers (2013), using
lower- or middle-income households—could also have exogenous variation in student loan debt levels driven
impacted demand for loans. by student aid formulas, finds that higher student loan
Changes in the supply of loans may have complemented debt causes a higher rate of employment among recently
the rise in demand. In particular, there may now be graduated women and appears to reduce the likelihood of
increased availability of student loans due to changes attending graduate school. Her study finds no evidence,
in the laws protecting creditors or an increase in the though, that student loan debt leads graduates to reject
number of for-profit colleges that may have increased low-paying jobs. In contrast, Rothstein and Rouse (2011)
the relative enrollment of students that have a higher find evidence that student loan debt drives graduates
propensity to borrow (Greenstone and Looney 2013). away from low-paying and public-sector jobs. Specifically,
While it is clear that higher tuition can raise borrowing they find that each $10,000 in student loan debt reduces
amounts, it is also possible that increased borrowing the likelihood that a graduate will find employment
may serve to boost tuition prices. Previous research in the government, non-profit, or education sectors
has established that some portion of various forms of by about 6 percentage points, with especially strong
federal subsidies for higher education— including tax- impacts on graduates taking jobs in education. In another
based higher education incentives (Turner 2010), Pell study, Field (2009) finds that the rate of placements in
Grants (Turner 2012), and federal funding (Cellini and public-interest law are roughly one-third higher when
Goldin 2012) —is passed forward to the schools, either in law students are offered tuition waivers instead of
the form of higher tuition or reductions in other forms loan repayment assistance. Minicozzi (2005) finds that
of aid, but that some of the aid is also passed through student debt is associated with students pursuing jobs
to students in the form of lower costs. These studies that pay higher wages initially, perhaps at the expense
suggest, then, that federal subsidies reduce education of wages in the future. Millet (2003) finds that student
costs. However, we are unaware of any study that loan borrowers are roughly 60 to 70 percent less likely
credibly documents the impact of student loan subsidies to apply to graduate school—after controlling for other
on the price of college. factors—than non-borrowers.
Student debt can also influence homeownership
Economic Effects of Rising Student Loan decisions. The pace of the current housing recovery, for
example, may be influenced by high student loan debt
Burdens among the pool of potential first-time home-buyers,
Rising student debt burdens can affect a variety of who typically account for a large share of overall home
economic outcomes. For those enrolled in school, student purchases (ElBoghdady 2014). High student loan burdens
loan debt may affect completion rates, choice of major, may disqualify students from taking on mortgage debt,
and student performance. Once students graduate, and debt aversion may dissuade student loan holders
student debt can impact career choice and willingness to from purchasing a home even if qualified to do so. Brown
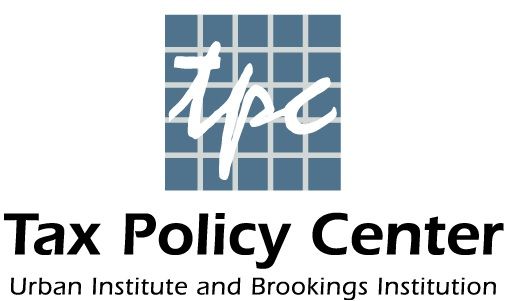
seek a graduate education. Lastly, student loan burdens and Caldwell (2013) show a stark divergence between
can also affect financial decisions later in life, influencing 2003 and 2013 in the credit scores—a key indicator
decisions about home purchase and marriage. of ability to undertake a mortgage—of student loan
An immediate impact of student loan debt can be seen in borrowers and non-borrowers (Figure 1). In 2003, there
the performance of students while still enrolled in higher was essentially no difference between the two groups
education. Rothstein and Rouse (2011) show that student but by 2012, a 30 year-old with student loan debt has
debt has a significant impact on choice of major, pushing an average credit score that is 24 points lower than
some students toward jobs with higher expected wages— one without debt. They also show that over the past
such as those in engineering and economics. Students several years, as credit scores of student debt holders
also widely report that the presence of student debt have declined and as student debt per borrower has
affects their studies. For example, Baum and O’Malley increased, the home ownership rate of 30-year-olds with
(2003) show that 40 percent of students with student student debt has fallen by more than 5 percentage points
loan debt reported that they did not return to school or relative to the home ownership rate for 30-year-olds
transferred to a lower cost school due to student loan without student debt. This is a substantial change, given
The Brookings Institution Student Loans Rising 3that the overall home ownership rate for 30-year-olds the AOTC offers a partially refundable 100 percent
in their sample is below 24 percent. Andrew (2010) finds tax credit on the first $2,000 of qualified educational
that increased student debt in the UK was responsible expenses and an additional 25 percent credit on the next
for part of a decline in homeownership among younger $2,000; thus, the maximum AOTC benefit is $2,500 per
individuals.10 year.
Student debt may also discourage retirement saving, A second strategy for lowering the costs of education
by delaying the initiation of contributions to retirement is to expand and improve the Pell Grant program. Pell
plans, by reducing the level of contributions, or by Grants offer disadvantaged students an award of up
increasing the demand for early withdrawals. Although to $5,645 towards higher education expenses; these
we are aware of no study that explicitly determines a grants are administered through educational institutions
causal relationship in this regard, several studies are and do not need to be repaid. Some have proposed to
suggestive. For example, Cavanagh and Sharpe (2002) expand the size of the maximum award. For example, the
find that installment and credit card debt are negatively President’s 2014 Budget aimed to increase the then-
correlated with the likelihood of retirement saving and, maximum Pell Grant from $5,550 to $5,975 (Department
conditional on saving, the amount of retirement saving of Education 2013). Other proposals aim to improve the
contributions.11 Pell Grant program to better serve beneficiaries and
Student debt can even affect quality and timing of institute incentives for completion. For instance, one
marriage. Gicheva (2011), using instrumental variable proposal aims to provide a $250 completion bonus for
techniques, finds a negative relationship between student receiving an associate’s degree and a $500 completion
debt holding and the probability of marriage for people bonus for receiving a bachelor’s degree (Baum and Scott-
younger than 37. Dew (2008) finds a negative correlation Clayton 2013).
between reduced marital satisfaction and student loan The most prominent class of proposals aimed at easing
debt, positing that increased stress related to consumer the burden of student loan payments are income-based
debt—including student loans—could diminish marital repayment plans. These plans adjust students’ loan
satisfaction. About 14 percent of borrowers surveyed in payments based on their reported income. While the
2002 reported delaying marriage due to student loan current system allows for income-based repayment for
debt, up from 9 percent 15 years earlier. Over the same students with low income relative to their debt, proposed
period, the share of borrowers who reported that they reforms would make income-based repayment the
delayed having children due to student loans jumped default option. In addition, at least some plans would
from 12 percent to 21 percent (Baum and O’Malley 2003). allow for a variable share of income to be devoted to
In summary, there is some evidence showing that student loan repayment. For example, the Loans for Opportunity
loan debt can impact students during and after college. (LEO) program proposed by economist Susan Dynarski
We emphasize that this evidence reflects just one side would shift student loan repayments to employer payroll
of the educational decision, and should be measured systems, and vary repayment rates from 3 percent to 10
against the well-established gains to attending college. percent based on income (Dynarski and Kreisman 2013).
As with the current income-based repayment plan, the
LEO program would forgive any outstanding debt after
Potential Reforms 25 years. A second notable income-based repayment
Given the concerns about student loan debt, several plan was proposed by researchers at the Economic
policy changes have been proposed, generally focusing Opportunity Institute. This plan would absolve students
on one of three goals: reducing the after-tax cost of of debt, but commit them to income-based payments for
tuition; alleviating the debt burden on students, without a discrete period following graduation. Recently, a pilot
necessarily changing the amount of money owed; or program was established in Oregon that would commit
limiting federal support for educational institutions that graduates to pay 3 percent of their salaries over a 24
do not adequately prepare their students for “gainful year period in exchange for tuition.
employment.”
Regarding the third approach, the Obama Administration
Proposals aimed at lowering the after-tax cost of tuition has proposed to address the high student loan burden by
fall into two groups. One strategy is to provide tax credits regulating schools with subpar outcomes for students.
for students and their families. This strategy includes These set of regulations, known as “gainful employment,”
the expansion and transformation of the Hope Tax Credit are aimed at penalizing vocational schools that graduate
into the more generous American Opportunity Tax Credit students into poor employment outcomes; failing
(AOTC). Initially enacted in the stimulus legislation of schools would lose federal funding and eligibility to
2009 and expanded in the fiscal cliff legislation of 2012, administer student loans. Schools would be measured
The Brookings Institution Student Loans Rising 4by whether student loan payments exceed 12 percent of Conclusion
annual earnings or 30 percent of discretionary income
Borrowing to finance higher education has increased
and whether 35 percent of student loan borrowers
markedly over the past two decades. These trends are
are in default of their payments. Under the proposed
associated with a variety of negative economic outcomes
regulations, vocational schools and community colleges
for households who hold the debt, but those outcomes
that do not satisfy at least one of these three criteria in
must be weighed against the net increase in earnings the
three out of four years can lose access to federal funds—
households receive from acquiring more education. A
effectively forcing the institution to close.
variety of policy options exist to reduce the overall debt
The budget impacts of these proposals vary. In general, burden of future students and to adjust repayment plans
policies aimed at reducing the after-tax cost of for those who already hold loans. Given the key role of
tuition would increase the deficit, gainful employment higher education in modern economies, further analysis
regulations would reduce the deficit, and income-based of these issues and options will likely yield important
repayment plans would have ambiguous effects on results.
the deficit. For example, the Administration’s score
of its income-based repayment plan is small, but
commentators have expressed concern that the cost
will be substantially larger. Meanwhile, Dynarski and
Kreisman note that their income-based repayment plan
would reduce the deficit if implemented with some minor
offsets, such as the elimination of the deduction for
student loan interest.
The Brookings Institution Student Loans Rising 5Tables and Figures
Table 1: Percent of Households with
Outstanding Student Debt, 1989, 2001, 2010
1989 2001 2010
Percent of all households 9 12 19
Age of household head
Younger than 35 17 26 40
35-44 11 12 26
45-54 7 11 17
55-64 4 5 9
65 and older 1 0 3
Highest education of
household head
Less than HS diploma 2 3 5
HS graduate 7 8 13
Some college 13 14 26
College graduate 16 17 25
Household annual income
Lowest fifth 8 8 16
Second fifth 8 10 15
Middle fifth 8 14 20
Fourth fifth 12 14 23
90% - 89.9% 8 13 27
Richest 10% 8 11 15
Source: Fry (2012)
The Brookings Institution Student Loans Rising 6Table 2: Outstanding Student Loan Debt Owed
as Share of Household Income and Assets, by
Household Income Group, 2010
Household Income Group, 2010 % of Income
Lowest fifth (less than $21,044) 24
Second fifth ($21,044 – $36,723) 10
Middle fifth ($36,724 – $59,623) 12
Fourth fifth ($59,624 – $97,585) 7
80% – 89.9% ($97,586 – $146,791) 7
Richest 10% (more than $146,792) 2
All Households 6
Source: Fry (2012)
Figure 1: Average Equifax risk scores for borrowers and nonborrowers at ages 25 and 30
660
655
650
No student loan debt at age 30
645
640
With student loan debt at age 30
635
630
With student loan debt at age 25
625
620 No student loan debt at age 25
615
610
2003 2004 2005 2006 2007 2008 2009 2010 2011 2012
Source: Brown and Caldwell (2013)
The Brookings Institution Student Loans Rising 1
7Endnotes 1. The New York Fed notes that “Student loans include loans to finance educational expenses provided by banks, credit unions and other financial institutions as well as federal and state governments” (Federal Reserve Bank of New York 2013). 2. The federal government offers a variety of subsidies and incentives for higher education. Pell grants are the largest federal education grant program, and are given to undergraduates who demonstrate high financial need. The maxi- mum award is $5,645 per year for 2013–2014. For students who need further aid, the Federal Supplemental Educational Opportunity Grant program provides students with between $100 and $4,000. Students may also receive federal grants if they lost a parent to military service in Afghanistan or Iraq or if the student has committed to pursuing a career in elementary or secondary education. Federal work-study programs provide between $100 and $4,000 in subsidized wages for students to work in their communities. In recent years, many federal grant programs and work study have been limited by budget appropriations and rarely provide students with the maximum amount. Additionally, the federal government offers a variety of tax deductions and credits for education expenses, including the American Opportunity Tax Credit, the Lifetime Learning Credit, and deductions for tuition and fees and student loan interest, among others. 3. There are four major repayment plans that are based on income. These plans set monthly payments based on a com- bination of adjusted gross income, poverty guidelines, family size and outstanding loan amounts. For more information, visit http://studentaid.ed.gov/repay-loans/understand/plans. 4. Also, see Akers and Chingos (2014) for a discussion of student loan trends. 5. The rate had been much higher—in excess of 20 percent—in 1989. 6. Student loans can be harder than other types of debt to discharge. See http://www.debt.org/students/bankruptcy/ 7. Snyder and Dillow (2013), Table 240. 8. These calculations are derived from Baum and Ma (2012). The 16 percent increase should be viewed as approximate, however, as it is based on enrollment data for 2000 and 2010 (Figure 19), but cost data for 2002 and 2012 (Figures 9 and 10). The allocation of students across the three types of institutions did not change substantially between 2000 and 2010. 9. That is, 1.27*1.16 = 1.47, so the two factors explain at least a 47 percent increase in borrowing, whereas overall bor- rowing rose by 77 percent. The increase in costs, however, may actually explain more than a 16 percent increase in borrowing for either of two reasons. First, an increase in college costs of a given percentage would cause an increase in borrowing of the same percentage if the sources of college financing—for example, family savings, work-study programs, federal aid and student loans— remain in the same proportion as costs rises. However, if there is a financing hierarchy, and students tend to fund marginal increases in costs with loans, then an increase in college costs of a given percentage would cause an increase in borrowing of a greater percentage. Second, as discussed further below, the increased preva- lence of student loans and aid could itself be a factor driving up college costs. 10. However, not all of the evidence on housing is conclusive. Baum and O’Malley (2003) find no strong pattern be- tween student loan debt and home ownership rates, though they report that earlier studies found results consistent with a $5,000 increase in student loans reducing the likelihood of homeownership by 1 percentage point. Elliott, Grin- stein-Weiss, and Nam (2013) find that in recent years home equity was twice as high for graduates without student loan debt as compared to those with student loan balances; the authors however, find no relationship between higher (non-zero) amounts of student loan debt and home equity. 11. Hiltonsmith (2013) presents calculations suggesting enormous negative effects of student loan debt on lifetime wealth, but the counterfactual is not clear, and, as with other economic effects of student debt, a full analysis would include the positive impact of increased earning capacity owing to debt-financed education. The Brookings Institution Student Loans Rising 8
References

Akers, Beth. 2013. “Excess Sensitivity of Labor Supply and Educational Attainment: Evidence from Variation in Student
Loan Debt.” Working Paper.
Akers, Beth and Matthew Chingos. 2014. “Is a Student Loan Crisis on the Horizon? Understanding Changes in the
Distribution of Student Loan Debt over Time.” Brown Center on Education Policy, Brookings Institution.
Andrew, Mark. 2010. “The Changing Route to Owner Occupation: The Impact of Student Debt.” Housing Studies, 25(1),
39-62. http://www.cassknowledge.co.uk/sites/default/files/article-attachments/432~~andrewmark_student_debt_
housing_studies.pdf.
Baum, Sandy and Marie O’Malley. 2003. “College on Credit: How Borrowers Perceive Their Education Debt.” Journal of
Student Financial Aid, 33(3), Article 1. http://publications.nasfaa.org/jsfa/vol33/iss3/1.
Baum, Sandy and Jennifer Ma. 2012. “Trends in College Pricing 2012.” The College Board.
Baum, Sandy and Kathleen Payea. 2012. “Trends in Student Aid 2012.” The College Board.
Baum, Sandy, and Judith Scott-Clayton. 2013. “Redesigning the Pell Grant Program for the Twenty-First Century.”
Brown, Meta, and Sydnee Caldwell. 2013. “Young Student Loan Borrowers Retreat from Housing and Auto Markets.”
Liberty Street Economics. Federal Reserve Bank of New York, 17 Apr. 2013. http://libertystreeteconomics.newyorkfed.
org/2013/04/young-student-loan-borrowers-retreat-from-housing-and-auto-markets.html.
Cavanagh, Joyce A., and Deanna L. Sharpe. 2002. “The Impact of Debt Levels on Participation in and Level of
Discretionary Retirement Savings.” Association for Financial Counseling and Planning Education. http://www.afcpe.org/
assets/pdf/vol1314.pdf.
Cellini, Stephanie Riegg, and Claudia Goldin. 2012, February. “Does Federal Student Aid Raise Tuition? New Evidence
on For-Profit Colleges.” National Bureau of Economic Research Working Paper No. 17827. http://www.nber.org/papers/
w17827.
Cooke, Richard, Michael Barkham, Kerry Audin, Margaret Bradley, and John Davy. 2004. “Student Debt and its
Relation to Student Mental Health.” Journal of Further and Higher Education, 28(1). http://www.tandfonline.com/doi/
citedby/10.1080/0309877032000161814#tabModule.
Department of Education. 2011. “Student Loans Overview: Fiscal Year 2011 Budget Request.” Washington, DC.
http://www2.ed.gov/about/overview/budget/budget11/justifications/t-loansoverview.pdf.
Department of Education. 2013. “Student Loans Overview: Fiscal Year 2014 Budget Proposal.” Washington, DC.
http://www2.ed.gov/about/overview/budget/budget13/justifications/r-loansoverview.pdf.
Dew, Jeffrey. 2008. “Debt Change and Marital Satisfaction Change in Recently Married Couples*.” Family Relations,
57(1), 60-71. doi:10.1111/j.1741-3729.2007.00483.x
Dynarski, Susan, and Daniel Kreisman. 2013. “Loans for Educational Opportunity: Making Borrowing Work for Today’s
Students.” The Hamilton Project. Discussion Paper. http://www.hamiltonproject.org/files/downloads_and_links/THP_
DynarskiDiscPaper_Final.pdf.
Edmiston, Kelly D., Lara Brooks, and Steven Shelpelwich. 2012. “Student Loans: Overview and Issues (Update).” The
Federal Reseve Bank of Kansas City Research Working Papers. https://www.kansascityfed.org/publicat/reswkpap/pdf/
rwp%2012-05.pdf.
ElBoghdady, Dina. 2014, February 18. “Student Debt May Hurt Housing Recovery by Hampering First-time Buyers.” The
Washington Post. http://www.washingtonpost.com/business/economy/student-debt-may-hurt-housing-recovery-by-
hampering-first-time-buyers/2014/02/17/d90c7c1e-94bf-11e3-83b9-1f024193bb84_story.html.
Elliott, William, Michal Grinstein-Weiss, and Ilsung Nam. 2013. “Does outstanding student debt reduce asset
accumulation?” CSD Working Paper 13-32. St. Louis, MO: Washington University, Center for Social Development.

The Brookings Institution                                                              Student Loans Rising             9
Field, Erica. 2009. “Educational Debt Burden and Career Choice: Evidence from a Financial Aid Experiment at the NYU
Law School.” American Economic Journal Applied Economics, 1(1), 1-21. doi: 10.1257/app.1.1.1.
Fry, Richard. 2012, September 26. “A Record One-in-Five Households Now Owe Student Loan Debt.” Pew Research
Social and Demographic Trends. http://www.pewsocialtrends.org/2012/09/26/a-record-one-in-five-households-now-owe-
student-loan-debt/.
Gicheva, Dora. 2011. “Does the Student-Loan Burden Weigh into the Decision to Start a Family?” University of North
Carolina at Greensboro. http://www.uncg.edu/bae/people/gicheva/Student_loans_marriageMarch11.pdf.
Greenstone, Michael, and Adam Looney. 2013, July 5. “Rising Student Debt Burdens: Factors Behind the Phenomenon.”
The Hamilton Project. http://www.hamiltonproject.org/papers/rising_student_debt_burdens_factors_behind_the_
phenomenon/.
Hiltonsmith, Robert. 2013, August. “At What Cost? How Student Debt Reduces Lifetime Wealth.” http://www.demos.org/
sites/default/files/imce/AtWhatCostFinal.pdf.
Lee, Donghoon. 2013, February 28. “Household Debt and Credit: Student Debt.” Federal Reserve Bank of New York.
http://www.newyorkfed.org/newsevents/mediaadvisory/2013/Lee022813.pdf.
Millett, Catherine. 2003. “How Undergraduate Loan Debt Affects Application and Enrollment in Graduate or First
Professional School.” The Journal of Higher Education, 74(4), 386-427. doi: 10.1353/jhe.2003.0030.
Minicozzi, Alexandra. 2005. “The Short Term Effect of Educational Debt on Job Decisions.” Economics of Education
Review, 24(4), 417-30.
“Quarterly Report on Household Debt and Credit.” 2013, November. Research and Statistics Group. Federal Reserve Bank
of New York.
Rothstein, Jesse, and Cecilia Elena Rouse. 2011. “Constrained after college: Student loans and early-career occupational
choices.” Journal of Public Economics, 95(1), 149-163.
Smole, David P. 2013, June 17. “Federal Student Loans Made Under the Federal Family Education Loan Program and the
William D. Ford Federal Direct Loan Program: Terms and Conditions for Borrowers.” Congressional Research Service.
https://www.fas.org/sgp/crs/misc/R40122.pdf.
Snyder, Tomas D. and Sally A. Dillow. 2013, December. “Digest of Education Statistics 2012.” National Center for
Education Statistics, Institute of Education Sciences, U.S. Department of Education: NCES 2014-015. Washington, DC.
Turner, Nicholas. 2010. “Who Benefits From Student Aid? The Economic Incidence of Tax-Based Federal Student
Aid.” University of California, San Diego: La Jolla CA. Department of Economics. http://www.escholarship.org/uc/
item/7g0888mj.
Turner, Lesley J. 2012. “The Incidence of Student Financial Aid: Evidence from the Pell Grant Program.” Unpublished
manuscript. http://www.columbia.edu/~ljt2110/LTurner_JMP.pdf.

.
.
.

The Brookings Institution                                                                Student Loans Rising          10
You can also read