Coronabonds with or without Germany - WID.world ISSUE BRIEF N 2020/02 - World Inequality Lab - World Inequality ...
←
→
Page content transcription
If your browser does not render page correctly, please read the page content below
WID.world ISSUE BRIEF N° 2020/02

Coronabonds with or without Germany

            Lucas Chancel
              April 2020

         World Inequality Lab

                                      1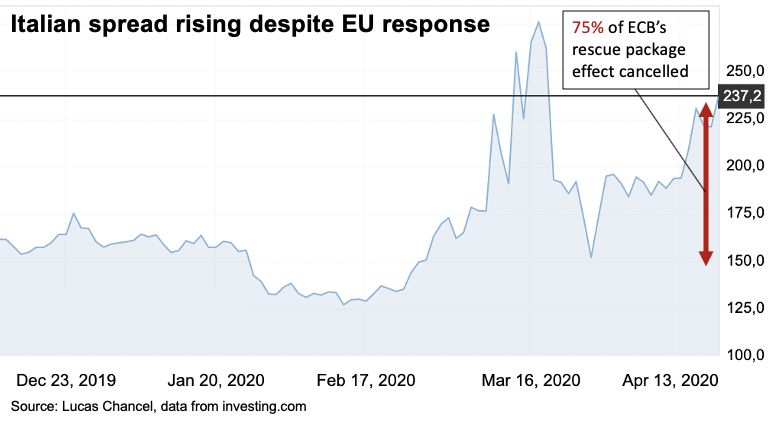
Coronabonds with or without Germany

                                   Lucas Chancel
                          Co-Director, World Inequality Lab
                             Paris School of Economics

                                  First publication:
                                   18 April 2020

                                    This version:
                                    11 May 2020

This paper explores the rationale and feasibility of debt mutualization among
Eurozone countries (e.g. France, Italy, Spain, and Belgium) with the possibility that
all Eurozone countries participate (including Germany and the Netherlands), but which
could also work effectively without German and Dutch support. It describes practical
steps in this direction, with the creation of a European Solidarity Treasury Agency
emitting a new debt (or “Special Purpose Vehicle”) called “Coronabonds-1”. The debt
issued would represent approximately 5% of participating countries’ GDP in 2020 (or
€250 billion in the case of France, Italy, Spain and Belgium). The paper proposes a
debt repayment scheme via a novel European Solidarity Tax on Corporate Profits,
which would also be effective should only a subset of Eurozone countries adopt it and
which could reimburse the debt issued in 2020 in 4-5 years. The corporate tax would
incentivize non-participatory countries to join the initiative.

   1. The recession to come could be the largest in a century or more. Europe’s
      response does not rise to the challenge.

The world is facing an immense and unprecedented crisis. Once the public health crisis
is over, nations face an economic downturn that could shatter their economies. The
latest IMF forecasts estimate that the “Great Lockdown”, i.e. the economic crisis
stemming from responses to the coronavirus, will lead to a GDP contract of 3%
worldwide, which is thirty times worse than the 2009 global recession. Unlike 2009,
neither China nor the emerging economies that have also been hit by the virus cannot
play a significant buffer role.

The Euro area is expected to contract by 7.5 % in 2020 (-7% in Germany, -7.2% in
France, -9.1% in Italy, -8% in Spain, see Table 1). In comparison, the 2009 crisis led
to a 4% drop in GDP in the Euro area.

                                                                                    2
All forecasts agree on one thing: this recession may be the largest one experienced
during peacetime in a century or more. To put things in perspective, in 1929 incomes
fell by approximately 10% in the US and Germany. They fell by 10% again in both the
second and third year following the crash (Figure 1). The magnitude of the “Great
Lockdown” is comparable to the shock caused by the 1929 crisis in these countries.
Table 1. GDP growth forecasts during the “Great Lockdown”
Real GDP, annual % change
2019 2020 (forecast)
World Output 2.9 -3
Advanced Economies 1.7 -6.1
United States 2.3 -5.9
Euro Area 1.2 -7.5
incl. Germany 0.6 -7
incl. France 1.3 -7.2
incl. Italy 0.3 -9.1
incl. Spain 2 -8
Japan 0.7 -5.2
United Kingdom 1.4 -6.5
Canada 1.6 -6.3
Other Advanced Economies 1.7 -4.6
Source: Author, based on IMF(2020)
World output is expected to decline by 3% in 2020.
Figure 1. Growth during the “Great Depression”
Income per capita in rich countries, 1929-1939
120%
(% 1929 income, inflation adjusted)
110%
Income per capita
100%
90%
80%
70%
60%
1929 1930 1931 1932 1933 1934 1935 1936 1937 1938 1939
US DE GB FR
Source: Author, based on WID.world (2020).
In 1930, income per capita dropped by 10% in the US and Germany.
The severity of the crisis among major economies will prompt them to run substantial
deficits in an attempt to assist their economies under lock down. Deficits are likely to
be of the order of 10%–or more—this year in countries that are the most affected.
32. The ECB March rescue package was historical but largely insufficient.
One of the major risks facing the European Union in the context of this crisis is the
implosion of the Eurozone (namely Austria, Belgium, Cyprus, Estonia, Finland, France,
Germany, Greece, Ireland, Italy, Latvia, Lithuania, Luxembourg, Malta, The
Netherlands, Portugal, Slovakia, Slovenia, and Spain). The Eurozone implosion would
probably spell the end of the European project as we know it today.
The risks faced by a monetary union without fiscal and budget integration have been
amply discussed over the past decade, in the wake of the 2009-2012 sovereign debt
crisis. An indicator of the level of tension faced by the Eurozone is the spread (i.e. the
difference in the yield of two countries) between the yield of Eurozone countries’
sovereign bonds and the German sovereign bond (Bund) yield. When the spread
becomes too large, the stability of the Eurozone is jeopardized: it may be in a country’s
best interest to exit the single currency area to regain monetary independence in order
to deal with the crisis via monetary (and fiscal and budgetary) means.
In order to limit the risks of Eurozone implosion, the European Central Bank (ECB) first
announced, on March 12, 2020, an extension of its “Asset Purchase Program” (APP).
Before the Coronavirus crisis, the ECB used to purchase € 20 billion per month (€ 240
billion per year) of public and private debts, intervening on markets to bring down
interest rates. An additional envelope of € 120 billion was agreed (bringing the total
APP envelope to €360 billion for 2020). This measure was probably undersized and
was accompanied by an announcement by ECB’s director Christine Lagarde (i.e. that
the ECB’s role was not to close spreads), which contributed to fuel market uncertainty.
Less than a week later, on March 18, the ECB announced another package, dubbed
“Temporary Pandemic Emergency Purchase Program” (or PEPP), covering both
private and public sector securities as well. The Program had an immediate and
substantial impact on Eurozone countries’ 10-year interest yields (i.e. the bonds
emitted by governments and to be repaid within 10 years, see Figure 2 below). Italian
and Spanish bond yields had indeed risen significantly (multiplied by a factor 3 to 6)
after the outbreak of Covid-19 in these countries. As a result of the PEPP, Italian and
Spanish spreads dropped significantly (from 320 points to 188 points in a day and from
146 points to 84 points in a few days for the Italian and Spanish spreads, respectively).
French and German bond yields, negative before the crisis (i.e. investors accept a
negative return on their investments), increased in early March but also decreased
significantly after the ECB’s 18th March announcements.
However, over the past weeks, Spanish and Italian yields have been on the rise again,
while the German (and French) yield remained stable overall, driving spreads upward.
The current value of the spread between the Italian bond and the German one (around
230 points) remains below the values recorded at the peak of the European Sovereign
Debt crisis of 2012 (around 400 points). However, it is likely that these 2012 levels
could be reached if the current dynamics are prolonged.
Given the exceptional nature of this crisis, it is extremely difficult, if not impossible, to
argue that rising spreads are the result of bad decisions and a lack of compliance with
European Union rules by Southern countries prior to the crisis, an argument largely put
4forward by opponents to debt mutualization in 2012. As a result, it is possible to argue
that everything should be done in order to limit such spreads via monetary, but also,
budgetary and fiscal means.
3. The lack of agreement on Coronabonds has already erased more than 75%
of the impact of the ECB’s rescue package.
On April 9, 2020 European leaders agreed on a € 500 billion rescue package. Under
the leadership of the ECB, the negotiations for this rescue package moved faster and
with more strength than those of the 2009-2012 crisis. While there are several positive
aspects of this rescue package (including the possibility for the European Solidarity
Mechanism to intervene by purchasing bonds of Eurozone countries), this intervention
proved insufficient. In particular, EU leaders failed to agree on partial debt
mutualization (or “coronabonds”), which would be limited to spending related to
coronavirus measures. This option, which would immediately stop the rise of spreads
and reduce borrowing costs for Southern European countries, has received support
from at least 10 countries (including France, Italy, Spain, Belgium, Ireland,
Luxembourg, Portugal, Greece, Slovenia) out of 19 in the Eurozone, representing the
vast majority (60%) of the blocks’ GDP. However, the Netherlands and Germany, in
particular, have up to now opposed such a proposal.
What have been the consequences of this failure to agree on Coronabonds? Focusing
on the effect of the ECB’s response on Italian and Spanish yields described in the
previous section, it appears that 75% of the effect has already been wiped out (Figure
2). Similar values are obtained for Spain.
Figure 2. Italian Spread rising despite European Union response.
Source: Author, data from www.investing.com
Italian 10y bond vs. German Bund spread is 237 on April 21, 2020.
There at least two other, less mediatized and more technical, but also telling indicators
of perceived market risks which deserve particular attention. The first one is the spread
between Italian Credit Default Swaps issued on 2014 ISDA standards (i.e. Credit
Default Swaps or CDS are insurances against asset defaulting turned into tradeable
financial assets) and CDS issued on ISDA 2003 standards. While CDS ISDA 2014
5cover against the risk of an Italian Eurozone exit, CDS ISDA 2003 do not. Although
information from CDS markets should be scrutinized critically and with prudence, the
spread between the two instruments can be seen as an indication of perceived market
risk of default on Italian debt (or more precisely on the risk premium associated to an
Italian default). This indicator also indicates that ECB and Eurogroup’ measures have
not been sufficient to reassure financial markets.1 The other indicator is the first
derivative (or slope) of the gap between 10 years and 2 years interest rates on the
Italian debt. This indicator hit its lowest level since the 2012 crisis, revealing a
particularly worrying short-term defiance against Italian debt. The indicator worsened
after Eurogroup’s meeting.
Support in favor of debt mutualization to avoid the risk of Eurozone implosion seems
to be growing among European voters. Recent polls suggest that German voters’
support for coronabonds is stronger than support for no debt mutualization and a
resulting Italexit. More precisely, when told about the risk of Italexit, 48% of German
voters support Coronabonds vs. 35% of voters refusing them and preferring Italexit
(see Baccaro et al., 20202).
However, German and Dutch governments remain opposed to Coronabonds, even in
the context of a mostly asymmetric and stochastic shock (some countries are more
affected than others and this is largely out of bad luck). How to explain this opposition?
Are Dutch and German leaders optimistic about bond yields in Italy and Spain, unlike
other European leaders ? To what extent do short-term national politics interfere with
European solidarity matters? Are leaders opposed to Coronabonds unaware of the
risks of an implosion in the block brought on by a new sovereign debt crisis? Do they
believe that Southern countries, such as Italy and Spain, are too attached to the Euro
to leave the block? Or, do they believe that implosion would be better than a (limited)
amount of fiscal solidarity in times of unprecedented crisis?
As these questions remain unanswered, the risk of political or economic implosion is
real. Below, we sketch a plan to reduce this risk via partial debt mutualization without
German (and Dutch) support if necessary, but leaving space open for these countries
to join the group if and when they want to do so.
4. How can a few countries mutualize their debt?
Eurozone countries do not need to wait for unanimous support to mutualize debt.
Below are steps that could be taken in order to move forward.
1. Assume France, Spain, Italy and Belgium decide to mutualize interest rates on
any debt related to the payment of Covid-19 sanitary and economic response.
The proposal can be extended to any country willing to join the group, as
discussed below. To clarify: in the first version of this plan, the debt is not
mutualized, it is the interest on the debt that is. Countries continue to repay
the debt they contract, but do not face exorbitant borrowing costs (i.e.
exorbitant yields) if the market bets against them, thanks to the fact that they
now issue common debt and face a common interest rate. In case they decide
1
See for instance Gros (2018).
2
Study conducted by the Max Plank Institute on 1004 individuals.
6to do so, these countries could also decide to gradually mutualize the interest
rate on their entire stock of debt, as discussed below.
2. An intergovernmental “European Solidarity Treaty” is signed between the four
countries, which establishes a special agency (called here the “European
Solidarity Treasury Agency”). The Agency is co-directed by the current directors
of the France, Italy, Spain and Belgium treasuries (the agencies responsible for
issuing sovereign debt for the countries). The work of the agency can be
supervised by an ad-hoc parliamentary body (see section 5), composed of
members of the parliaments of each country in proportion to their population
size.3 Nothing in EU law would prevent these countries from pooling their debt
nor establishing such an agency4.
3. The sole role of the Agency is to create a Special Purpose Vehicle (SPV), similar
to the European Financial Stability Facility.5 The SPV is guaranteed by the four
countries and limited to the pandemic response. We call these bonds
Coronabonds-1. In the first (and emergency) version of this plan, only
Coronabonds-1 are mutually guaranteed. The rest (and vast majority) of the
debt of each country remains out of the scheme. This cannot be changed by the
Agency. The mutualization is limited to new debt issued to face the pandemic
and is to be repaid by each country in proportion to the debt they accrued. The
agreement can be subsequently revised via an agreement between the three
parties.
4. The European Solidarity Treasury Agency emits € 250 billion of Coronabonds-
1 in 2020. In practice this means close to €100 billion debt issued by France in
2020 under this scheme, €75 billion issued by Italy, €60 billion issued by Spain
and €20 billion issued by Belgium. For Italy, considering that current annual mid-
term debt emissions are approximately €250 billion, the issuance of €75 billion
of debt under this mutualized scheme would lower its own emissions by close
to a quarter, which is far from significant. This would already have a significant
downward effect on the spreads on non-mutualized Italian debt emissions.
3
See also the « Treaty for the Democratization of Europe » (www.tdem.eu) for more details on how
such an assembly could function and be organized.
4
Note that DG ECFIN already has a trading room which emits debt for the EU. It could be argued that
a Solidarity Treasury Agency would therefore compete with existing EU institutions. If this was actually
the case, the Intergovernmental Treaty could be challenged by the Court of Justice of the EU on the
grounds of competing prerogatives. However, such a legal argument is likely to be easily refuted by
the countries signing the Treaty on the grounds that (i) the existing trading room has very abilities to
emit debt, (ii) it cannot emit the amounts of debt discussed under this plan and (iii) cannot give back
the debt Member States enabling them to substantially reduce their borrowing costs. The Treasury
Agency here proposed therefore does not compete with existing EU institutions, but is a clear
complement to them, being different in institutional design, scope and economic policy implications.
5
See https://www.esm.europa.eu/efsf-overview. SPV are usually created to solve targeted, and
temporary, problems. In the context of the Eurozone debt crisis, they had the interest of relatively easy
to set up and get running.
7Table 2. Population, national income and Coronabonds-1 emissions in 2020
Population Population National Income National Income Coronabonds-1
(million) (% of total) (billion PPP €) (% of total) emissions (€ billion)
France 66.5 36% 1956 39% 98
Italy 61.0 33% 1493 30% 75
Spain 46.4 25% 1163 23% 58
Belgium 11.5 6% 376 8% 19
All 4 countries 185.4 100% 4988 100% 250
Source: Author, based on WID.world (2020). Population and national income data for 2018.
Under the new Special Purpose Vehicle “Coronabonds-1”, Italy would issue €75 billion of debt in 2020.
5. Effectively, the yield on Coronabonds-1 would lower Italian bond interest rates
and probably the Spanish bond as well, as the risk premium on this debt would
decrease. Congruently, it would halt the rise of spreads. The interest rate for
French and Belgian borrowers would slightly increase. By how much? This
depends on a mix of factors, including the credit rating of the institution/vehicle
issuing the debt, the existence of a dedicated debt repayment mechanism, the
level of guarantee offered by participating countries on the debt, the maturity of
the debt, as well as political factors that we discuss (briefly) below.
6. Currently, the Italian yield on 10-year bonds is 1.82%, the Spanish yield is
0.82%, the Belgian yield is 0.11% and the French yield is 0.04%. Pooling current
yields weighted by each country’s GDP would give an interest rate of 0.75% (on
April 16), which corresponds more or less to the average yield on France’s 10-
year bond between 2017-2019. This can be considered an upper bound
estimate of the yield on Coronabonds-16.
a. The yield on debt issuance could probably be significantly reduced if the
four countries agreed on a viable joint mechanism by which to repay the
debt (as we do in section 5 below), i.e. a tax which acts as a clear signal
that countries will be able to repay the debt.
b. The yield could be further reduced if the Special Purpose Vehicle is co-
guaranteed by each Member State: each participant guarantees 100%
of its “own” share of the debt (or more, e.g. 150% to 200% of this value,
as is currently the case with the European Financial Stability Facility).
Over-guarantee ensured that the EFSF kept a double-A credit rating and,
hence, can borrow at very low interest rates.
c. The debt could be issued on a relatively short maturity (i.e. a 2 to 10 year,
rather than 10 to 30-year maturity), further reducing the interest rate.
d. More technical options can also be thought of to further reduce the yields.
Issuing “Green Bonds” (for instance to target support to sectors of the
6
Another benchmark could be the dynamics of interest rate on the debt issued under European
Stability Mechanism.
8sustainable economy currently in distress) could increase demand for the
bonds.
e. The newly issued debt could also be eligible for European Central Bank
Quantitative Easing or repurchasing activities, with potentially significant
impacts on the credit rating of the Special Purpose Vehicle. Pools of
countries are already eligible to ECB QE. This is the case of the Nordic
Investment Bank, which only benefits Scandinavian countries. It would
be paradoxical if a pool of Eurozone countries were not.
f. A further possibility to reduce the yields would be that governments
encourage their citizens through national campaigns to purchase
Coronabonds-1, increasing demand for the debt and reducing rates.
g. Overall, the combination of these options suggests that France, Italy,
Spain and Belgium, alone, without Germany, could already benefit from
relatively good interest rates on a jointly issued debt. Further modeling
should be done to estimate the interest rate of such a debt, but a 0.5%
interest rate on such mutualized bonds may be a reasonable first
approximation.
7. With the above approximation in mind, one can provide a first order estimation
of the cost induced to a country like France, which would see its interest rate
increase? Assuming that France emits €50 billion of Coronabonds-1 at 0.5%
via the new SPV, repayable in 5 years, the additional charge on debt would be
approximately €2.5 billion per year (0.1% GDP) and €12.5 billion overall after
five years. All else equal and assuming that France emits €100 billion on the
first year, we can approximate the cost to be 0.2% GDP per year and for 5 years.
At the same time, France’s current charge on its debt (around €40 billion per
year) would probably be reduced as France would emit less via its regular debt
emission schemes, bringing down the net overall cost of Coronabonds-1
issuance for France. The 0.1-0.2% GDP per year over 5 years figure is therefore
a probable upper bound and has to be balanced with the cost of a Single Market
disintegration for a country like France (the cost would probably be of the order
of several GDP percentage points). The cost should also be balanced with the
benefits of a debt repayment scheme such as the one proposed in part 5 (which
would raise more than 1% of GDP, an order of magnitude more than the cost
here estimated).
8. This mechanism is open to all other European countries (Germany, Ireland,
Portugal, Luxembourg, Greece, etc.) who would also enter the governing
structure of the European Solidarity Treasury Agency (and the ad-hoc
parliamentary body supervising it). If and when all Eurozone countries join the
group, the scheme can become codified into European Union law.
9. Nothing in the current EU treaties prevents countries from establishing such an
agency even absent the support of all Eurozone countries. The issuance of
Coronabonds-1 and the establishment of an ad-hoc governance structure are
prerogatives of sovereign Member States. It is important to remember that the
most prominent institutions and regulations established by the Member States
9to face the 2012 Sovereign Debt Crisis were initially developed in parallel to
European Union law, before being absorbed into it.7
5. How to pay for Coronabonds?
Issuing bonds will not be sufficient to solve the current crisis. The issuance of partially
mutualized debt buys time, but the key economic and political question is how to repay
this debt. Coupling a clear and sound plan to pay for coronavirus related expenses
with the issue of mutualized bonds is also a good way to reduce borrowing costs. Many
options are on the table and are being discussed (including debt monetization and
progressive taxation):
o Debt monetization (i.e. the purchase of debt by the European Central Bank,
via perpetual loans for instance) has many advantages but also limitations. Debt
monetization can take the form of a perpetual (i.e. non-repayable) debt by the
Central Bank towards States. Perpetual loans can also be issued directly to
enterprises and/or households (in which case it amounts to what has been
termed “helicopter money”). This solution (whether perpetual loans to States or
to households, or a combination of both) should ideally be part of the package
of answers to reduce debt levels associated to the current crisis and to pre-2020
debt levels in European countries. However, debt monetization cannot be the
sole answer to the current crisis. First, it places a lot of importance in the hands
of an actor that is currently (and to some extent will always be) outside of proper
democratic control. Another difficulty is that such a solution requires an
amendment to the Treaty governing the functioning of the Central Bank and
hence the support of all Eurozone countries. France, Italy, Spain and Belgium
couldn’t move forward with such a plan without Germany. While changing the
treaty is not impossible, as the 2012 debt crisis has demonstrated, it seems
unlikely at this stage that all crisis response could be dealt with through debt
monetization. Another counter argument put forward by certain voices is that
debt issuance to citizens would be costly because of intermediation costs. So
far however, to our knowledge there hasn’t been any sound and transparent
evaluation of the costs that would be associated to this intermediation. Finally,
after some point, debt monetization can trigger inflation8. Inflation has also
been a policy option used to repay debts throughout history. However, inflation
is blind: it might erode assets of wealthy individuals, but it can also impact small
wealth owners as well as individuals at the bottom of the social ladder, whose
incomes are not indexed on inflation. In short, inflation can have undesirable
impacts on social justice.
o An alternative proposal to debt monetization proposed by certain market
analysts is to reinvest maturing debt issued in the context of the PEPP for a very
long period, for e.g. 15 or 30 years. This has the interest of being feasible in the
context of European Treaties (it has already been done in the context of the
7
See in particular the “Pringle” decision of the European Court of Justice on November 2012. The ECJ
found that the treaty establishing the European Stability Mechanism had not violated EU law. In
particular, the case admits that an intergovernmental treaty between European Member States does not
violate EU law if it does not deal with exclusive EU powers. This wouldn’t be the case in our proposal.
8
Of course, in the current context, deflation seems to be a much greater risk than inflation.
10Securities Market Program) but is probably not sufficient to fully ease perceive
market risks given the amount of det to be emitted in order address the
economic and sanitary crisis.
Figure 3. Debt reduction in France and Germany, 1945-1953
Source: World Inequality Report 2018, see Alvaredo et al. (2018) section 5
o Debt restructuring (i.e. extend the maturity of the debt, that is the duration of
full repayments) is also an option. This has been done several times over the
past decades, in the context of the Greek debt but also and more importantly in
the context of the German debt (it was indeed decided at the London
Conference of 1953 that German war debt repayments would be postponed
until German reunification - with no debt indexation mechanism, meaning that
inflation de facto cancelled most of the German debt). In the current context, a
common agreement to restructure European debts would reduce interest rates
for countries emitting new debt. The main limitation is it requires the agreement
of all parties (including Germany).
o Debt cancellation (i.e. Member States agree that a certain part of their current
debt, or agree in the future that a certain part of coronavirus debt, will simply not
be repaid). While this solution has been used several times throughout
European history (and largely to the benefit of Germany, see above), it may also
pose economic risks for banks and Member States who purchased this debt. In
short, debt cancellation for a small country (like Greece) poses little risk to the
future financing of the rest of the European economy. However, substantial debt
cancellation in Italy, Spain, France or Germany would place a significant level
of stress on the central banks of these countries, and on the economy as a
whole. The issuance of perpetual debt by the ECB to refinance or purchase past
or current Member States’ debt would probably be the best way to “cancel” debt
without placing such a stress on the financial system, but as discussed above,
perpetual debt issuance cannot be the sole answer to the current crisis.
o Austerity (i.e. Member States reduce government expenditures to repay this
debt). Austerity measures have been implemented throughout Europe after the
112009-2012 crisis. There is growing recognition that this policy worsened the
crisis instead of improving it.
o Taxation (i.e. Member States levy new taxes to repay for the debt). The limit of
this approach is that taxes can impact the economic behavior of taxpayers. If
taxes are raised on lower and middle-income groups, or small businesses, this
can fuel the recession by placing more economic stress on these actors. Taxes
can instead be progressive and target economic actors who have the resources
to contribute more to coronavirus related investments and expenditures. This
solution has also been used throughout history, in particular after the economic
shocks of the first and second world wars as well as the 1929 crisis (see Figure
3).
There is no silver bullet to pay for Coronavirus crisis induced costs. A mix of debt
monetization and possibly debt restructuring should be part of that mix. We argue
below that progressive taxation should certainly be part of the package of solutions,
and yet it has attracted limited attention so far.
As Member States are about to largely intervene in their economies to support
corporate actors, with partial unemployment payments, loan guarantees and other
mechanisms, it is legitimate that, in return, businesses contribute to the financing of
Coronavirus crisis related expenses and to the functioning of European welfare
systems. With this in mind, we propose a new European solidarity tax on
multinational corporate profits. This scheme can also be complemented by other
progressive taxes (including a tax on wealth and top incomes).9
1. Assume France, Italy, Spain, and Belgium want to establish a European
solidarity tax on multinational corporate profits.
2. In the “European Solidarity Treaty” establishing a new debt issuance Agency
(see section 4), the parties agree on the establishment of a joint Parliamentary
Assembly. The parliamentary body is composed of the members of Parliament
of the four countries, in strict proportion to their population (e.g. 36 French MPs,
33 Italian MPs, 26 Spanish MPs, and 6 Belgian MPs out of 100 MPs, see table
2). The parliament can meet digitally if needed.
3. The Parliamentary Assembly is given the power to implement a tax on the profits
of multinational companies, in order to pay off the costs of the health and
economic crisis response packages. In the first preliminary version of this plan,
the powers of the assembly are strictly limited to the profit tax. Those powers
can be extended (see www.tdem.eu for a more elaborate version of the powers
that such a parliament could have).
4. In the current proposal, France, Italy, Spain, and Belgium, via the newly
established assembly, could decide to tax multinational corporate profits at
30%. This rate would apply to multinationals registered at home and on the
9
See for instance Landais, Saez and Zucman (2020) who propose a tax on top 1% wealth owners in
Europe as well as www.tdem.eu (Bouju et al., 2019) which describes, how to implement top income
and top wealth taxes in the EU, on top of a corporate tax,
12profits of all foreign multinationals selling on their territory (as a proportion of
sales made in the country or on the basis of artificially shifted profits10). France’s
corporate tax rate on companies is currently set to 28% since January 1, 2020,
down from 33% in 2017 and from 50% in 1986. Italy’s corporate tax is currently
set at 24%, down from 31% in 2016 and from 53% in 1997. Spain’s corporate
tax rate is currently set at 25%, down from 30% and 35% in 2014 and 2006,
respectively. Belgium’s statutory corporate tax rate is 28%, down from 48% in
the late 1980s. In that respect, France, Italy, Spain, and Belgium followed the
general trend in EU countries (Figure 4) to lower corporate taxation. At the
same time, most EU countries increased VAT taxes, which are regressive and
impact low-income households most.
10
See Torslov et al. (2020) for definitions and computations of artificially shifted profits as well as
Appendix Tables 1 and 2 which provide estimations of tax revenues if all artificially shifted profits were
repatriated (i.e. territorialized). See also Zucman (2018) for a discussion on different apportionment
options.
13Figure 4. Top corporate tax rate in the EU vs. VAT tax rate, 1980-2018
55 22
Average Standard Consumption Tax rate (%)
50
Average Top Corporate Tax rate (%)
21
45
20
40
35
19
30
18
25
20 17
1980 1985 1990 1995 2000 2005 2010 2015
Top Corporate Tax rate Standard VAT rate
Source: Author based on Blanchet, Chancel and Gethin (2019)
In 1980, the average top corporate tax rate in the European Union was close to 50%.
5. A 30% effective tax on all multinational corporate profits would raise funds
equivalent to approximately 1.5% of GDP in France, Italy, Spain and Belgium
(See Appendix Table 1).11 This would be enough to repay a 5% GDP deficit (or
the equivalent of €250 billion coronabonds emitted under the scheme here
proposed) in 3-4 years, and a GDP deficit of 10% in 6-7 years, without
increasing taxes paid by small enterprises and individuals.12
6. The principle is simple: a euro taxed by a country accrues to the treasury of that
country. In the first version of the plan, there are no joint investments. This can
be reviewed if and when countries agree to do so.
7. This plan is compatible with European single market rules: countries have the
right to tax corporate profits at the level they decide. Foreign countries would
not be discriminated against because, in the case of foreign multinationals
operating in, say, France, it is only the difference between the foreign tax rate
and the French tax rate that would be taxed. For example, the German effective
corporate profit tax is around 12% today (while the German statutory tax rate,
which combines federal and regional rates, is 30%). Profits of German
multinationals would be taxed at the difference between the effective tax rate
and the new common solidarity tax rate, i.e. 18% (30%-12%), on profits
effectively realized in France/Italy/Spain/Belgium.
11
An effective corporate tax of 30% would generate 1.6% of GDP in the four countries considered,
assuming that artificially shifted profits are repatriated to their country of origin (see Appendix Table 1).
Note that the loss incurred by Belgium from profits repatriated to France, Italy or Spain would be largely
compensated by the increase in the corporate tax rate (see Table 2). More precisely, Belgium would
gain around 2.7 billion, or approx. +0.6% GDP, net of losses incurred by the end of profit shifting. Note
that France would obtain 0.8% GDP in additional revenues with a 30% minimum corporate tax rate on
all profits and 1.5% with a 37% tax rate.
12
We assume here that coronavirus debt is 10% of the GDP of each country in 2020.
148. If Germany decides to join the initiative, Germany would also collect the
additional tax and could use it to finance its own public services or reduce taxes
on other categories of German taxpayers (eg. working and middle class
households). This mechanism therefore also acts as an incentive for Germany
to enter the European Solidarity Treaty.
9. In the case of a country like the Netherlands, a tax on territorial multinational
corporate profits implemented by France, Italy, Spain and Belgium would also
have a strong impact on its national tax revenues, as companies currently
shifting profits from these countries to the Netherlands to benefit from lower
corporate tax rates would lose most of their incentives to do so. However, the
loss incurred by the Netherlands would be more than compensated by the
increase in local corporate tax rate (See Appendix Table 1)
Conclusion
This paper outlined the rationale and the way forward for a small group of European
countries to group together and issue Coronabonds bonds without waiting for the
support of all Eurozone countries. This proposal can be extended to any country willing
to join the group.
A new European Solidarity Treasury Agency is proposed, in charge of issuing €250
billion Coronabonds-1 in 2020. We show that debt mutualization would have positive
impacts on yields and has the potential to put an end to rising spreads between
Southern and Northern European countries.
The brief demonstrates how the establishment of a tax on multinational corporate
profits would repay the totality of bonds issued in 2020 in 3-4 years and could
reimburse a 10% deficit in GDP within a 6-7 year period. Indeed, other progressive
taxes can be added (including a tax on high wealth and income earners), as well as
other monetary response mechanisms, further reducing repayment periods.
A tax on territorial multinational corporate profits would also act as a political and
economic incentive for countries such as the Netherlands (EU’s largest tax haven) or
Germany (EU’s largest exporter) to join the initiative in order to recover tax revenues
that would accrue to France, Italy, Spain and Belgium if Germany or the Netherlands
remained out of the group.
Bottom line: European Treaties do not prevent the willing EU Member States from
mutualizing their debt or from raising new taxes on multinationals (or high wealth
individuals). This initiative could contribute to a snowball effect, where more countries
join in after a time. On the other hand, the failure to take action could also contribute
to an opposite snowball effect, risking the disintegration of the European single market
and of the European project as a whole.
Questions & comments: lucas.chancel@wid.world
References
15Alvaredo, A., Chancel, L., Piketty, T., Saez, E., Zucman, G., (2018), World Inequality
Report 2018, Harvard University Press (accessible on wir2018.wid.world)
Baccaro, L., Bremer, B., Neimanns, E., “Everyone thinks that Germans oppose
‘coronabonds.’ Our research shows how they’re wrong”. Washington Post, April 20,
2020
Blanchet, T., Chancel, L. and Gethin, A. (2019) Has the European social model
withstood the rise in inequalities?, WID.world Policy Brief 2019/2 accessible on
www.wid.world/europe2019
Bouju, M., Chancel, L., Delatte, A-L., Hennette, S., Piketty, T., Sacriste, G., Vauchez,
A., (2019) Treaty for the Democratization of Europe, accessible on www.tdem.eu
Gros, D. (2018) Italian risk spreads: Fiscal versus redenomination, VoxEu.org,
accessible on https://voxeu.org/article/italian-risk-spreads-fiscal-versus-
redenomination-risk
IMF (2020) World Economic Outlook, April 2020, accessible on
https://www.imf.org/en/Publications/WEO/Issues/2020/04/14/weo-april-2020
Landais, C. Saez, E. and Zucman, G. (2020) A progressive European wealth tax to
fund the European COVID response, VoxEu.org, accessible on
https://voxeu.org/article/progressive-european-wealth-tax-fund-european-covid-
response
Tørsløv, T., Wier, L., Zucman, G. (2020) The missing Profits of Nations, Working
Paper and dataset accessible on https://missingprofits.world/
WID.world (2020). World Inequality Database accessible on www.wid.world
Zucman, G. (2018) Taxing multinational corporations in the 21st century, EconFip
Policy Brief, accessible on https://econfip.org/wp-content/uploads/2019/02/10.Taxing-
Multinational-Corporations-in-the-21st-Century.pdf
16Appendix Table 1A. Estimated impact of a Solidarity Tax on Corporate Profits in France, Italy,
Spain and Belgium
Total Total tax Effective Marginal corp.
Total Total Tax Total
artificially base corp. tax tax rate Additional corp. tax revenue of a
reported corporate revenues effective
GDP shifted without rate on compensating 30% effective tax rate on all corp.
corporate tax from profit corp. tax
corporate profit foreign end of profit profits
profits revenues shifting rate
profits shifiting profits shifting
[1] [2] [3] [4] [5] [6] [7]=[5]/[2] [8] [9]=[6]/[4] [10] = (0.3-[7])*[2]-0.3*[3] [11] = [10]]/[1]
(2016 EUR billion) (%) (2016 EUR billion) (% GDP)
Belgium 423.4 71.3 13.7 57.6 14.6 2.3 20% 17% 4.0% 2.7 0.6%
France 2221.8 180.5 -32.5 212.9 45.2 -10.8 25% 25% -5.1% 18.7 0.8%
Italy 1684.7 223.9 -21.6 245.5 36.0 -6.8 16% 16% -2.8% 37.7 2.2%
Spain 1115.3 160.1 -13.3 173.4 25.0 -3.3 16% 16% -1.9% 27.0 2.4%
All 4 countries 5445.1 635.8 -53.7 689.4 120.8 -18.6 19% 20% -2.7% 86.0 1.6%
Source: Author, based on data from Tørsløv, Wier and Zucman (2020) [Appendix Tables U1, C4 and C4d]. All values for 2016.
USD values converted to 2016 EUR using a 1.11 market exchange rate. See Tørsløv et al. (2020) for methodology and detailed
notes. See Tørsløv et al. (2020) for methodology and detailed notes.
Appendix Table 2. Corporate profits and taxes in rich countries
Total Total tax Effective Marginal corp.
Total Tax Total
artificially base Total corp. tax tax rate Additional corp. tax revenue of a
reported revenues effective
GDP shifted without corporate rate on compensating 30% effective tax rate on all corp.
corporate from profit corp. tax
corporate profit tax revenues foreign end of profit profits
profits shifting rate
profits shifiting profits shifting
[1] [2] [3] [4] [5] [6] [7]=[5]/[2] [8] [9]=[6]/[4] [10] = (0.3-[7])*[2]-0.3*[3] [11] = [10]]/[1]
(2016 EUR billion) (%) (2016 EUR billion) (% GDP)
EU countries
Austria 355.1 44.7 -4.3 49.0 8.4 -1.0 19% 19% -2% 6.3 1.8%
Belgium 423.4 71.3 13.7 57.6 14.6 2.3 20% 17% 4% 2.7 0.6%
Czech Republic 175.8 31.2 -2.0 33.2 6.6 -0.4 21% 16% -1% 3.4 1.9%
Denmark 281.1 46.9 -4.0 50.9 7.4 -0.9 16% 16% -2% 7.8 2.8%
Estonia 21.6 4.0 -0.3 4.2 0.4 -0.1 9% 9% -1% 0.9 4.2%
Finland 215.5 25.6 -2.9 28.6 4.8 -0.6 19% 13% -2% 3.8 1.8%
France 2221.8 180.5 -32.5 212.9 45.2 -10.8 25% 25% -5% 18.7 0.8%
Germany 3150.1 527.3 -59.0 586.2 61.7 -17.5 12% 12% -3% 114.1 3.6%
Greece 175.9 21.0 -1.5 22.5 4.4 -0.4 21% 18% -2% 2.4 1.4%
Hungary 113.5 18.0 -3.3 21.3 2.7 -0.6 15% 4% -3% 3.7 3.3%
Iceland 18.6 2.3 -0.5 2.8 0.5 -0.1 21% 21% -3% 0.4 1.9%
Ireland 272.0 161.7 105.5 56.2 7.3 6.9 5% 7% 12% 9.5 3.5%
Italy 1684.7 223.9 -21.6 245.5 36.0 -6.8 16% 16% -3% 37.7 2.2%
Latvia 25.0 3.7 -0.2 3.9 0.4 0.0 12% 5% -1% 0.7 3.0%
Luxembourg 53.1 82.9 45.2 37.8 2.5 7.7 3% 6% 20% 8.9 16.7%
Netherlands 706.2 186.3 90.3 96.0 23.6 7.0 13% 9% 7% 16.6 2.4%
Poland 425.1 70.8 -3.8 74.6 7.8 -0.7 11% 11% -1% 14.6 3.4%
Portugal 185.9 25.0 -2.9 27.9 5.7 -0.6 23% 23% -2% 2.7 1.5%
Slovak Republic 81.0 10.5 -0.8 11.3 2.8 -0.2 27% 27% -1% 0.6 0.7%
Slovenia 40.2 3.4 -0.1 3.6 0.6 0.0 19% 19% -1% 0.4 1.1%
Spain 1115.3 160.1 -13.3 173.4 25.0 -3.3 16% 16% -2% 27.0 2.4%
Sweden 461.4 56.5 -9.3 65.7 12.7 -2.0 22% 18% -3% 7.0 1.5%
Other European
Iceland 18.6 2.3 -0.5 2.8 0.5 -0.1 21% 21% -3% 0.4 1.9%
Norway 334.5 60.1 -5.6 65.7 13.4 -1.4 22% 22% -2% 6.3 1.9%
Switzerland 603.8 81.4 65.9 15.4 18.9 5.3 23% 8% 34% -14.3 -2.4%
United Kingdom 2404.6 367.5 -72.6 440.2 65.0 -14.5 18% 18% -3% 67.0 2.8%
Other Rich
Australia 1142.2 153.9 -15.2 169.1 53.7 -4.1 35% 35% -2% -3.0 -0.3%
Canada 1378.6 123.6 -13.7 137.3 47.6 -3.6 38% 25% -3% -6.4 -0.5%
Japan 4438.4 604.1 -10.7 614.8 163.8 -3.3 27% 23% -1% 20.7 0.5%
United States 16853.3 1623.1 -137.1 1760.2 331.4 -54.9 20% 20% -3% 196.6 1.2%
Source: Author, based on data from Tørsløv, Wier and Zucman (2020) [Appendix Tables U1, C4 and C4d]. All values for 2016.
USD values converted to 2016 EUR using a 1.11 market exchange rate. See Tørsløv et al. (2020) for methodology and detailed
notes.
17You can also read