EconPol POLICY REPORT 26 2020 - ifo Institut
←
→
Page content transcription
If your browser does not render page correctly, please read the page content below
EconPol                                                                                  26
                                                                                       2020
POLICY REPORT                                                                           October
                                                                                          Vol. 4

 World Economy: What Does
 the Road to Recovery from
 COVID-19 Look Like?
 Expert Survey on Worldwide
 Effects of the Pandemic
 Dorine Boumans, Pauliina Sandqvist and Stefan Sauer (EconPol Europe, ifo Institute)
headed by

                           KOF Konjunkturforschungsstelle
                           KOF Swiss Economic Institute

EconPol POLICY REPORT
A publication of EconPol Europe
European Network of Economic and Fiscal Policy Research

Publisher and distributor: ifo Institute
Poschingerstr. 5, 81679 Munich, Germany
Telephone +49 89 9224-0, Telefax +49 89 9224-1462, email Dolls@ifo.de
Editors: Mathias Dolls, Clemens Fuest
Reproduction permitted only if source is stated and copy is sent to the ifo Institute.

EconPol Europe: www.econpol.eu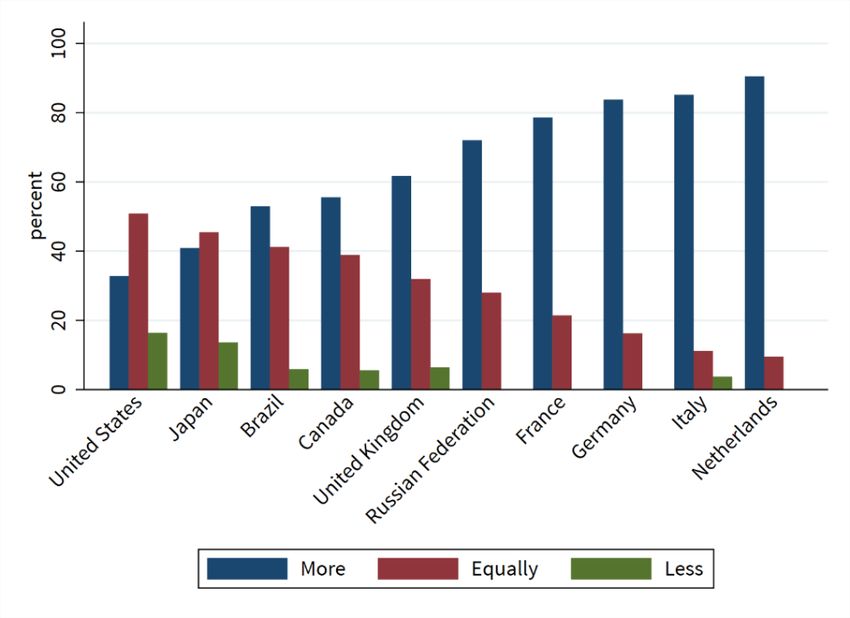
World Economy: What Does the Road to Recovery from
                                    COVID-19 Look Like?
                       Expert Survey on World-Wide Effects of the Pandemic
                       Dorine Boumans, Pauliina Sandqvist and Stefan Sauer 1

The outbreak of COVID-19 has had a detrimental effect on global health care systems, with
a ripple effect on every aspect of human life as we know it. On January 30, 2020 the World
Health Organisation declared COVID-19 as a global emergency (WHO, 2020). In response, to
“flatten the curve”, governments have enforced border shutdowns, travel restrictions, and
general lockdowns with numerous social distancing measures such as closed schools,
shops, services and, to a lesser extent, the manufacturing industry. This in turn led to an
impending economic crisis and recession all around the globe. The IMF World Economic
Outlook of June 2020 projects global growth at -4.9 percent in 2020 (IMF, 2020a).

After more than six months of coronavirus being part of our life, most economies have
opened up again, although with certain restrictions against the spread of the virus. As the
economy and our daily life return to a “new-normal”, the possibility of a second wave leaves
lots of uncertainty about future developments.

To understand indications about the impact of the COVID-19 pandemic on economic
performance in different countries across the world, we conducted a survey among 950
economic experts in 110 countries between August 12th and 29th, 2020. 2 The survey builds

A
    EconPol Europe, ifo Institute; Poschingerstr. 5, 81679 München, Germany. Email: boumans@ifo.de, sand-
qvist@ifo.de, sauer@ifo.de. We would like to thank Jette Anderson and Mathijs Toonen for research assistance
as well as Jasmin Nothhaft and Sigrid Zengel for technical support.
2
    The survey was conducted among the panel of the ifo World Economic Survey. In selecting participants for
     the survey, emphasis is placed on their professional competence in economic matters and inside
     knowledge of their reporting countries. This is guaranteed by screening their education and current affilia-
     tion as well as place of residence. See (Boumans and Garnitz, 2019) for further details. More studies have
     used the supplementary question for further research cf. Boumans et al., 2018 and Boumans et al., 2020a.
                                                         1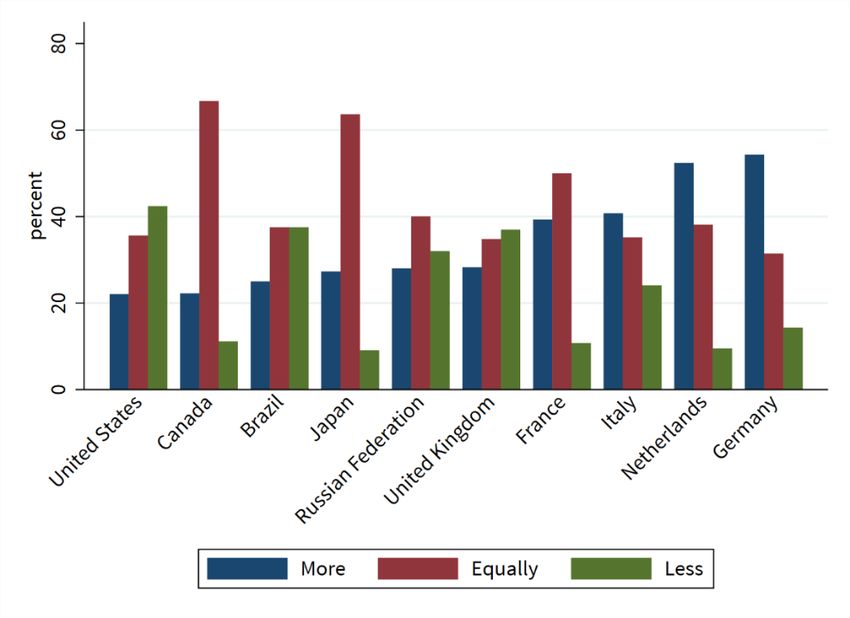
on a previous survey conducted in April. Back then, economic experts forecasted GDP to be
negative in 2020 almost everywhere around the world with only experts in emerging and
developing Asia to have reported on average a positive GDP forecast (Boumans et al.,
2020b). Most experts had expected the COVID-19 induced economic recovery to last at least
until 2022.

The second wave of the survey will take a closer look at how the recovery is expected to look
in different countries, whether sufficient fiscal stimulus packages were introduced and
which policy measures are most suitable to help the economy. Moreover, short- and long-
term impacts of COVID-19 on companies were surveyed. Finally, experts were asked about
the second wave preparedness of their country.

This report gives an overview of the most important results of the survey and compares
them in different world regions and countries. An extra focus is placed on the European
Union’s strategy to combat the crisis and how experts from member states assess the
different policy measures.

How hard did the recession hit and what is recovery expected to look like?
The swift and massive shock of the coronavirus pandemic and shutdown measures to
contain it have plunged the global economy into a severe contraction. Global output
collapsed in the first half of 2020 and almost all countries fell into recession. Following the
easing of confinement measures and the initial re-opening of businesses, economic activity
started to pick up again, but the pace of the global recovery has lost some momentum over
the summer months.

Global GDP growth for 2020 is currently projected by the IMF at -4.9% (IMF, 2020a). For 2021,
the IMF World Outlook forecasts global growth at 5.4 percent. Overall, this would leave 2021
GDP 6.5 percentage points lower than in the pre-COVID-19 projections of January 2020. We
asked the economic experts to give the expectations of GDP growth in their country in 2020
and 2021 divided into their ‘most likely’ guess as well as best- and worst-case expectations.

                                              2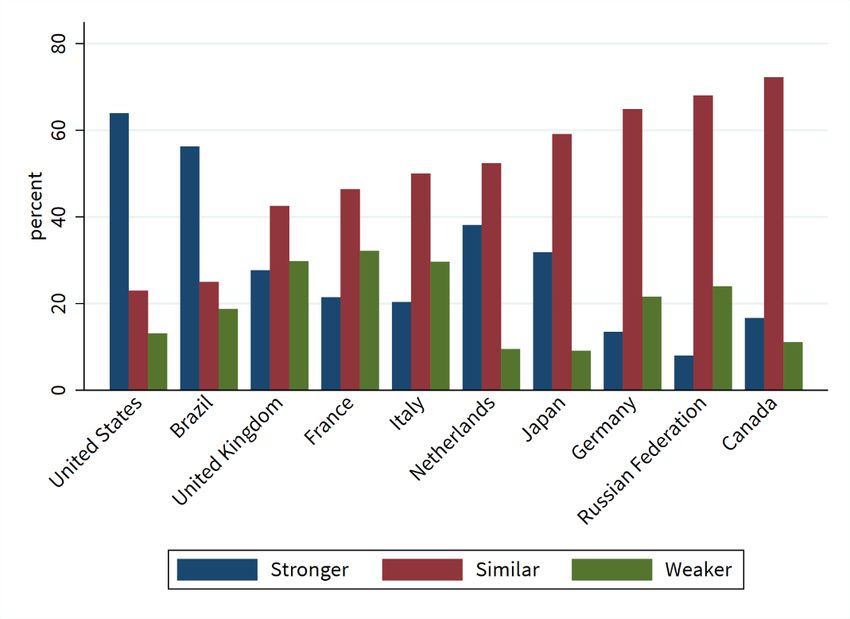
The results confirm the considerable recession in most countries (Table 1). China is one of
the few countries that is expected to still grow in 2020 (+2.3%) but by a lot less than forecasts
had projected before the crisis. Weighting the country-specific forecasts by GDP, the most
likely expectations of the surveyed experts would result in a decrease of global GDP by -4.4%
this year. Hence, the annual growth rate is expected to be around 8 percentage points below
the pre-crisis forecast of the IMF in January that expected world GDP to grow at a rate of
+3.3% in 2020 (IMF, 2020b).

In the Euro area experts have, on the aggregate level, the most negative growth
expectations for GDP (-8.9%) with negative growth rates in every member state. In Spain
(-13.6%), Italy (-10.5%), and Portugal (-10.5%) even a double-digit negative growth is
expected to be likely. Another country with double-digit negative growth expectations is the
United Kingdom (-10,0%) where the economy is also affected by the high uncertainties
caused by Brexit. U.S. experts project GDP of their economy this year to decrease at 6.5%.

The average best-case and worst-case expectations for the GDP in 2020 shown in Table 1
make the currently very high uncertainty clear even with two quarters already covered by
official statistics. Especially with the rising risk of a second wave of the pandemic that could
go along with another lockdown the worst-case GDP expectations in many countries are
much more negative than the most likely expectations.

The experts’ expectations for 2021 predict positive GDP growth for all countries catching up
some of the decrease of 2020. Nevertheless, these expected positive growth rates are not as
high as the expected negative rates for 2020.

                                                3
Table 1: Expected Growth of GDP in 2020 and 2021
Most likely Best-case Worst-case Most likely
GDP 2020 GDP 2020 GDP 2020 GDP 2021
World Economy -4.4% -2.2% -7.5% 3.2%
European Union -8.4% -5.8% -11.8% 3.2%
Euro area -8.9% -6.4% -12.1% 3.6%
Germany -7.1% -4.7% -9.8% 2.9%
France -8.7% -6.7% -12.7% 5.4%
Italy -10.5% -8.0% -13.7% 3.7%
Spain -13.6% -9.9% -18.0% 3.4%
Netherlands -6.2% -4.2% -9.0% 3.0%
Greece -8.9% -6.3% -11.7% 4.4%
United Kingdom -10.0% -6.2% -14.7% 2.8%
USA -6.5% -2.7% -12.1% 2.7%
Other advanced economies -6.4% -4.1% -10.4% 1.7%
Japan -6.8% -4.5% -11.5% 0.4%
Canada -6.1% -3.5% -9.0% 2.9%
Russia -5.5% -4.0% -7.6% 1.6%
Emerging and developing Asia -0.4% 1.0% -2.2% 4.3%
China 2.3% 3.0% 0.6% 6.3%
India -5.3% -2.4% -7.5% 0.4%
Latin America -7.9% -5.8% -10.5% 1.9%
Brazil -6.1% -4.7% -8.0% 2.8%
Sub-Saharan Africa -4.2% -0.8% -6.8% 2.2%
South Africa -9.3% -5.8% -14.9% 1.7%
Note: On the aggregated levels country results are weighted according to 2017 PPP-adjusted
GDP as reported by the IMF.
There is also a lot of uncertainty about how and when GDP will go back to pre-crisis levels.
The experts’ expectations about the duration of the recovery period therefore differ
considerably (Table 2). Looking at all respondents jointly, more than one third of the experts
(36.4%) expect real GDP to be back to pre-crisis level in 2022. 19.4% of the experts expect
full recovery in 2023, while 24.4% are more optimistic and expect GDP to catch up pre-crisis
levels in 2021 (Q1-Q2 2021: 6.3%; Q3-Q4: 18.1%), and 15.7% even expect it to happen later
than 2023. For all country groups in Table 2 except Africa, 2022 is the year most expect GDP
to catch up to pre-crisis level. The same can also be seen on a country level. Within the
4member countries of the European Union, only Italian experts are even more pessimistic,
with 31% expecting full recovery for 2023 and 35% even later.
Table 2: Expectation of real GDP catching up to pre-crisis levels
1st half of 2nd half later than
in 2022 in 2023
2021 of 2021 2023
European Union 4.3% 16.1% 38.0% 22.1% 16.1%
USA 6.3% 25.4% 38.1% 9.5% 14.3%
Other advanced economies 8.7% 20.2% 36.5% 15.4% 15.4%
CIS 7.4% 18.5% 46.3% 20.4% 5.6%
Emerging and developing Asia 12.5% 20.8% 35.4% 12.5% 14.6%
Latin America 8.2% 15.3% 35.3% 21.2% 17.6%
Africa 7.9% 21.1% 21.1% 18.4% 22.4%
Total 6.3% 18.1% 36.4% 19.3% 15.7%
Note: Own calculations based on survey answers. Missing percentages to 100% are shares for answers
“Already back to potential output in Q2 2020”, “Q3-Q4 2020”, “Never”, and “No crisis experienced”.
This slow recovery would result in most experts’ opinion in a U-shaped recession (42% of all
experts) with a sharp and persistent decline or a so-called Nike swoosh-shaped recession
(31%) with a sharp temporary decline followed by a slow recovery. Only 6% of all experts
expect a V-shaped recession for their country, with a strong temporary decline followed by
a strong recovery. On the other hand, 21% of the experts even see a double-dip recession
(W-shaped) as most likely in their country. In the United Kingdom this was the most
answered option (40%), with 37% of the U.S. experts also fearing a second decline of GDP.
Furthermore, the experts were asked if they expect the corona crisis to have an effect on the
potential GDP of their country. In most countries, experts assume that the current crisis does
affect the potential GDP (Table 3). The opinions of how this effect looks differ across the
countries. In Germany, most experts (66%) expect a level shift (the GDP potential is shifted
downwards due to deterioration of production possibilities like, for example, insolvencies)
as well as in the Netherlands (57%), Austria (54%), and the United States (54%). In Southern
European countries, the level and growth effect the most likely scenario. This means, that
besides the level effect, the future potential growth rate is also assumed to be weaker. Also
in the United Kingdom and in Brazil most experts expect impact on both level and growth
5rate of potential GDP. All in all, these results indicate that the corona crisis is expected to
have permanent effects on economic developments in many countries.
Table 3: Expectation of effects on potential GDP for selected countries
Level Growth Level and
No effect
effect effect growth effect
Brazil 0% 35% 0% 65%
France 7% 31% 10% 52%
Germany 11% 67% 0% 22%
Italy 4% 37% 2% 57%
Japan 9% 27% 5% 59%
Netherlands 0% 57% 10% 33%
Russian Federation 8% 44% 0% 48%
Spain 8% 18% 11% 63%
United Kingdom 11% 37% 4% 48%
United States 16% 55% 2% 27%
Policy responses: What is suitable to help the economy?
Governments and policy institutions responded in many ways beyond quarantine measures
to limit the human and economic impact of the COVID-19 pandemic. A policy tracker
database by the IMF continuously collects the key economic responses in 196 economies
(IMF, 2020c), particularly the different fiscal stimulus packages announced and
implemented in most countries. To name a few, the United States passed a bill to spend an
estimated US$2.3 trillion (around 11% of GDP) to provide emergency assistance and health
care response for individuals, families, and businesses affected by the pandemic (“CARES
Act”). An additional US$483 billion are invested in the Paycheck Protection Program and
Health Care Enhancement Act, which includes loans and grants for small businesses as well
as money for hospitals. China’s fiscal policy responses of an estimated RMB 4.6 trillion (or
4.5 percent of GDP) focus on increased spending on epidemic prevention and control,
production of medical equipment, accelerated disbursement of unemployment insurance
as well as tax relief, waived social security contributions, and public investment. In Australia,
fiscal stimulus, consisting of expenditure and revenue measures worth A$180.9 billion (9.5
percent of GDP), has been put in place through the fiscal year 2023-24, the majority of which
will be executed through the fiscal year 2020-21. Measures include sizable JobKeeper wage
6subsidies (5.4 percent of GDP), income support to households, cash flow support to
businesses, investment incentives, and targeted measures for affected regions and
industries. At the EU-level, several plans to help the economy of the member states were
proposed and partly already implemented. These measures are discussed in detail in a
following segment of this report.
The economic experts were asked if there was a fiscal stimulus package due to the crisis in
their country and if it is sufficient, too large or if more still needs to be done. Figure 1 shows
what the experts in selected countries think about the fiscal stimulus packages in their
country. In the Netherlands (55%), Brazil (50%), Germany (50%), and France (46%) the
highest share of experts assesses the fiscal stimulus packages as sufficient. On the other
hand, the U.S. and Russian experts mainly think that there still needs a lot more to be done.
In countries including the United Kingdom, Japan and Italy, the experts are not so negative
about the stimulus packages but also state that somewhat more can be done to help the
economy. Canadian experts have the most variation in their judgement of the stimulus
package: while more than half of them state that much or somewhat more should be done,
one seventh think that the existing package is too large.
Figure 1: Assessments of fiscal stimulus packages per country
7Table 4: Which policy responses are assessed as suitable by country groups
Sub-Saharan Africa
Em. and dev. Asia
Other advanced
Latin America
economies
MENA
Total
USA
CIS
EU
Emergency liquidity assistance to small
5.0 5.1 5.4 4.9 4.7 4.7 4.8 4.3 4.6
businesses
Improvement of the health care system 4.8 4.8 5.2 4.2 4.9 4.8 5.0 4.7 4.8
Temporary tax deferrals for businesses 4.4 4.6 3.4 4.3 4.6 4.2 4.6 3.9 4.2
Short-time work 4.3 4.5 4.0 4.1 3.7 3.7 4.7 4.0 3.8
Extra child care provisions 4.2 4.1 4.7 4.2 4.7 3.7 4.4 3.9 4.5
Emergency liquidity assistance to larger
4.0 4.2 3.8 4.0 3.3 3.8 4.0 3.6 3.6
businesses
Asset purchasing of private and public
3.7 3.9 4.5 3.6 2.4 3.1 3.4 2.6 3.3
securities by the central banks
Interest rates cuts 3.6 3.1 4.5 3.6 4.0 4.6 4.8 3.9 4.5
Temporary sales tax cuts 3.4 3.4 2.7 2.9 3.5 4.1 3.6 3.8 3.8
Permanent tax cuts 2.9 3.0 2.0 2.3 3.1 3.3 2.9 3.3 3.4
Helicopter money 2.8 2.6 3.7 2.6 2.8 2.7 3.2 3.4 2.9
Note: Answers are an average calculated on a scale from 1 to 6, where 6 is most suitable.
Strikingly, the economic experts perceive some policy responses to be far more suitable
than others (see Table 4). Among these measures, emergency liquidity assistance to small
businesses is perceived as the most effective policy response to help the economy (overall
rated at 5.0 on a scale between 1 and 6). It is noteworthy that experts in the European Union,
the USA and other developed economies rate this option highest, while experts in less
developed economies including emerging and developing Asia, Latin America and Africa
think improvements to the health care system should have the highest priority.
Moreover, experts on average perceive temporary tax deferrals for businesses (4.4), short-
time work (4.3), and extra child care provisions (4.2) as a good policy measure in most
country groups, except for the USA where experts are clearly less convinced about
temporary tax deferrals (3.4). Emergency liquidity assistance to larger businesses (4.0) are
also rated as important but clearly less than for smaller businesses.
8Other policy responses are on average rated as less effective but with quite some variation
between country groups. While, for example, the average effectiveness of asset purchasing
of private and public securities by the central banks is below 4 in all other regions, U.S.
experts assign an average score of 4.5 indicating that this measure receives relatively more
popularity in the USA. On the other hand, temporary sales tax cuts do not convince the U.S.
experts at all. The answers on permanent tax cuts show the same picture with somewhat
lower averages. The use of helicopter money has the lowest average and is in average below
3 in most groups. In the USA, where helicopter money was given to the citizens to mitigate
the financial consequences, experts rated that measure as slightly more positive (3.7).
On the country level, there are a few more noticeable differences. German experts, for
example, rate short-time work with an average of 5.8 as by far the most suitable. German
companies are making use of short-time work more than ever to soften losses in demand
and production and to keep their workforce in the company at least for the time being.
According to estimations of the ifo Institute in May 2020, 7.3 million people (21.8% of all
employees) were on short-time work (Link and Sauer, 2020). In September the number
decreased, but 3.7 million people – the equivalent of one in nine employees in Germany -
was on short-time work. Experts from other countries where short-time work is
implemented, including Austria (5.6), Sweden (5.5), and Switzerland (5.3), also rated this
instrument in average as very suitable. On the other hand, experts from countries without
short-time work like the United States (4.0), Russia (3.8), and Japan (3.7) are not convinced
it would make sense as a policy measure in their country.
Experts from countries that were hit the hardest by COVID-19 cases and deaths rated
improvements to the health care system as more important than the average to help the
economy. Among others, experts from Sweden (5.4), Russia (5.3), Italy (5.3), USA (5.2), and
the United Kingdom (5.0) have an average rating of at least 5.
European Union policy responses
The European Commission agreed on a three-pillar solidarity package, granting a total of
540 billion EUR to the sectors health care, short-term work, and small and medium sized
companies. The first pillar, pandemic crisis support through the European Stability
9Mechanism (ESM), aims at supporting domestic financing of indirect and direct health care
such as further prevention related costs caused by the COVID-19 pandemic. It is based on
the already existing Enhanced Conditions Credit Line (ECCL) and encompasses a scope of
240 billion EUR. The second pillar, Support to Mitigate Unemployment Risks in an
emergency (SURE), is a dedicated credit line targeting the financing of short-term work and
protecting self-employed against possible income shortages or losses. Based on the legal
base of Article 122 TFEU, the measure was approved by the European Council on May 15th,
2020. The instrument, described as a ‘temporary loan-based vehicle based on member
states’ guarantees’, aims to provide loans of up to 100 billion EUR for member states to
compensate for large amounts of public expenditure for employment preservation during
the crisis (Tesche, 2020, p.9). The EU will repay a maximum of 10% of its debt annually. While
perceived as a good starting point, critics fear that the financial scope will be too small, and
the maturities covered too short (Bénassy-Quéré et al., 2020). The third pillar, financial
support to small and medium sized companies (SMEs) through the European Investment
Bank (EIB), is a credit guarantee of expected 200 billion EUR, funded by EU member states
pro rata to their shareholding in EIB and other institutions. At least 65% of this financing is
foreseen for financing SMEs, 28% of loans are determined for non-SMEs and up to 7%
additionally can be dedicated to growth capital. The package is comprised of dedicated
guarantee schemes, dedicated liquidity lines and dedicated asset-backed securities (ABS)
purchasing programs. On 21 July, after negotiating at a four-day summit, EU leaders
reached an agreement on the EUR 750 billion plan to reconstruct the regions most affected
by the economic shock caused by the pandemic. The Recovery Fund, also known as Next
Generation EU, involves the Commission borrowing 750 billion EUR in the financial markets.
About 390 billion EUR of this amount will be distributed in the form of grants via Recovery
and Resilience Facility, and the rest will be in the form of loans. The remainder of the grants
are used to top up normal EU budgetary programs.
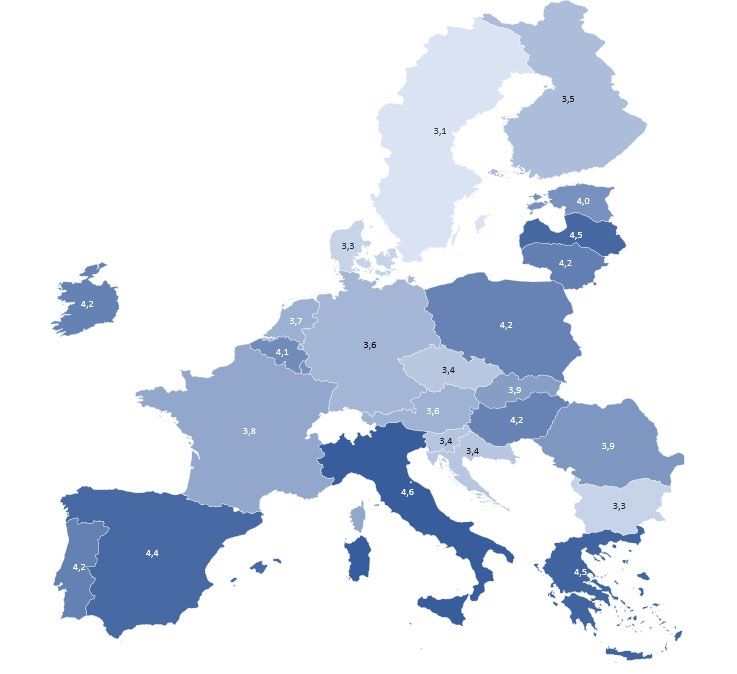
Economic experts across the EU disagree about how to assess the current EU policy to help
their member states and create a more resilient economy. The overall assessment on a scale
from 1 to 6 (where 6 is most suitable) on average is 4.0. Assessments of the European policy
responses clearly improved in relation to the overall EU strategy at the break-out of the
crisis (3.6). Experts of all EU countries except Sweden are more positive about the current
10EU strategy than about the strategy from a few months ago. Figure 2 shows that, in
particular, experts of Southern European countries like Italy (4.6), Greece (4.5), and Spain
(4.4) think positive about the current strategy. Moreover, assessments in the Baltic states as
well as in Poland and Hungary are above average. Least satisfied with the current strategy
are experts from Sweden (3.1) who assess it even worse than the strategy at the outbreak of
COVID-19 (3.3). Also, experts from Denmark, Bulgaria, and the Czech Republic state that the
current debated or implemented EU policy is not very suitable, while assessments of
German, French, and Dutch experts were also somewhat below the overall average.
Figure 2: Assessments of the current EU strategy
Note: Answers are an average calculated on a scale from 1 to 6, where 6 is most suitable.
To obtain more detailed information about which specific proposed or already
implemented EU policy measures the experts assess as suitable, we asked them to give their
assessments to the following: the ESM precautionary credit line of approximately 240 billion
EUR (already implemented), more lenient state aid rules and taxation, the European
instrument for temporary Support to mitigate Unemployment Risks in an Emergency
11(SURE) of up to 100 billion EUR (already implemented), the funds of the European
Investment Bank (EIB) to provide financing for SMEs, and the EU Recovery Fond (Next
Generation EU) of 750 billion EUR agreed on by the European Council.
When looking at the more specific policy options proposed or already implemented by the
EU, the SURE and the EIB funds are perceived as the best policy options across the EU (Table
5), whereas more lenient state aid or taxation rules are considered unnecessary by most
European economists. However, clear country differences also persist here.
Respondents from Denmark are very critical about the proposals coming from the European
Union. None of the policy measures proposed received an average score above 4 (on a scale
from 1 to 6). The Next Generation EU was particularly unfavourably received, with only 2.9.
Moreover, Scandinavian countries Sweden and Finland are skeptical about the suitability of
this program, while experts from the Southern European countries (Italy, Greece and Spain)
as well as France and Ireland expressed their satisfaction about Next Generation EU. An
introduction of Coronabonds is also regarded as very suitable by Italian, Greek and Irish
experts, while experts from the ‘frugal four’ countries (Austria, Denmark, Netherlands,
Sweden) and from Germany are not very convinced.
Solidarity between the respondents from the EU countries seems quite high, as when asked
“Do you think the EU member states should be willing to offer financial aid to those EU
countries that have been hit hardest by the COVID-19 pandemic?”, 87.9% of the respondents
state that they support the EU giving financial aid to those countries. The experts were more
divided on the question in what form this support should come. 44.1% support financial aid
in the form of loans, whereas 48.7% support grants. Figure 3 gives an indication of how
support is divided among the European countries. Economists from Austria and the
Netherlands seem to disagree with the politics in their countries that are part of the frugal
four that preferred loans over grants in the debate over the recovery funds of the EU.
12Table 5: Which EU policy responses are assessed as most suitable by EU countries
EIB financing for SMEs
Lenient state aid and
Next Generation EU
ESM precautionary
taxation rules
Coronabonds
credit line
SURE
Austria 4.0 3.5 3.1 4.4 4.5 4.2
Belgium 4.5 4.4 3.4 4.5 4.4 4.4
Bulgaria 3.4 2.6 3.3 4.1 3.9 3.9
Croatia 4.7 4.6 4.0 4.6 5.0 4.3
Czech Republic 4.3 3.8 3.8 4.4 4.6 3.7
Denmark 3.9 3.6 3.2 3.1 3.6 2.9
Finland 3.7 2.8 3.5 3.8 4.3 3.4
France 4.5 4.9 3.7 4.7 4.9 5.0
Germany 4.3 3.6 3.4 4.6 4.7 4.2
Greece 4.8 5.4 5.2 5.2 5.3 5.5
Hungary 4.2 4.4 4.5 4.5 3.9 4.7
Ireland 5.0 5.3 3.5 4.8 5.0 5.3
Italy 4.6 5.1 4.1 5.0 5.1 5.2
Latvia 4.6 4.7 3.7 4.6 4.5 4.8
Netherlands 4.5 3.6 3.8 4.2 4.7 4.3
Poland 4.5 3.6 3.8 4.2 4.5 4.4
Portugal 4.3 4.7 4.2 4.8 4.3 4.9
Romania 4.2 4.5 4.4 4.7 4.8 4.9
Slovakia 4.3 3.7 3.6 4.1 4.5 4.5
Slovenia 3.3 3.8 4.4 4.6 4.7 4.2
Spain 4.8 4.4 4.0 4.9 4.7 5.1
Sweden 4.3 3.0 3.1 3.9 4.0 3.1
Total 4.4 4.2 3.9 4.6 4.6 4.5
Note: Answers are an average calculated on a scale from 1 to 6, where 6 is most suitable. Calculations are
based on a total of 413 respondents from EU countries. Countries with less than 6 respondents were
excluded.
According to this survey, 52% of the economists in the Netherlands prefers loans, whereas
48% prefer grants. In Austria, the difference is even bigger, with only 35% indicating they
prefer loans, and a small majority (52%) preferring grants. The preference for grants is
unsurprising for Portugal, France, Belgium, Italy and Greece, but that this matter is more
divided in Spain – 53% prefer loans, and 43% prefer grants – also seems to be in contrast
with the political stance at the EU.
13Figure 3: Grants or loans? Preference of financial aid to other EU countries
How companies deal with the corona crisis
In the course of the corona crisis, many companies have been confronted with problems
and major challenges. Particularly during the lockdown phase, in many countries factories
had to deal with production stops and businesses had to be temporarily closed. In our
survey, we asked the experts what the biggest problems are for companies in their country
and which sectors have the highest risks for a wave of insolvencies. However, the corona
crisis will also lead to changes within companies in terms of making processes more resilient
to crises or even daily work routines. The experts were also for their opinion on what will
change within the companies in their country.
First, the experts were asked to rate the impact of the problems that the COVID-19 crisis
poses for companies in their country in the areas of finance/liquidity, domestic sales, foreign
sales, procurement (e.g. supply bottlenecks), and government regulations (e.g. closures,
hygiene concepts) on a scale from 1 (no impact) to 6 (severe impact). Table 6 shows the
results for selected countries. Overall, the sluggish demand on the domestic and foreign
sales markets has the severest impact for the companies. In most countries, experts rate the
14impact on domestic and foreign sales markets nearly equally severe, with Japan and the
Southern European countries amongst the highest averages. In China and Germany, many
companies depend on exports. In the opinion of the experts, this is why the problems on the
foreign sales markets a much higher impact on companies than the domestic sales markets.
Greek experts, on the other hand, see the biggest problem in the domestic markets. The
biggest difference can be seen in Brazil, where the domestic sales markets are an average of
5.4 but foreign markets cause relatively little concern, 3.3. Financing and liquidity are seen
as the problem with the biggest impact for companies after the sales markets (average of
4.5). The countries most over average are India (5.4), Greece (5.3), Turkey, and Italy (5.1
each). With an overall average of 4.3, experts consider governmental regulations like
hygiene concepts or closures an issue for companies (although not quite as significant as
the previous three areas). South Africa is the only country in Table 6 with an average above
5. French, Brazilian and Belgian experts, on the other hand, rated the importance of this
problem as, on average, below 4. During the lockdown phase, collapsed global supply
chains were a big issue. Nevertheless, at this point of the crisis experts don’t see
procurement as a very big problem for companies. Countries with the highest average in
this area are India, South Africa, and Japan.
Fears are that these problems many companies are currently facing could even lead to a
wave of insolvencies in many countries. Asked about the risk of insolvencies in the sectors
of the economy in their countries, experts everywhere stated that companies in tourism,
accommodation, food and entertainment, and the art sector have a very high risk of
insolvency. Another sector with high insolvency risks in many countries is the trade sector.
U.S. experts in particular assessed the risk in this sector as high.
For the manufacturing sector, more experts rated the risk as moderate but with
considerable differences for example in Europe. While experts in Italy and France see a high
risk for manufacturing companies, German and Swedish experts were less pessimistic. In
the opinion of the experts, the IT sector carries the lowest risk. In almost all countries, the
highest share of experts stated no risk or hardly any risk for IT companies. Comparing
different world regions, it is striking that the risk of insolvency is rated the highest for almost
all sectors except the trade sector in Africa and the Middle East.
15Table 6: Problems for companies during the COVID-19 crisis in selected countries
Domestic sales
Governmental
Procurement
Foreign sales
regulations
Finance /
Liqiudity
Australia 3.8 4.5 4.3 4.1 4.9
Belgium 4.9 5.1 5.3 3.6 3.9
Brazil 4.8 5.4 3.3 2.9 3.7
Canada 4.6 4.9 4.9 4.1 4.0
China 4.6 4.7 5.3 4.0 4.0
France 4.6 5.0 5.0 3.7 3.5
Germany 4.2 4.5 5.1 4.1 4.1
Greece 5.3 5.5 5.1 3.8 4.6
India 5.4 5.3 4.7 4.9 4.7
Italy 5.1 5.3 5.1 4.2 4.7
Japan 4.5 5.2 5.3 4.5 4.2
Netherlands 4.7 4.7 4.7 4.0 4.1
Russian Federation 4.4 4.9 4.8 3.6 4.4
South Africa 4.9 5.3 4.9 4.7 5.1
Spain 4.8 5.4 5.1 4.2 4.5
Turkey 5.1 4.7 4.5 4.1 4.4
United Kingdom 4.8 4.7 4.5 4.1 4.2
United States 4.2 5.0 4.8 4.4 4.3
Total 4.5 4.8 4.9 4.0 4.3
Note: Answers are an average calculated on a scale from 1 to 6, where 6 is the most severe impact.
However, the current crisis also offers many options for changes in companies to make
processes more resilient or adapting the working environment to the new challenges. The
experts believe that there will be fundamental changes in many companies. Above all, the
expansion of home offices and the reduction of unnecessary business trips will be an effect
of the crisis also in the long run. Moreover, the crisis could accelerate processes of
automation and digitalization within companies, as well as the expansion of digital
distribution channels. Outsourcing of products and services, on the other hand, in most
experts’ opinion will not increase because of the crisis. Only in Africa, Latin America and
other developing and emerging countries experts do expect a slight increase of outsourcing.
16Are economies and health care systems better prepared for a second wave?
Many points covered by the survey, such as the type and length of the economic recovery or
the suitability of policy measures, are highly dependent on the developments of the
pandemic. In particular, the risk of new waves of the pandemic cannot be ruled out until a
vaccine has been found (Weinstein et al., 2020). Thus, the currently increasing probability of
a second wave of the pandemic in many countries leads to an even higher uncertainty for
the world economy and the economies in the respective countries. To obtain information
on how countries are prepared for an eventual second wave of COVID-19 or a similar
pandemic in the future, we asked the participating experts to assess the health care system
as well as the economic resiliency of their country. Moreover, we asked them to give an
indication of how they think a lockdown should be implemented in that scenario.
Figure 4 shows the experts’ assessment of the preparedness of the health care system for a
potential second wave or a similar pandemic in the future for selected countries. The overall
assessment of the preparedness looks very encouraging. In particular, the health care
systems of European countries seem to have learned from the first wave and are now better
prepared for an eventual second wave. In the Netherlands (90%), Italy (88%), Germany
(84%), and France (79%) most experts believe that their health care system is now better
prepared than before the outbreak of COVID-19. On the other hand, only 33% of the U.S.
experts believe that the health system is more prepared - an even lower share than the
overall assessment of all African experts. Japan also has a relatively low share of experts
who assessed their health system as better prepared (41%), while 45% believe it is equally
prepared.
17Figure 4: How is the health care system prepared for a second wave?
Asked about the resiliency of the economy in their country, the experts’ assessments
differed a lot more within countries (Figure 5). This also shows the high economic
uncertainty caused by the pandemic. The resiliency is assessed highest within EU countries,
with Germany and the Netherlands leading with more than 50% of experts stating that the
economy is better prepared for a second wave. Japanese and Canadian experts mainly think
that their economy is equally prepared, while in the United Kingdom and the United States
the share of less resiliency answers was the highest among the three possible categories.
Figure 5: Assessments of economic resiliency in case of a second wave
18The outbreak of COVID-19 and the following lockdown measures left considerable long-
term impacts concerning individual social lives, political structures, health care systems
and economic wellbeing (Ali, 2020). Responses to the pandemic have often been framed in
terms of striking a balance between protecting people’s health and protecting the economy.
Thus, many people argue that in case of a second wave from an economic and social point
of view, a strong lockdown should be avoided if possible and only happen if absolutely
necessary and other options have not worked.
Figure 6 shows what the economic experts think about lockdown measures for their country
in case of a second wave. It can clearly be seen that in most countries, experts would prefer
a similar lockdown and social distancing measures, despite the feared economic
consequences. In Canada and Russia, more than two thirds of the participants would
choose that option. In the United Kingdom, France, and Italy the answers were more
distributed between the three options (stronger, similar and weaker). Only in the United
States and Brazil, where the political leaders downplayed the dangers of the pandemic and
didn’t impose strong measures against it, a clear majority of experts said they would prefer
a stronger lockdown for a second wave or other future pandemics.
Figure 6: Lockdown/social distancing measures in case of a second wave should be…
19Conclusion
This study gives indications on the heterogeneity of short- and long-term economic effects
of the COVID-19 pandemic in different countries all around the globe. For this purpose, we
consulted a large panel of 950 economic experts in 110 countries on their expectations on
the effects on GDP growth rates, potential output, and other economic effects as well as
assessments of suitable policy measures for their domestic economies.
All around the globe, the experts expect a massive slump in GDP. In most countries, experts
project very negative GDP growth rates for this year, followed by a rebound next year but
also a long period of economic recovery. Besides these short-term effects on economic
activity, the potential GDP is also assumed to be affected negatively by this crisis. However,
the expectations of the experts are marked by the high uncertainties of the pandemic with
the looming risk of a second wave in many countries, along with the severe impacts that
new lockdown measures could have on the economic recovery.
Another main takeaway of the survey are the experts’ assessments of effective policy
responses to the crisis. Strikingly, the experts strongly prefer emergency liquidity assistance
to firms as well as improvements to the health care systems. In contrast, most experts in our
sample do not regard helicopter money or permanent tax cuts as being well suited to help
the economy.
This survey opens up potential for further analyses and research questions, as the results of
this survey wave can be compared to other existing surveys such as surveys of professional
forecasters and business surveys, as well as to other official economic data. In addition,
further comparisons to the first wave of this survey from April can provide interesting
insights on how economic experts updated their expectations and assessments during the
crisis. The microdata of both waves of the survey is accessible for researchers at the LMU-ifo
Economics & Business Data Center (EBDC) at the ifo Institute (Mittelmeier, 2020).
20References
Ali, I., 2020. COVID-19: Are We Ready for the Second Wave? Disaster Medicine and Public Health
Preparedness 1–3.
Bénassy-Quéré, A., Corsetti, G., Fatás, A., Felbermayr, G., Fratzscher, M., Fuest, C., Giavazzi, F.,
Marimon, R., Martin, P., Pisani-Ferry, J., Reichlin, L., Rey, H., Schularick, M., Südekum, J.,
Teles, P., Véron, N., Mauro, B.W. di, 2020. COVID-19 economic crisis: Europe needs more
than one instrument. VoxEU.org. URL https://voxeu.org/article/covid-19-economic-crisis-
europe-needs-more-one-instrument (accessed 9.21.20).
Boumans, D., Fuest, C., Krolage, C., Wohlrabe, K., 2020a. Expected effects of the US tax reform on
other countries: global and local survey evidence. Int Tax Public Finance.
Boumans, D., Garnitz, J., 2019. Ifo World Economic Survey Database – An International Economic
Expert Survey. Jahrbücher für Nationalökonomie und Statistik 237, 71–80.
Boumans, D., Garnitz, J., Schulze, G.G., 2018. Who has terror angst? Perceptions of the effects of
terror on the world economy. Applied Economics Letters 25, 29–33.
Boumans, D., Link, S., Sauer, S., 2020b. COVID-19: The World Economy Needs a Lifeline – But Which
One? EconPol Policy Brief 15.
IMF, 2020a. World Economic Outlook Update, June 2020: A Crisis Like No Other, An Uncertain
Recovery URL
https://www.imf.org/en/Publications/WEO/Issues/2020/06/24/WEOUpdateJune2020
(accessed 9.8.20).
IMF, 2020b. World Economic Outlook Update, January 2020: Tentative Stabilization, Sluggish
Recovery? URL https://www.imf.org/en/Publications/WEO/Issues/2020/01/20/weo-update-
january2020 (accessed 9.22.20).
IMF, 2020c. Policy Responses to COVID19 URL https://www.imf.org/en/Topics/imf-and-
covid19/Policy-Responses-to-COVID-19 (accessed 9.22.20).
Link, S., Sauer, S., 2020. Monatlicher Nowcast der realisierten Kurzarbeit auf Basis von
Unternehmensbefragungen. ifo Forschungsbericht 88, ifo Institute, Munich.
Mittelmeier, H., 2020. Das LMU-ifo Economics Business Data Center. in: Sauer, S. and Wohlrabe, K.
(Editors): ifo Handbuch der Konjunkturumfragen, 207-217.
Tesche, T., 2020. The European Union’s Response to the Coronavirus Emergency: An Early
Assessment (SSRN Scholarly Paper No. ID 3624730). Social Science Research Network,
Rochester, NY.
Weinstein, E., Ragazzoni, L., Burkle, F., Allen, M., Hogan, D., Corte, F.D., 2020. Delayed Primary and
Specialty Care: The Coronavirus Disease–2019 Pandemic Second Wave. Disaster Medicine
and Public Health Preparedness 1–3.
WHO, 2020. IHR Emergency Committee on Novel Coronavirus (2019-nCoV) URL
https://www.who.int/dg/speeches/detail/who-director-general-s-statement-on-ihr-
emergency-committee-on-novel-coronavirus-(2019-ncov) (accessed 9.8.20).
21EconPol Europe EconPol Europe - The European Network for Economic and Fiscal Policy Research is a unique collaboration of policy-oriented university and non- university research institutes that will contribute their scientific expertise to the discussion of the future design of the European Union. In spring 2017, the network was founded by the ifo Institute together with eight other renowned European research institutes as a new voice for research in Europe. A further five associate partners were added to the network in January 2019. The mission of EconPol Europe is to contribute its research findings to help solve the pressing economic and fiscal policy issues facing the European Union, and thus to anchor more deeply the European idea in the member states. Its tasks consist of joint interdisciplinary research in the following areas 1) sustainable growth and ‘best practice’, 2) reform of EU policies and the EU budget, 3) capital markets and the regulation of the financial sector and 4) governance and macroeconomic policy in the European Monetary Union. Its task is also to transfer its research results to the relevant target groups in government, business and research as well as to the general public.
You can also read