Reduction of chronic malnutrition risk and chronic malnutrition through a public health intervention in children under one year of age in Bogotá ...
←
→
Page content transcription
If your browser does not render page correctly, please read the page content below
Reduction of chronic malnutrition risk and chronic malnutrition through a
public health intervention in children under one year of age in Bogotá,
Colombia
Paula Andrea Castro Prieto ( paula.castro@fsfb.org.co )
Fundación Santa Fe de Bogotá https://orcid.org/0000-0003-1333-7983
Kenny Margarita Trujillo Ramírez
Nutrición Social
Sergio Moreno López
Fundacion Santa Fe de Bogota
Juan Sebastián Holguín
Fundación Éxito
Diana María Pineda
Fundación Éxito
Simon Tomasi
Nutrición Social
Andrea Ramírez Varela
Universidad de Los Andes Facultad de Medicina
Research article
Keywords: chronic malnutrition, public health intervention, children
DOI: https://doi.org/10.21203/rs.3.rs-63504/v1
License: This work is licensed under a Creative Commons Attribution 4.0 International License. Read Full License
Page 1/13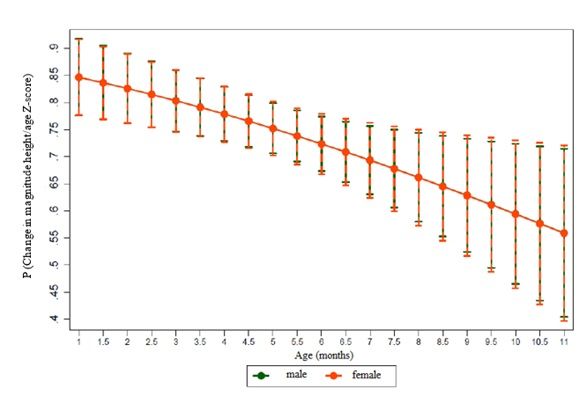
Abstract
Background: As Bogotá is one of the regions with the highest prevalence of chronic malnutrition (13%) in Colombia, exceeding the national gure of 10.8%, a
public-private alliance was established to address this situation within the framework of intersectoral action: the private organizations Fundación Santa Fe de
Bogotá and Fundación Éxito, local government agencies of the Mayor's O ce of Bogotá (Secretaría Distrital de Salud and the Secretariat de Integración
Social) and agencies at the national level (Instituto Colombiano de Bienestar Familiar [Colombian Institute of Family Welfare], including its regional o ce in
Bogotá). Therefore, the objective was to determine the effectiveness of an intersectoral public health intervention with the population under one year of age,
classi ed as at risk of chronic malnutrition and with chronic malnutrition by anthropometry, residing in 3 prioritized territories of the Capital District.

Methods: Pre-experimental, before and after study that sought to determine the magnitude of the change in nutritional status in children under one-year-old
residing in 3 prioritized territories of Bogotá through a ten months public health nutrition intervention.

Results: The intervention comprised 1126 children living in the following territories in Bogotá: Kennedy, San Cristóbal, and Engativá. A total of 43.3% children
presented delay in height for age, and 56.7% presented risk of short stature. In the nal measurement, data were obtained from 686 children, identifying that
17% of the children progressed from stunting to a stunting risk and that 4.5% recovered their growth trajectory, achieving an adequate height for their age.

Conclusions: That children classi ed as at risk or stunting at the beginning of the intervention showed an increased probability of approaching or being in the
appropriate growth trajectory according to the height-for-age indicator after the intervention. In addition, the risk of stunting is a reversible condition if
interventions are implemented in a timely manner and with intersectoral action for which it is imperative to link the community itself as a key sector for direct
action and to organize all actors and sectors having missionary purposes with this population.

Background
Childhood chronic malnutrition corresponds to stunting, measured using the height-for-age indicator, and is classi ed as such when height is below 2
standard deviations (
Methods
Study design
This was a pre-experimental study, with before and after intervention analyses, to determine the magnitude of the change in nutritional status determined by
anthropometry of children under one year of age residing in three prioritized territories of Bogotá, exposed to an intersectoral public health intervention for
10 months.
Sample
1126 children younger than 10 months of age with anthropometric nutritional classi cation compatible with a risk of short stature (height/age indicator cut-
off point ≥ − 2 to < -1) and/or chronic malnutrition (cut-off point < -2) were recruited. The sample size considered resources available to develop the
intervention in the territory, in the time foreseen as the minimum feasible intervention to achieve changes in the population to be intervened.
About The Selection Of The Sample
Available economic resources allowed recruiting and following up a maximum number of subjects in three out of 20 territories in which Bogotá is divided. To
select these territories, the 2017 and 2018 databases from epidemiological surveillance systems were reviewed. Selection was conducted according to
mother’s residence, the highest number of children under two years of age with chronic risk of malnutrition or malnutrition and, history of low birth weight. Five
of the 20 territories accounted for 47% of the cases and, Engativá, Kennedy and San Cristóbal, which are in different latitudes of the city, were identi ed as the
three territories with the greatest number of cases [see additional le 1].
Regarding The Recruitment Of Subjects
1752 children were screened, of whom 1126 voluntarily agreed to participate in the study and met the following inclusion criteria:
Children with the height-for-age indicator (H/A) less than − 1 SD;
Children aged ten months or younger at study entry;
Product of a full-term pregnancy (birth from 37 weeks or more); and
Resident of any of the three prioritized territories.
The de ned exclusion criteria were as follows:
Product of multiple pregnancies;
Place of residence different from Bogotá;
Any special health condition (disability);
Congenital pathology;
Con rmed diagnoses of diseases requiring pharmacological treatment with hormone therapy and/or special diets preventing compliance with the
recommendations of complete, balanced, su cient, and adequate nutrition for healthy children; and
Families not consenting study participation.
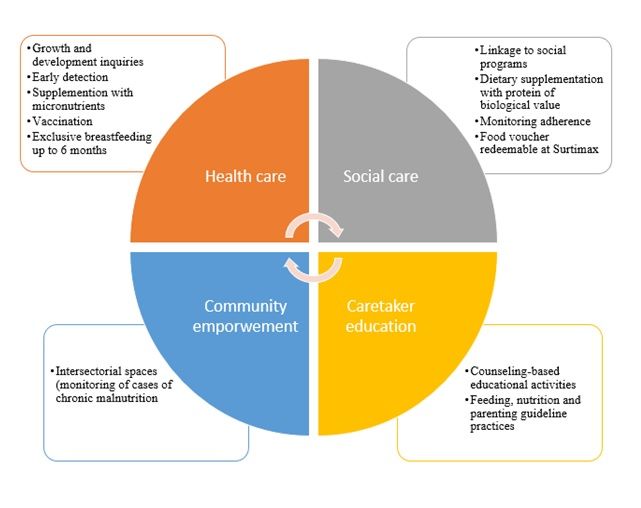
Intervention Model:
The intervention was designed according to evidence-based recommended actions, adopted and regulated by Colombia (6) and, the Evidence-Based Clinical
Practice Guide (7) to achieve adequate health and nutrition in early childhood. This intervention model (Fig. 1) focused on actions throughout the rst
1000 days of life (from conception through the rst two years of life), and included the following axes:
Health care: provided speci c information to families about the health care each child should receive according to their age and current condition.
Individual needs were identi ed through baseline interviews.
Social care: included actions to guide families to early education care and the social bene ts available in each territory. As part of the development of this
axis, a pedagogical food supplementation strategy was implemented through the delivery of redeemable vouchers in supermarkets that had to be
exchanged in order to get a pre-established list of healthy foods (determined by nutritionists in the team). The foods obtained from the voucher should
contribute 33% of the daily caloric requirements and 100% of the protein requirements, which would be additional to what the children received at home or
in other social programmes. Compared to other sources of food supplementation, the voucher was used to provide nutritious foods that would strengthen
the nutritional recovery of children, mainly associated with the contribution of protein of high biological value and energy from healthy sources [see
additional le 4].
Caregiver education: considered as the linkage of all axes and actions. Therefore, face-to-face workshops were held for fathers, mothers and other
caregivers regarding food and nutrition, parenting, and development guidelines, all speci c to age groups and using innovative methodologies that would
allow the greatest appropriation of knowledge to be applied for the care of children.
Community empowerment: its purpose was to achieve the sustainability of the actions that were developed in the other components beyond the time of
the study and the adherence to them to bene t more children in the territories. Its development included characterization and participation in the
intersectoral workspaces of each territory undergoing the intervention and Bogotá as a city from the central government, in addition to the deployment of
a communication strategy with various tools.
Page 3/13The distribution of study bene ciaries according to participation in the activities de ned for the intervention can be consulted in the Fig. 2.
Data Collection
Collection of baseline information was conducted between May and July 2018. Post-intervention measurement was developed between May and August
2019.
The dependent variable was the magnitude of the change in nutritional status determined by anthropometry in the height-for-age indicator (H/A). Appropriate
height for age was de ned as ≥ -1 standard deviation (SD), risk of short stature was de ned as ≥ -2 and < -1 SD, and delay in height was de ned as < -2 SD
(8)
.
The independent variables were determinants of the nutritional status of individuals:
Feeding: exclusive and continued breastfeeding practices and adequate complementary diet;
Nutrition: weight and height;
Health: history of pregnancy, tracking growth’p, vaccination, supplementation and home enrichment with micronutrients, educational messages;
Social: redemption and use of food vouchers destined to strengthen the feeding of the breastfeeding mother and that children strengthen their
complementary feeding; and participation/connection with social programmes; and
Socioeconomic and demographic context. locality of residence, household income, female head of household, mother's schooling, mother's age and
child's age.
Tools
For the analysis, the frequency of food consumption for children under two years validated by the ENSIN was used (5).
Statistical analysis:
To analyse the effects of the intervention on the nutritional status measured by anthropometry via H/A and the factors associated with H/A changes
(comparing baseline and nal post-intervention measurements), statistical analysis was performed using a multivariate logistic regression model.
For the purposes of the model, the dependent variable was constructed by comparing the nutritional status via the rst and second H/A measurements
(baseline and post-intervention measurements). A positive effect of the intervention was de ned as presenting height-for-age with a positive trend suggestive
of an approach to the appropriate growth trajectory or presenting a H/A compatible with being in the normal growth trajectory. The above required ful lment
of the following 2 conditions: 1) a comparison between the baseline and the nal measurements and 2) having participated in all the components of the
intervention (education, social assistance from the redemption of pedagogical food vouchers and health monitoring).
The independent variables of the model were de ned as follows (throughout the sample):
Territory: Kennedy was used as an adjustment variable in the model as a reference category;
Educational level of the mother: although the primary reference category presented a lower number of observations than the other categories;
Socioeconomic variables: these were not included in the model because more than 95% of the sample had access to basic public services; and
Adherence to workshops: this variable was not included in the model because consolidated attendance at workshops by bene ciaries exceeded 95% [see
additional le 2].
Regarding the diagnosis and adjustment of the model, there were no collinearity problems. In turn, the goodness of t tests did not reject the null hypothesis of
the model t and did not present leverage problems. For the residuals, ve atypical points were detected. After a sensitivity analysis with a power of 80%, these
points were removed from the nal model because the magnitude of the coe cients did not exceed 5%, and the goodness of t statistics (AIC and BIC) were
excluded for the nal model. Finally, ROC curve analysis revealed an area under the curve of 72.11 and a percentage of correct classi cation of 75%.
Results
Baseline.
A total of 1126 children were recruited in the three prioritized localities. 42.81% of the sample lived in Engativá, while 30.02% and 27.18% lived in Kennedy and
San Cristóbal, respectively (Table 1).
Regarding gender, 52.84% of the children were male, and 47.16% were female. In terms of age group, 55.60% of children were younger than six months, and
44.40% were older than six months. The main caregiver was mothers (87.74%). A total of 40.59% of these mothers had completed their high school education.
Page 4/13Table 1
Distribution of participants by location,
baseline.
Locality Frequency Percentage
Engativá 482 42.81
Kennedy 338 30.02
San Cristóbal 306 27.18
Total 1126 100
For anthropometric nutritional status (Table 2), 43.25% of the children were classi ed with height delay for age, and 56.75% were at risk of short stature. Of the
variables obtained to assess feeding practices, for exclusive breastfeeding, less than 4 out of 10 children (37.80%) younger than 6 months were exclusively
breastfed; San Cristóbal (40.65%) was the territory with the highest prevalence of the practice, followed by Engativá (38.15%), and Kennedy (35.32%).
Table 2
Distribution of participants according to nutritional
status by anthropometry, height/age indicator,
baseline
Height/age Frequency Percentage
Delay in height 487 43.25
Risk of short stature 639 56.75
Total 1126 100
For adequate complementary diet, eight out of ten participants (81.0%) between six and eight months had adequate introduction of food consistencies. The
consumption of food sources of protein such as eggs was reported for 31.20% of the children, while meat, sh, chicken and other food sources of animal
protein were consumed by 49.20% of the children.
Post-intervention nal measurement.
For the nal measurement performed at the end of the ten-month intervention, the legal caretakers of the participants were contacted. Data and post-
intervention measurements were collected from 686 children (the reduction in the sample was due to transfers from the participants' place of residence). In
this phase, before and after comparisons were performed and for this analysis, children without nal measurements were not included.
The reason why we did not conduct data imputation is that height is a biological variable that changes during childhood, even with stunting. Additionally, from
the statistical point of view, a statistical power of 80% was achieved with 686 nal participants. Therefore, the comparisons described below correspond to
686 children that have both baseline and nal post-intervention measurements.
The geographic distribution of participants measured in the post-intervention period can be found on Table 3. Regarding gender, 47.23% were female, and
52.77% were male. The age distribution was as follows: 64.58% were children between 12 and 18 months, 22.16% were children older than 18 months, and
13.27% were children between nine and 11 months. Similarly, it was found that mothers were the main caregivers (71.87%). Of this group, almost a quarter
(22.11%) reported having completed technical or technological studies.
Table 3
Distribution of the participants by locality of
residence, post-intervention nal measurement.
Locality Frequency Percentage
Engativá 285 41.55
Kennedy 189 27.55
San Cristóbal 170 24.78
Other locations 42 6.12
Total 686 100
Regarding the health variables in the post-intervention measurement, 19.10% of caregivers reported not having a growth and development card (in Colombia,
all children under ve years have a card that includes the growth and development chart and nutrition records that caregivers have to bring to every
consultation) and having this card was determined as evidence of adherence to this health care. At baseline, this gure was 35.90%; that is, this variable
improved by 16.90 percentage points. Concerning the recommended care for the early detection of growth and development disorders in children, only 35.3%
met the number of consultations required for their age.
Page 5/13In terms of nutritional status by anthropometry (Table 4) and [see additional le 3], 17.06% of the children transitioned from stunting to risk of short stature,
while 4.52% (31 children) advanced to an appropriate H/A. For the risk of short stature, 21.57% (146 children) progressed towards adequate H/A, 29.59%
maintained a risk of short stature, and 6.56% reported stunting. For the weight-for-height indicator, 2.10% of children who reported a delay in height also
presented a risk or excess weight, compared to 17.90% who presented this same condition at baseline.
Table 4
Changes in the height-for-age indicator.
Anthropometric baseline Post-chronic Post-chronic Post-risk of Post-risk of short Post- Post- adequate
classi cation malnutrition (stunting) malnutrition (stunting) short stature stature (%) adequate height (%)
height
(%)
Chronic malnutrition 142 20.70 117 17.06 31 4.52
Risk of short stature 45 6.56 203 29.59 148 21.57
Total 187 27.26 320 46.65 179 26.09
For the variables related to feeding practices, continued breastfeeding was reported by 73.70% of the participants. In turn, at baseline, 29.20% reported
consuming eggs, which are a source of protein of high biological value and are easy to access, and in the nal post-intervention measurement, 83.32%
reported consuming eggs. At baseline, 45.20% reported consuming other food sources of animal protein, while in the nal measurement, this value increased
to 90.21%. The redemption of the voucher achieved 93.51% adherence throughout the intervention.
Multivariate Logistic Regression Model
Model results
According to Table 5 and Fig. 3, the statistically signi cant results suggest that children classi ed as at risk of stunting or with stunting at the beginning of the
intervention showed an increased probability of approaching or being in the appropriate growth trajectory according to the height-for-age indicator after the
intervention. However, this probability decreased if children were at risk of stunting or had stunting at older ages, as follows: for each additional month of age
that elapsed for the identi cation of risk or stunting, the probability of approaching or entering an adequate growth trajectory with an intersectoral nutritional
intervention decreased by 20.1% (OR: 0.79 95%CI: 0.70–0.90 p < 0.001).
Page 6/13Table 5
Multivariate logistic regression model presenting the probability of approaching or being in the appropriate growth
Variable Coe cient (OR) Standard error Con dence interval p-value
Height-for-age z-score 0.51 0.09 0.36 0.73 0.000
Age in months 0.79 0.05 0.70 0.90 0.001
Reference category ( rst child)
Second child or older 0.90 0.19 0.59 1.36 0.626
Reference category (locality 1)
Locality 2 0.76 0.19 0.46 1.27 0.309
Locality 3 0.61 0.17 0.35 1.07 0.088
Reference category (male)
Female 1.03 0.21 0.68 1.56 0.869
Reference category (caregiver age < 40 years)
Older than or equal to 40 years 1.87 0.74 0.85 4.10 0.115
Reference category (education level: elementary)
High school 1.11 0.46 0.49 2.51 0.787
Technical or technological or professional 1.27 0.57 0.52 3.07 0.594
Postgraduate 3.02 2.04 0.80 11.36 0.102
Reference category (not exclusive breastfeeding)
Exclusive breastfeeding 0.95 0.41 0.40 2.21 0.907
Reference category (non-continued breastfeeding)
Continued breastfeeding 1.03 0.45 0.43 2.43 0.941
Reference category (canned milk consumption)
No consumption of canned milk 0.54 0.13 0.32 0.89 0.017
Reference category (no fruit consumption)
Fruits 0.77 0.42 0.26 2.29 0.648
Reference category (no consumption of vegetables)
Vegetables 1.60 0.51 0.85 3.00 0.138
Reference category (no consumption of protein sources)
Protein sources 1.46 0.46 0.78 2.73 0.232
Reference category (no consumption of legumes)
Legumes 1.90 0.42 1.22 2.95 0.004
Reference category (no minimum frequency of consumption)
Minimum frequency of consumption 1.72 0.61 0.85 3.45 0.126
Reference category (no monitoring 1)
Monitoring 1 1.74 1.23 0.43 6.94 0.427
Reference category (no monitoring 2)
Monitoring 2 0.43 0.50 0.46 4.14 0.472
Reference category (less than 9 vouchers)
9 or more vouchers 0.73 0.18 0.44 1.20 0.223
Reference category (≤ 1.0 CLMW)
> 1.0 CLMW 1.53 0.32 1.01 2.31 0.043
Reference category (non-mother head of household)
Mother head of household 1.53 0.32 1.00 2.33 0.045
Page 7/13Variable Coe cient (OR) Standard error Con dence interval p-value
Constant 3.44 5.59 0.14 82.8 0.445
number of observations 571
At the beginning of the intervention, children who were six months or younger and at risk of stunting or with stunting, had more than a 70.0% probability of
approaching or entering their proper growth trajectory after intervention. In contrast, children older than six months had less than a 70.0% probability.
In addition, when these children had mothers that self-reported as heads of household, there was more than a 70% probability of approaching or entering their
proper growth trajectory once receiving the intervention; in comparison, children older than six months had less than a 70% probability.
In contrast, the probability of approaching or being in the appropriate growth trajectory for the height-for-age indicator, post-intervention, decreased if children
were at risk of stunting or with stunting at older ages and mothers were not recognized as heads of household.
Concerning the food component, the probability of approaching or being in the proper growth trajectory after the intervention decreased by 45.9% (OR: 0.57
95%CI: 0.32–0.89 p < 0.017) if the children were fed formula milk compared to those who were not fed formula milk during the course of the intervention.
Likewise, the probability of approaching or being in the proper growth trajectory after the intervention increased by 90.5% (OR: 1.90 95%CI: 1.22–2.95%: p <
0.004) for those who included vegetables in the diet compared to those who did not consume vegetables during the course of the intervention.
Regarding sociodemographic data, the probability of approaching or being in the appropriate growth trajectory after the intervention increased by 53% (OR:
1.53 95%CI: 1.01–2.31%: p < 0.043) for the children of households with an income greater than 1.0 current legal minimum wage (CLMW) compared to children
of households with an income lower than 1.0 CLMW during the course of the intervention. This probability also increased by 53.7% (OR: 1.53 95%CI 1.00-
2.33%: p < 0.045) for children in families with female heads of households compared to children in families with male heads of households.
Discussion
This study shows how a model of intersectoral intervention, to which a group of children under one year of age was exposed for ten months, was able to
change the nutritional status, as measured by anthropometry, i.e., H/A indicator, in 43.14% of the participants undergoing the intervention. Four children out of
ten moved positively in their growth trajectory; these results were based on nal post-intervention measurements.
After the intervention, the group of children who showed a positive change in heightSimilarly, it has been shown that interventions that include timely education for caregivers for the age and current condition of the children, systematic
monitoring, effective connection with health care and other sectors related to early childhood care, including basic sanitation and drinking water, developed in
low- and middle-income countries are more effective for better outcomes related to child nutrition (9).
For example, at the end of the intervention, 80.9% bene ciary families had their comprehensive assessment of growth and development cards for their
children and were able to explain their importance; their use demonstrates caregiver empowerment through exercising their rights and duties as citizens,
bene ting them as a community. Necessary conditions for caregivers to effectively access health care relevant to the age of their children are key factors for
the prevention and/or management of delayed height in the window of opportunity of early childhood (1).
The educational strategy used for the intervention axis related to caregiver education was constructed using counselling as a methodology, whose principle is
to work from the needs expressed by those who will be subjects of education using the skills allowing improving the process of communication between the
facilitators and the participants so that they acquire the necessary skills for informed decision-making (16).
In this study, at the end of the intervention, seven out of ten children continued breastfeeding (73.7%) as part of their eating pattern; in comparison with the
breastfeeding practice at baseline, improvement in practice was evident. Evidence has shown that using counselling contributes positively to practices related
to the duration of exclusive and continued breastfeeding (17) with adequate complementary feeding until two years and older.
Similarly, an improvement in the general practice of breastfeeding has been related as a function of maternal educational level and to mothers being
immersed in protective environments and surrounded by community supporters (18). These elements were also observed; most of the mothers had completed
their high school education and a signi cant proportion, by the end of the intervention, had completed higher technical studies, a nding that suggests the
importance of consolidating intersectoral strategies to favour the formal education of mothers and caregivers.
The probability of approaching or being in the appropriate growth trajectory, after the intervention, was reduced by 45.9% if the children were fed with formula
milk compared to those who did not receive it. This result is consistent with other studies. A study conducted in public hospitals in Hong Kong found for a
sample of 642 preterm children with low weight, those fed during their hospitalization with breast milk had a better z-score for height-for-age upon discharge
than children fed formula milk because children fed formula have a higher risk of gastrointestinal infections that affect weight and height (19) .
These results rea rm breast milk providing nutrients children need for healthy growth and development during their rst two years and beyond; therefore, it is
necessary that social programs have as a priority the promotion and protection of this practice, as established by the WHO: exclusive breastfeeding during the
rst six months of life and adequate complementary feeding until two years or more (20).
According to the age of the children, 29.2% consumed eggs at baseline (older than six months), and 83.32% consumed eggs at the post-intervention
measurement. That is, eight out of ten children were eating eggs as one of their main sources of protein. After the intervention, nine out of ten children
(90.21%) had food sources of animal protein as part of their eating pattern. This result could be related to food voucher delivery, part of the social focus of the
intervention model.
These vouchers were redeemed monthly by each bene ciary family in the study in a local supermarket. The redemption had a list of foods that included
healthy food. This list was de ned taking into account the recommendations for feeding for early childhood de ned by the governing body of the sector for
Colombia, ICBF (21). Additionally, the proposed form of redemption favoured families having autonomy in decision-making for the purchase and preparation of
food. This was mediated by the collaboration between the axes of education for caregivers and social care.
According to the evidence, the way to effectively intervene in height delays in early childhood requires comprehensive intersectoral work that encompasses
cross-cutting actions that can account for most of the determinants of this condition, as the intervention of this study developed (12, 1) .
In relation to the sociodemographic results:
1. Family income plays a fundamental role in the recovery of stunting. A World Bank study (22) argues that the link between income and nutritional status
occurs mainly because households with higher income levels can invest more in consumption and variety of foods, in addition to having better quality of
services and more resources to invest in the care of their children. This relationship has been validated by different studies using different measures to
determine income as monthly wages (23, 22) or assets in the home (24), among others.
2. The obtained results of mother’s education level were not consistent with scienti c evidence. Different authors have referred to how the children of more
educated mothers present better results for the nutritional indicator height-for-age (13, 12, 2). Education empowers women to make decisions they could not
make in the absence of it, such as having fewer children or using health services in a better way, which leads to greater development in their children, both
physical and emotional (25). In the present study, this relationship was not evidenced.
The intervention model implemented in the study is in line with several of the recommendations suggested by authors such as Butta, who refers to following
effective actions in public health that make it possible to reduce height delays when implemented during early childhood: (i) folic acid supplementation in the
preconception period; (ii) dietary supplementation to obtain a positive energy and protein balance in pregnant women; (iii) calcium supplementation for
mothers; (iv) multiple micronutrient supplementation during pregnancy; (v) promotion of breastfeeding; (vi) adequate complementary feeding; (vii)
administration of vitamin A; (viii) preventive zinc supplementation in children from six to 59 months; (ix) treatment of moderate acute malnutrition; and (x)
treatment of severe acute malnutrition (26).
Limitations
Page 9/13The sampling for this study was consecutive, and families were recruited mainly by mass communication strategies and the “snowball” technique. This
sample determination did not allow us to extrapolate the results to the entire population in Bogotá. The intervention model developed and the results of the
study directly pertain to the speci c composition of the sample, mainly in terms of socioeconomic indicators; therefore, the magnitude of the change obtained
on the height/age indicator of the bene ciaries of the study is speci c to this group of children under the conditions that were treated
Conclusion
The risk of stunting and/or stunting in early childhood is a reversible condition if interventions are implemented in a timely manner and with intersectoral
action, for which it is imperative to link the community itself as a key sector for direct action and to organize all actors and sectors having missionary
purposes with this population; this should be done to coordinate their multiple actions on the common focus of preventing and/or treating height problems
related to malnutrition. Colombia, like other countries in the region, should continue their efforts to improve the visibility of this problem and make it a priority
for the development of the country.
Declarations
Ethics approval and consent to participate
The study complies with the de nition in the Declaration of Helsinki regarding the development of research that involves human beings, and all legal
representatives of the research subjects signed the informed consent forms acknowledging they understood what the participation of their children in the
study meant. The databases created for the study were anonymized for statistical analysis, results and conclusions reporting. The study was authorized by
the ethics committee of Fundación Santa Fe de Bogotá, record number CCEI-9555-2018.
Consent for publication
Not applicable.
Availability of data and material
The datasets used and/or analyzed during the current study are available from the corresponding author on reasonable request.
Competing interests
The authors declare they have no competing interests
Funding
The study was funded by Fundación Éxito and Fundación Santa Fe de Bogotá. Fundación Éxito provided the resources for the development of the research
process in the different phases: characterization, baseline, intervention and nal measurement. For its part, Fundación Santa Fe de Bogotá linked specialized
human talent to lead the project.
Authors’ contributions
Through this, we declare that the seven authors are responsible and guarantors that all the aspects that make up the manuscript have been reviewed and
discussed with the maximum precision and integrity. In order of participation PCP: was the one who led the design and nterpretation of data, construction, and
nal revision of the article. KMT, SML, JHP: supported with the conception, construction, and nal revision of the manuscript. AR: was the epidemiology
consultant of the project. Similarly, DPR, ST: supported information and nal document revision. All authors have read and approved the manuscript.
Acknowledgements
We thank the community of the Kennedy, San Cristobal and Engativá territories, local associations, and public entities for allowing the development of this
intervention.
References
1. World Health Organization. Metas mundiales de nutrición 2025: Documento normativo sobre retraso del crecimiento; 2017. Available from:
https://apps.who.int/iris/bitstream/handle/10665/255735/WHO_NMH_NHD_14.3_spa.pdf?ua=1. [cited 2020 Feb 1].
2. World Health Organization. 10 facts on nutrition; 2017. Available from: https://www.who.int/features/fact les/nutrition/en/. [cited 2020 Feb 1].
3. La desnutrición infantil. Causas, consecuencias y estrategias para su prevención y tratamiento; 2011. Available from:
https://www.unicef.es/sites/unicef.es/ les/Dossierdesnutricion.pdf. [cited 2020 Feb 1].
4. El Estado Mundial de la Infancia 2019: Niños, alimentos y nutrición: crecer bien en un mundo en transformación; 2019. Available from:
https://www.unicef.org/lac/informes/el-estado-mundial-de-la-infancia-2019-ni%C3%B1os-alimentos-y-nutrici%C3%B3n. [cited 2020 Feb 1].
5. Colombia, Ministerio de Salud y Protección Social, Instituto Colombiano de Bienestar Familiar, Universidad Nacional de Colombia, Instituto Nacional de
Salud. Encuesta Nacional de la Situación Nutricional (ENSIN). Colombia; 2019.
Page 10/136. Ministerio de Salud y Protección Social. Rutas de Atención Integral en Salud; 2016. Available from: https://www.minsalud.gov.co/Paginas/rutas-
integrales-de-atencion-en-salud.aspx. [cited 2020 Feb 1].
7. Ministerio de Salud y Protección Social. Guía de Práctica Clínica (GPC) Basada en la evidencia para la promoción del crecimiento, detección temprana y
enfoque inicial de alteraciones del crecimiento en niños menores de 10 años. Bogotá: Colciencias, Instituto de Evaluación de Tecnologías en Salud IETS;
2015. Avalaible from: http://gpc.minsalud.gov.co/gpc_sites/Repositorio/Conv_563/GPC_crecimiento/Guia_Completa_C_D.pdf. [cited 2020 Aug 20].
8. Ministerio de Salud y Protección Social. Resolución 2465 de 2016; 2016. Available from:
https://www.minsalud.gov.co/Normatividad_Nuevo/Resolucion%202465%20de%202016.pdf. [cited 2020 Feb 1].
9. Hossain M, Choudhury N, Binte KA, Mondal P, Jackson A, Walson J, et al. Evidence-based approaches to childhood stunting in low and middle income
countries: a systematic review. Arch Dis Child. 2017; 102(10): 903- 09. http://doi: 10.1136/archdischild-2016-311050.
10. Bamisaye BO, Oladejo T. Association between stunting and obesity among under- ve children in urban and rural areas of Oyo State, Nigeria. Malays J
Nutr. 2018; 24(1): 25-4.
11. Farah AM, Nour TY, Endris BS, Gebreyesus SH. Concurrent of stunting and overweight/obesity among children: evidence from Ethiopia. medRxiv. 2020; 1-
27. https://doi.org/10.1101/2020.02.13.20022723.
12. De Onis, Branca F. Childhood stunting: a global perspective. Matern Child Nutr. 2016; 12(1): 12- 6. https://doi.org/10.1111/mcn.12231.
13. Vittora C. Los mil días de oportunidad para intervenciones nutricionales. De la concepción a los dos años de vida. Arch Argent Pediatr. 2012; 110(4) 311-
17. http://dx.doi.org/10.5546/aap2012.311.
14. Martorell R, Horta BL, Adair LS, Stein AD, Ritcher L, Fall C, et al. Weight gain in the rst two years of life is an important predictor of schooling outcomes in
pooled analyses from ve birth cohorts from low- and middle-income countries. J Nutr. 2010; 140(2): 348–54. https//doi.org/ 3945/jn.109.112300.
15. Quisumbing A, Smith L. Case study #4-5 of the program: food policy for developing countries: the role of govermentin the global food system; 2007.
Available from: https://ecommons.cornell.edu/handle/1813/55670. [cited 2020 Feb 1].
16. World Health Organization. Consejería para la alimentación del lactante y niño; 2009. Available from:
https://www.paho.org/hq/dmdocuments/2010/Consejeria%20para%20la%20Alimentacion%20del%20Lactante%20y%20del%20nino%20pequeno_Curso%
[cited 2020 Feb 1].
17. Morrow AL, Guerrero ML, Shults J, Calva J, Lutter C, Bravo J, et al. E cacy of home-based peer counselling to promote exclusive breastfeeding: a
randomised controlled trial. The Lancet. 1999; 353(9160): 1126-31. https://doi.org/ 10.1016/S0140-6736(98)08037-4.
18. Becerra BF, Rocha CL, Fonseca SD, Bermúdez GL. El entorno familiar y social de la madre como factor que promueve o di culta la lactancia materna. Fac.
Med. 2015: 63(2): 217-27. http://dx.doi.org/10.15446/revfacmed.v63n2.44051
19. Lok, KY, Bai, DL, Tarrant, M. Family members infant feeding preferences, maternal breastfeeding exposures and exclusive breastfeeding intentions.
Midwifery. 2017; 53: 49-4. https:// doi.org/10.1016/j.midw.2017.07.003.
20. Organización Mundial de la Salud. Lactancia materna exclusiva; 2019. Available from: https://www.who.int/elena/titles/exclusive_breastfeeding/es/.
[cited 2020 Feb 1].
21. Instituto Colombiano de Bienestar Familiar. Guías Alimentarias para menores de dos (2) años, mujeres gestantes y madres en periodo de lactancia.
Bogotá; 2018. Available from: https://www.icbf.gov.co/sites/default/ les/gabasmenor2anos_infogra a_2018.pdf. [cited 2020 Feb 1].
22. Haddad L, Alderman H, Appleton S, Song L, Yohannes Y. Reducing child malnutrition: How far does income growthtake us? World Bank Econ Rev. 2003;
17(1): 107-31.
23. Derso T, Tariku A, Biks GA, Wassie MM. Stunting, wasting and associated factors among children aged 6–24 months in Dabat health and demographic
surveillance system site: A community based cross-sectional study in Ethiopia. BMC Pediatr. 2017; 17: 96. https://doi.org/ 1186/s12887-017-0848-2.
24. Hong R, Banta JE, Betancourt JA. Relationship between household wealth inequality and chronic childhood under-nutrition in Bangladesh. Int J Equity
Health. 2006; 5:15. https://doi.org/ 1186/1475-9276-5-15.
25. Alderman H, Headey DD. How Important is Parental Education for Child Nutrition? World Dev. 2017; 94: 448–64.
https://doi.org/10.1016/j.worlddev.2017.02.007.
26. Butta, Z, Das JK, Rizvi A, Gaffey MF, Walker N, Horton S, et al. Evidence-based interventions for improvement of maternal and child nutrition. what can be
done and at what cost? Lancet. 382(9890): 452-77. https://doi.org/ 1016/S0140-6736(13)60996-4.
Figures
Page 11/13Figure 1
Intervention model applied to the bene ciaries of the study for 10 months
Figure 2
Distribution of study bene ciaries according to participation in the activities de ned for the intervention model
Page 12/13Figure 3
Marginals diagram strati ed presenting the probability of approaching or being in the appropriate growth channel
Supplementary Files
This is a list of supplementary les associated with this preprint. Click to download.
Additional le1.docx
Additional le2.docx
Additional le3.docx
Additional le4.docx
Page 13/13You can also read