QUARTERLY PROPERTY MARKET & ECONOMIC UPDATE - NEW ZEALAND QUARTER 4, 2018 - CORELOGIC
←
→
Page content transcription
If your browser does not render page correctly, please read the page content below
Quarterly Property Market
& Economic Update
New Zealand
Quarter 4, 2018
Contents
   About CoreLogic                                                                                                                                                                                                                                         3
           Executive Summary ......................................................................................................................................................................................................                        4

   Macro Economic and Demographic Indicators                                                                                                                                                                                                               5
           New Zealand Asset Classes .......................................................................................................................................................................................                               6
           NZ and Australia GDP growth .................................................................................................................................................................................                                   7
           New Zealand Population .............................................................................................................................................................................................                            8
           Migration .............................................................................................................................................................................................................................         9
           Regional Building Consents ......................................................................................................................................................................................                              10
           Consumer Confidence .................................................................................................................................................................................................                          10
           Employment ......................................................................................................................................................................................................................               11
           Lending Conditions .......................................................................................................................................................................................................                     12
           Interest Rates.....................................................................................................................................................................................................................            13

   Housing Overview                                                                                                                                                                                                                                       14
           Sales Volumes ..................................................................................................................................................................................................................               15
           Listings ................................................................................................................................................................................................................................      16
           Nationwide Values .........................................................................................................................................................................................................                    18
           House Price Index ...........................................................................................................................................................................................................                  19
           Rent .......................................................................................................................................................................................................................................   22
           Buyer Classification .......................................................................................................................................................................................................                   23

   Main Cities Housing Market Indicators                                                                                                                                                                                                                  24
           Auckland Market Activity ...........................................................................................................................................................................................                           26
           Auckland Values ..............................................................................................................................................................................................................                 27
           Auckland Suburb Value Change .............................................................................................................................................................................                                     28
           Current Auckland Suburb Values ...........................................................................................................................................................................                                     30
           Hamilton Market Activity ............................................................................................................................................................................................                          32
           Hamilton Values ..............................................................................................................................................................................................................                 33
           Tauranga Market Activity ............................................................................................................................................................................................                          34
           Tauranga Values ..............................................................................................................................................................................................................                 35
           Wellington Market Activity ........................................................................................................................................................................................                            36
           Wellington Values ...........................................................................................................................................................................................................                  37
           Christchurch Market Activity ....................................................................................................................................................................................                              38
           Christchurch Values .......................................................................................................................................................................................................                    39
           Dunedin Market Activity .............................................................................................................................................................................................                          40
           Dunedin Values ................................................................................................................................................................................................................                41

   CoreLogic Data and Analytics                                                                                                                                                                                                                           42
           CoreLogic Data and Analytics .................................................................................................................................................................................                                 42
           Legal Disclaimer ..............................................................................................................................................................................................................                42

2 | CoreLogic Quarterly Property Market & Economic Update New Zealand Q4 2018

    © Copyright 2018. CoreLogic and its licensors are the sole and exclusive owners of all rights, title and interest
    (including intellectual property rights) the CoreLogic Data contained in this publication. All rights reserved.
About CoreLogic

CoreLogic is a leading property information,                          Whilst all reasonable effort is made to ensure
analytics and services provider in the United States,                 the information in this publication is current,
Australia and New Zealand. CoreLogic helps clients                    CoreLogic does not warrant the accuracy, currency
identify and manage growth opportunities, improve                     or completeness of the data and commentary
performance and mitigate risk, by providing clients                   contained in this publication and to the full extent
with innovative, technology-based services and                        not prohibited by law excludes all loss or damage
access to rich data and analytics.                                    arising in connection with the data and commentary
                                                                      contained in this publication.

Contact
Call us 0800 355 355
Wellington office                                                     Auckland office
Level 2, 275 Cuba Street                                              Level 5
PO Box 4072                                                           41 Shortland Street
Wellington 6140                                                       Auckland 1010

Email: reports@corelogic.co.nz

www.corelogic.co.nz

                                                 CoreLogic Quarterly Property Market & Economic Update New Zealand Q4 2018 | 3

                                                        © Copyright 2018. CoreLogic and its licensors are the sole and exclusive owners of all rights, title and interest
                                                          (including intellectual property rights) the CoreLogic Data contained in this publication. All rights reserved.
Executive Summary
   NZ’s residential property market ended 2018 with                                                          Property values are generally rising, other than
   activity levels in general pretty subdued, but values                                                     continued sluggishness in Auckland (affordability
   showing reasonably consistent (albeit controlled)                                                         issues) and Christchurch (an even supply/demand
   growth across most of the country, with the exception                                                     balance). Average property values NZ-wide rose
   of Auckland and Christchurch, which both see                                                              by 3.2% annually in December, the 15th consecutive
   controlled flatness. Our expectation is that                                                              month of growth between 3-4%. The level now stands
   there’ll be more of the same this year.                                                                   at $682,938.

   In the macroeconomy, GDP growth cooled in Q3                                                              Government intervention in the property market will
   2018, ‘payback’ for the strength seen in Q2. Although                                                     be a key theme for 2019, particularly in terms of how
   the trend for GDP has slowed, growth is still decent                                                      it affects investors and construction activity. Starting
   and expected to stay at a respectable 21/2 -3% for a                                                      with investors, we don’t expect a mass exit from the
   while yet. In addition, although easing net migration                                                     sector, but the ring-fencing of rental property losses
   will provide a headwind for property in 2019, the                                                         for tax relief (due April) and the longer-term potential
   labour market remains very strong– providing a solid                                                      for some form of capital gains tax will have negative
   foundation for households to continue paying their                                                        effects on sentiment, and profits. Of course, property
   mortgages, and for property sales volumes and                                                             is still a trusted asset class and alternative options such
   values to hold up.                                                                                        as term deposits aren’t especially attractive at present.

   The interest rate environment looks likely to be                                                          Then in regards to construction, there’s the KiwiBuild
   supportive too. Barring an offshore shock, the                                                            scheme. It’s fair to say that there have been some
   likelihood that NZ’s OCR will remain on hold at 1.75%                                                     teething problems, but its success will be important
   until late 2020 bodes well for domestic mortgage                                                          to boosting housing supply in NZ, especially if pre-
   interest rates, especially since banks are operating in                                                   fabrication starts to take on a greater role.
   such a competitive environment. The recent loosening
                                                                                                             So all in all, while risks remain, the property market in
   of the LVR rules will probably also help market activity
                                                                                                             NZ is on a solid footing. Our expectation is that sales
   to some degree, but the prospect that banks may need
                                                                                                             volumes in 2019 will be similar to 2018, at 80,000-
   to hold more capital on their balance sheets in future
                                                                                                             85,000, with average values probably rising by around
   will limit their willingness to lend significantly greater
                                                                                                             that 3% figure again.
   amounts of money.
                                                                                                             As always, we keep a running monitor on the property
   In terms of the property market itself, sales activity
                                                                                                             market every week via our NZ Property Market Pulse
   at the end of 2018 remained fairly low. Within that
                                                                                                             articles, so be sure to check these out on our website
   slightly soft market, the key players were mortgaged
                                                                                                             http://www.corelogic.co.nz/news-research/all-news
   multiple property owners (MPOs) and first home
   buyers (FHBs), with ‘movers’ less active. The share of
   purchases going to FHBs in Q4 2018 was 23%, slightly
   down from Q3’s figure of 24%, but still on a par with
   previous peaks in 2006-07. Mortgaged MPOs (i.e.
   investors with a mortgage) are also slowly regaining
   their presence in the market, after LVR III in October
   2016 and the 40% deposit requirement that hit
   them hard.

4 | CoreLogic Quarterly Property Market & Economic Update New Zealand Q4 2018

    © Copyright 2018. CoreLogic and its licensors are the sole and exclusive owners of all rights, title and interest
    (including intellectual property rights) the CoreLogic Data contained in this publication. All rights reserved.
Macro Economic and
Demographic Indicators

                CoreLogic Quarterly Property Market & Economic Update New Zealand Q4 2018 | 5

                   © Copyright 2018. CoreLogic and its licensors are the sole and exclusive owners of all rights, title and interest
                     (including intellectual property rights) the CoreLogic Data contained in this publication. All rights reserved.
New Zealand Asset Classes

                        RESIDENTIAL REAL ESTATE                                                                         NEW ZEALAND LISTED STOCKS

                        $1.1 trillion                                                                                   $135 billion
                        ($260 billion in home loans)

                        COMMERCIAL/INDUSTRIAL REAL ESTATE                                                               NEW ZEALAND SUPER AND KIWISAVER

                        $212 billion                                                                                    $93 billion

   The value of residential property remains above one trillion dollars, a much bigger scale than other asset classes.
   Residential mortgages are secured against 24% of this value.

   The October falls across global share markets have not continued, but there’s still plenty of volatility and the
   NZX50 index (around 8,950) remains about 5% lower than it was in late September (approx. 9,400).

                                                                         Sources: CoreLogic NZ, Reserve Bank of NZ, NZX, NZ Super Fund, Financial Markets Authority

6 | CoreLogic Quarterly Property Market & Economic Update New Zealand Q4 2018

    © Copyright 2018. CoreLogic and its licensors are the sole and exclusive owners of all rights, title and interest
    (including intellectual property rights) the CoreLogic Data contained in this publication. All rights reserved.
NZ and Australia GDP growth
  1

                                                                                   New Zealand’s economy slowed in the third quarter of
                                                                                   the year, expanding by 0.3% from the previous three-
                                                                                   month period. The quarter before, GDP had expanded
                                                                                   by 1.0%, so the latest result probably reflected some
                                                                                   ‘payback’ for the previous strength. The manufacturing
                                                                                   sector had a weaker quarter in Q3 and contributed to
                                                                                   the overall slowdown.

                                                                                   Economic growth also continues to slow on an annual
                                                                                   basis, albeit the latest figure of more than 2.5% is
                                                                                   hardly a disaster .The economy does however look
                                                                                   set to slow further in the coming year or two and,
                                                                                   notably, dip below Australia’s performance. That could
                                                                                   drive NZ’s net migration figure down even further and
                                                                                   would be a headwind for the housing market in 2019
                                                                                   and 2020.

Source: Reserve Bank of New Zealand, Capital Economics

                                                         CoreLogic Quarterly Property Market & Economic Update New Zealand Q4 2018 | 7

                                                            © Copyright 2018. CoreLogic and its licensors are the sole and exclusive owners of all rights, title and interest
                                                              (including intellectual property rights) the CoreLogic Data contained in this publication. All rights reserved.
New Zealand Population
                         Quarterly Change in National Population
                                  (persons per quarter)
   2
                                                                                                                           Population growth eased a little further in Q3 2018,
                                                                                                                           with the annual rate dipping from 1.90% in Q2 to 1.84%.
                                                                                                                           That is the slowest rate for almost four years and acts
                                                                                                                           as a dampening influence on the housing market.

                                                                                                                           Net migration remains the key driver of the overall
                                                                                                                           slowdown. In the year to Q3 2018, net migration was
                                                                                                                           62,700, down by more than 8,000 (12%) from the
                                                                                                                           figure a year earlier of around 71,000.

                                                                                                                           Additionally, natural population growth has also
                                                                                                                           slowed a bit over the past year, by 400 people
                                                                                                                           (from 27,100 in the year to Q3 2017 to 26,700 in
                                                                                                                           the year to Q3 2018).

           Population Change Composition (persons per quarter)
   3

  4
                          Annual Change in Population (persons)

                                                                                                                                                      Source: Statistics New Zealand

8 | CoreLogic Quarterly Property Market & Economic Update New Zealand Q4 2018

       © Copyright 2018. CoreLogic and its licensors are the sole and exclusive owners of all rights, title and interest
       (including intellectual property rights) the CoreLogic Data contained in this publication. All rights reserved.
Migration
5
             Long Term Migration (people per month)

                                                                             The net flow of new migrants into New Zealand
                                                                             remains high but is on a clear downwards trend. In the
                                                                             year to October, net migration was 61,751, still higher
                                                                             than any level seen prior to October 2015, but much
                                                                             lower than the peak of 72,402 in July 2017. Lower
                                                                             flows of new residents into New Zealand will mean less
                                                                             upwards pressure on housing demand than in the past.

                                                                             Within that overall picture, arrivals of new residents
                                                                             have stayed pretty high (but they are slowly drifting
                                                                             downwards), so the drop in the net migration balance
                                                                             has been driven mostly by rising departures of existing
                                                                             residents. In the year to October, departures from New
                                                                             Zealand were 66,372 – significantly higher than the
                                                                             figure a year earlier of 60,950.

                                                                             Given that many of the new migrants over the past
                                                                             few years have entered on time-limited visas (such as
                                                                             student or temporary work) it’s almost inevitable that
        Monthly Net Migration Between NZ and Australia                       departures will continue to rise as their visas expire,
                                                                             which will further pull down the net total in the
6                    (people per month)
                                                                             coming months.

                                                                             In addition, as noted earlier, the economic prospects
                                                                             in Australia are starting to look a little brighter
                                                                             (although their housing market downturn is a risk
                                                                             to that outcome), so this will also tend to keep
                                                                             downwards pressure on NZ’s net migration balance
                                                                             as more people are attracted to cross the Tasman.

                                                                             The path for the trans-Tasman migration balance is
                                                                             something we’ll be watching closely again in 2019,
                                                                             because when it has turned down in the past it has
                                                                             tended to drop very quickly – and it also tends to
                                                                             affect the regions more than the main centres.

                                                                                 Net gain last year                                    % change
    TOTAL ALL AREAS                                                                       62,733                                           -11.6%
    Auckland region                                                                        31,417                                          -13.7%
    Hamilton City                                                                          1,887                                           -2.0%
    Tauranga City                                                                           735                                           -24.1%
    Wellington                                                                             2,917                                          -16.7%
    Christchurch City                                                                      4,722                                          -13.5%
    Dunedin City                                                                            899                                            -15.2%
    Main Urban Area (Other)                                                                4,719                                          -14.3%
    Rural Centres                                                                          3,713                                          -23.0%
    Not applicable/not stated                                                              11,724                                           3.4%

Source: Statistics New Zealand

                                                CoreLogic Quarterly Property Market & Economic Update New Zealand Q4 2018 | 9

                                                      © Copyright 2018. CoreLogic and its licensors are the sole and exclusive owners of all rights, title and interest
                                                        (including intellectual property rights) the CoreLogic Data contained in this publication. All rights reserved.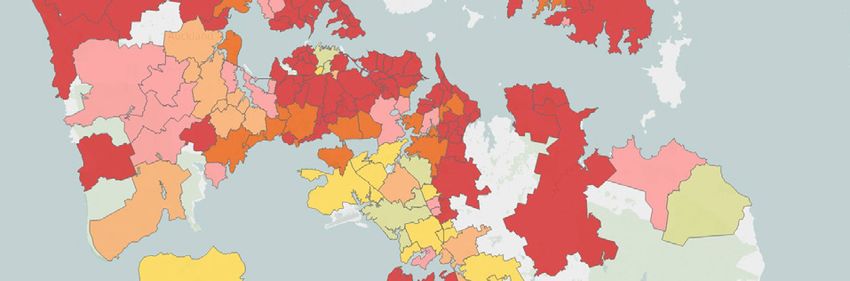
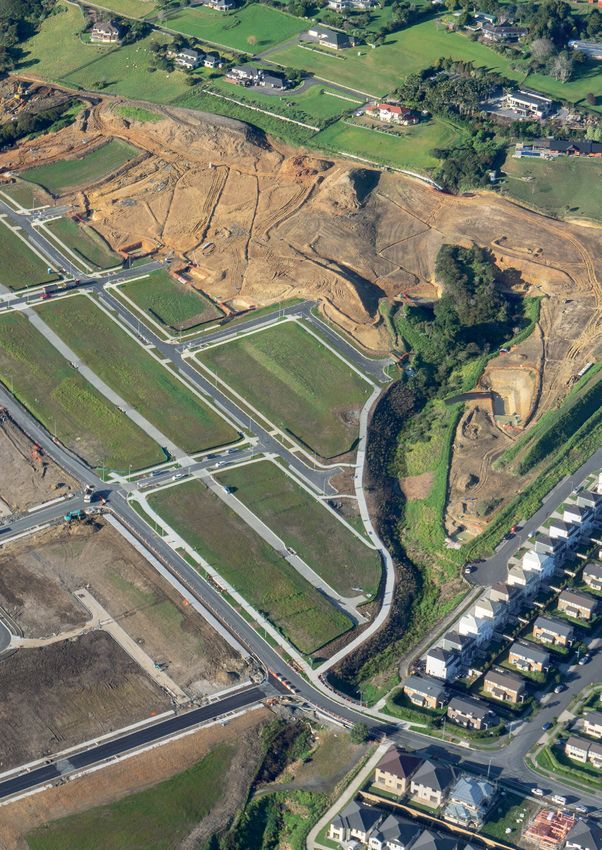
Regional Building Consents
    7
           New Dwelling Consents Trend (consents per month)

                                                                                                                        There has been no let-up for residential building
                                                                                                                        consents in the past three months, with Statistics
                                                                                                                        NZ’s trend measure (which smooths out seasonal and
                                                                                                                        other fluctuations) showing that almost 32,900 new
                                                                                                                        dwellings were approved in the year to November
                                                                                                                        2018, another improvement on the figure of 32,668
                                                                                                                        in the year to August. At 32,877, this measure is now
                                                                                                                        at its highest level in the 23-year history of this
                                                                                                                        time series.

                                                                                                                        The increase in consents generally continues to be
                                                                                                                        driven by Auckland, although activity in the Waikato
                                                                                                                        and Canterbury regions has also perked up a little
                                                                                                                        in the past few months. By property type, the shift
                                                                                                                        towards building smaller properties (e.g. apartments
                                                                                                                        and townhouses) has continued, which has to be a
                                                                                                                        good thing from the point of view of reducing the
                                                                                                                        pressure on our housing supply.
   Source: Statistics New Zealand
                                                                                                                        In Auckland, consents are widely estimated to now be
                                                                                                                        high enough to at least stop the shortfall of housing
                                                                                                                        from getting any worse, although at CoreLogic we
                                                                                                                        are more wary of that conclusion – after all, many
                                                                                                                        of the new consents are going into infill housing (i.e.
                                                                                                                        knocking down an old property and putting up a
                                                                                                                        new one), which actually doesn’t change the overall
                                                                                                                        number of existing properties. And even if the shortfall
                                                                                                                        has stopped getting worse, it’ll still take many years
                                                                                                                        of strong construction activity to bring it down
                                                                                                                        significantly. KiwiBuild could well have a key role
                                                                                                                        to play in that push to reduce the shortfall.

   Consumer Confidence
    8   ANZ-Roy Morgan Confidence Consumer (index, monthly)                                                             After dipping to a weak reading of 115.4 in October last
                                                                                                                        year, consumer confidence on the ANZ-Roy Morgan
                                                                                                                        measure improved in November and rose again in
                                                                                                                        December to an above-average figure of 121.9.
                                                                                                                        That was a similar reading to December 2017.

                                                                                                                         With fuel prices having dropped back, unemployment
                                                                                                                        still very low, and mortgage interest rates also staying
                                                                                                                        steady (and low), it’s not hard to find reasons for the
                                                                                                                        decent consumer confidence figures. At the margin, if
                                                                                                                        households are optimistic, this could help to stimulate
                                                                                                                        a bit more activity in the housing market.

   Source: ANZ NZ, Roy Morgan

10 | CoreLogic Quarterly Property Market & Economic Update New Zealand Q4 2018

    © Copyright 2018. CoreLogic and its licensors are the sole and exclusive owners of all rights, title and interest
    (including intellectual property rights) the CoreLogic Data contained in this publication. All rights reserved.
Employment
Annual Change in Employment, Full Time and Part Time
9
The slowdown in employment growth continued in
Q3 2018, with the figure falling from 3.3% in Q2 to 3.1%
(Stats NZ trend measure). That was the lowest figure
since Q1 2016. However, that was mostly due to part-
time employment, which slowed from 1.1% to 0.5%.
The full-time growth rate only dipped slightly from
3.9% to 3.8%.
Moreover, when employment has already risen so
much and most people already have a job, it’s not
possible to keep growth up at the same rates as
before. Indeed, the labour force participation rate
(i.e. the share of the working age population that are
active in the labour market, either employed or looking
for work) is 71.1%, on a par with record highs over the
past 30 years. On top of that, the unemployment rate
dropped to 3.9% in Q3, the lowest since Q2 2008.
Overall, then, it’s clear that the labour market is
10
Labour Force Participation Rate (%) still strong and will provide a solid foundation for
the property market in 2019, both in terms of sales
volumes and property values. Indeed, with most
people in work, the risks of mortgage default and
forced property sales are low.
11 Unemployment Rate (%)
Source: Statistics New Zealand
CoreLogic Quarterly Property Market & Economic Update New Zealand Q4 2018 | 11
© Copyright 2018. CoreLogic and its licensors are the sole and exclusive owners of all rights, title and interest
(including intellectual property rights) the CoreLogic Data contained in this publication. All rights reserved.Lending conditions
Annual
15
Change in Gross New Lending Flows ($m per month)
Gross new lending has continued to expand year-
on-year, with November’s rise the eighth consecutive
monthly increase. There was $6.2bn of new lending
in November, $930m higher than the same month
a year ago.
The more detailed breakdown of the data showed that
owner-occupiers drove November’s rise, with lending
of $5.1bn. Lending to investors was $1.1bn in November,
basically unchanged from a year ago. By loan type,
the figures showed that interest-only lending remains
modest, accounting for only 29% of the total in
November. By contrast, in May 2016 that figure
was 41%.
The rise in lending flows hasn’t been about banks
running closer to the (old) LVR speed limits. In
November, 9.2% of lending to owner-occupiers was
High LVR Lending to Owners and Investors >80% LVR (speed limit 15%) and 0.5% to investors was
16 (% of new lending) >65% LVR (speed limit 5%). Instead, it would appear
that there’s some self-selection going on amongst
borrowers – i.e. only the best are actually applying for
a mortgage, so approval rates are rising, even though
the deposit, income/expense, and repayment stress-
testing criteria remain stringent.
December’s lending figures (set to be released on
29th January) will be the last ones that relate to the
old LVR speed limits, which from 1st January have
been relaxed – a 20% speed limit for owner-occupiers
with less than a 20% deposit, and a 5% speed limit
for investors with less than a 30% deposit.
With more than 80% of mortgage debt in NZ on a
fixed interest rate, household finances look relatively
resilient and the scene is set for lending activity to
continue to improve in 2019. But cautious attitudes
from the banks mean that any rises are more likely
to be subdued than stellar – not least because of the
17 Refinancing Profile for Mortgages (% of stock) looming (probable) requirement from the RBNZ that
they hold extra capital on their balance sheets.
Source: Reserve Bank of New Zealand
12 | CoreLogic Quarterly Property Market & Economic Update New Zealand Q4 2018
© Copyright 2018. CoreLogic and its licensors are the sole and exclusive owners of all rights, title and interest
(including intellectual property rights) the CoreLogic Data contained in this publication. All rights reserved.Interest Rates
Mortgage Interest Rates (%)
12
The official cash rate (OCR) remains at 1.75% and
any increase in the OCR seems a long way away,
potentially not until the end of 2020 or even early
2021. In fact, there’s still a chance that the next move
in the OCR is actually a cut rather than a rise, and
comes sooner than late 2020.
This indicates a benign environment for borrowers.
Indeed, domestic mortgage rates are likely to stay
low and stable in 2019, particularly given that banks
are still fighting hard to attract the best borrowers in
the current low-turnover property market. However,
it’s always worth keeping an eye on the overseas
money markets, and the risk that higher offshore
borrowing costs flow through to NZ rates over the
next 6-12 months can’t be ruled out.
On balance, although the mortgage rate “wars”
13
Official Cash Rate and Mortgage Rates (%) haven’t lasted, we doubt that significantly higher
mortgage rates are on the horizon in NZ. Of course,
to access the attractive rates, new borrowers still have
to have raised a sizeable deposit and be able to prove
that they could still service the mortgage even if rates
went to 7% or 8%.
14 Average Two Year Fixed Rates (%)
Sources: Reserve Bank of New Zealand and
interest.co.nz
13 | CoreLogic Quarterly Property Market & Economic Update New Zealand Q4 2018
© Copyright 2018. CoreLogic and its licensors are the sole and exclusive owners of all rights, title and interest
(including intellectual property rights) the CoreLogic Data contained in this publication. All rights reserved.Housing Overview
Sales Volumes
     Nationwide Sales Volumes (monthly total)

                                                                      Sales volumes ended 2018 at a low level, down by
                                                                      about 6% from a year earlier. However, we suspect
                                                                      the market isn’t as weak as that figure might suggest.
                                                                      First, note that listings are generally pretty low across
                                                                      the country – and even with demand still healthy, you
                                                                      can’t buy anything if property isn’t listed for sale.

                                                                      Second, sales previously spiked up by 15% in October,
                                                                      just in advance of the foreign buyer ban. In other
                                                                      words, it would seem that some sales which otherwise
                                                                      might have happened in December were instead
                                                                      rushed through in October. Given that most indicators
                                                                      suggest foreign buyers have been a relatively small
                                                                      part of the overall market (except for Queenstown
                                                                      and central Auckland), we don’t expect the ban to
                                                                      majorly reduce overall volumes – indeed, the removal
                                                                      of a foreign buyer may just mean that a domestic
                                                                      buyer can get into the market instead.
  Nationwide Annual Change in Sales Volumes (%)
                                                                      Around the main centres, most have seen pretty
                                                                      stable sales volumes compared to a year ago,
                                                                      although Auckland and Dunedin recorded small annual
                                                                      drops at the end of 2018, and Hamilton a big rise.

  Regional Sales Volumes (year-on-year change)

                                     CoreLogic Quarterly Property Market & Economic Update New Zealand Q4 2018 | 15

                                         © Copyright 2018. CoreLogic and its licensors are the sole and exclusive owners of all rights, title and interest
                                           (including intellectual property rights) the CoreLogic Data contained in this publication. All rights reserved.
Listings
New Listings (weekly)
As per normal over the Christmas and New Year
break, new listings dropped to very low levels. But
we can still usefully look at the annual changes and
interestingly, Otago’s new listings rose quite strongly,
potentially suggesting that rising values are prompting
some people to list and ‘cash in’.
New Listings Average last 3 weeks 1 month change 1 year change
New Zealand 591 -67% -9%
Auckland 142 -69% -16%
Waikato 76 -61% -16%
Bay Of Plenty 57 -65% 4%
Wellington 38 -69% -25%
Canterbury 74 -70% -2%
Otago 37 -70% 31%
16 | CoreLogic Quarterly Property Market & Economic Update New Zealand Q4 2018
© Copyright 2018. CoreLogic and its licensors are the sole and exclusive owners of all rights, title and interest
(including intellectual property rights) the CoreLogic Data contained in this publication. All rights reserved.Total Listings
Total listings across NZ are only 3% higher than a
year ago, which was itself a very low level. Wellington
stands out, with total listings actually 11% down on a
year earlier, helping to support property value growth
in the capital. By contrast, Auckland’s listings have
risen again year-on-year, which helps to explain soft
values there.
The rise in new listings in Otago shows up in total
listings too (a 12% annual rise), suggesting that things
may potentially start to get a bit easier for prospective
buyers in the early stages of 2019.
Total Listings Latest week 1 month change 1 year change
New Zealand 28,735 -5% 3%
Auckland 9,667 -6% 11%
Waikato 3,127 -1% 6%
Bay Of Plenty 2,136 -3% 5%
Wellington 1,187 -19% -11%
Canterbury 4,477 -6% 1%
Otago 1,192 1% 12%
CoreLogic Quarterly Property Market & Economic Update New Zealand Q4 2018 | 17
© Copyright 2018. CoreLogic and its licensors are the sole and exclusive owners of all rights, title and interest
(including intellectual property rights) the CoreLogic Data contained in this publication. All rights reserved.Nationwide Values
Average Value of Housing Stock – New Zealand ($)
Average property values across NZ continue
to muddle along, neither accelerating strongly
nor slowing to any notable degree. In December,
values were 3.2% higher than a year earlier – the
15th consecutive month where annual growth has
been in the tight range of 3-4%. The stable growth
reflects conflicting pressures – e.g. the downward
influence of slowing population growth, against
upward factors of still-low mortgage rates and
an undersupply of properties.
The national average property value now stands
at $682,938, up by $21,097 from December 2017.
Annual and Quarterly Change in Value (%)
18 | CoreLogic Quarterly Property Market & Economic Update New Zealand Q4 2018
© Copyright 2018. CoreLogic and its licensors are the sole and exclusive owners of all rights, title and interest
(including intellectual property rights) the CoreLogic Data contained in this publication. All rights reserved.House Price Index
Average Dwelling Value ($)
Wellington and Dunedin continue to outperform the
other main centres, with average property values up
by 3.2% and 3.5% respectively over the past three
months, and by 7.8% and 11.2% over the past year.
Low levels of listings in both those markets are
pushing up prices. Tauranga and Hamilton are middle
of the pack, with growth of 3.9% and 5.0% in 2018.
Meanwhile, Christchurch and Auckland have stayed
pretty flat, with values edging up by 0.6% and edging
down by 0.4% respectively. In Auckland, the main
constraint is the low affordability of property, while
in Christchurch it’s a balanced supply/demand picture.
December 2018
Current value 3 months 12 months Since Peak
New Zealand $682,938 1.2% 3.2% 65%
Auckland $1,048,145 0.1% -0.4% 92%
Hamilton $570,886 -0.2% 5.0% 58%
Tauranga $720,645 1.6% 3.9% 50%
Wellington $688,074 3.2% 7.8% 51%
Christchurch $496,562 0.5% 0.6% 31%
Dunedin $434,903 3.5% 11.2% 52%
Source: CoreLogic NZ QV Monthly House Price Index
CoreLogic Quarterly Property Market & Economic Update New Zealand Q4 2018 | 19
© Copyright 2018. CoreLogic and its licensors are the sole and exclusive owners of all rights, title and interest
(including intellectual property rights) the CoreLogic Data contained in this publication. All rights reserved.House Price Index
Annual Value Change (%)
Over the past 12 months, the stability for property
values in and around Canterbury and Auckland is clear
on a map view, as is the relatively consistent growth
across most of the rest of NZ. Stronger markets can
be seen in the central and lower North Island (e.g. in
Manawatu-Whanganui).
*Size of bubble represents the number of properties in the Territorial Authority
20 | CoreLogic Quarterly Property Market & Economic Update New Zealand Q4 2018
© Copyright 2018. CoreLogic and its licensors are the sole and exclusive owners of all rights, title and interest
(including intellectual property rights) the CoreLogic Data contained in this publication. All rights reserved.Three Month Value Change (%)
Looking at a timelier three-month change in values,
Canterbury and Auckland again look flat. There are
spots of weakness on the West Coast, but by contrast
pockets of strength in Southland and across the
central and lower North Island.
*Size of bubble represents the number of properties in the Territorial Authority
CoreLogic Quarterly Property Market & Economic Update New Zealand Q4 2018 | 21
© Copyright 2018. CoreLogic and its licensors are the sole and exclusive owners of all rights, title and interest
(including intellectual property rights) the CoreLogic Data contained in this publication. All rights reserved.Rent
30
Nationwide Annual Change in Value and Rent (%)
In the three months to December 2018, national rents
averaged $421 per week, up by 5.1% from the same
period ($401) a year earlier. Landlords are facing extra
operational costs at present (e.g. the requirement
for better insulation), but at the same time any rises
in rents that they’d like to push through are capped
simply by how much tenants can afford to pay –
bear in mind that a vacancy, even for only a short
period of time, can completely negate the benefit
that might have been gained through a rent rise.
At $573 per week, Queenstown-Lakes’ rents are the
highest in the country, with the lowest to be found
in the Tararua District.
National gross rental yields were basically unchanged
again in the past three months, at 3.2%. They’ve now
been either 3.1% or 3.2% for the past 30 months – i.e.
Gross Rental Yield – Nationwide (%) over that period, rents and values have more or less
31 been changing in line with each other. At those levels,
gross yields are relatively low, given that landlords still
have to deduct debt servicing and other operating
costs from their gross return.
Rents are rising across all of the main centres,
especially in Wellington (7.9%) and Hamilton (6.2%).
Growth in Tauranga and Christchurch also exceeds
4%. When it comes to the level of yields, however,
Dunedin stands out amongst the main centres, with
yields above 4% – by contrast, Auckland stands at
just 2.2%.
Med Weekly Rent Ann chg rent Gross yield
Auckland $527 2.9% 2.2%
Hamilton $378 6.2% 3.4%
Tauranga $454 4.8% 3.3%
Wellington $485 7.9% 3.1%
Christchurch $355 4.3% 3.7%
Dunedin $360 1.8% 4.3%
Sources: CoreLogic NZ and MBIE
22 | CoreLogic Quarterly Property Market & Economic Update New Zealand Q4 2018
© Copyright 2018. CoreLogic and its licensors are the sole and exclusive owners of all rights, title and interest
(including intellectual property rights) the CoreLogic Data contained in this publication. All rights reserved.Buyer Classification
Buyer Classification – New Zealand (% of sales)
The share of sales going to first home buyers (FHBs)
ticked down a touch in Q4 2018, from 24% in Q3
to 23%. However, this was still a strong result, on a
par with high levels not seen since 2007. FHBs also
continue to match the market share of mortgaged
multiple property owners (MPOs) – i.e. investors – a
feature never really seen before. Despite high prices,
FHBs are clearly still finding ways into the market,
helped along by a willingness to compromise on
location/property type and access to KiwiSaver for
the deposit. Their ability to buy will also be helped
in 2019 by the fact that banks can now advance 20%
(previously 15%) of their owner-occupier lending to
borrowers with less than a 20% deposit.
The mortgaged MPOs have also held their ground
in recent months, despite the extra pressure on them
from the Government (e.g. Healthy Homes, potential
capital gains/income tax, looming tax ring-fence
for losses). Their share of activity had increased to
24% by the end of the year, matching the levels last
NZ Property Transfers by Non-Citizens or seen in mid-2017. We also see little evidence that
no Resident Visa (% of total transfers) existing investors are selling their portfolios to any
26
great degree.
It will be interesting to see what happens to the
market share for cash MPOs in 2019. Over the past
few years, this group have slowly raised their share
of activity, but given that a subset of the cash MPO
group are overseas buyers (which are a subset of
other buyer groups too), the ban on their purchases
may see the overall share for cash MPOs dip in the
coming months. Another indicator to watch for here
will be Stats NZ’s figures on property transfers in Q4
2018 involving people without a residency visa or NZ
citizenship, due out on 8th February.
Finally, movers (i.e. existing owner-occupiers who
are shifting house) were generally less active in 2018
than previous years, with their share falling to 26%
in Q4 – a level lower than any quarter in almost 10
years. The high cost to trade up, both in terms of the
higher price for a newer/larger house as well as legal/
moving expenses, will be a key factor keeping existing
owners where they are. We also know from high levels
of building consents for renovation that owners are
altering rather than moving – perhaps because they
are already at the upper limit of what they can
safely borrow.
Source: Statistics New Zealand
CoreLogic Quarterly Property Market & Economic Update New Zealand Q4 2018 | 23
© Copyright 2018. CoreLogic and its licensors are the sole and exclusive owners of all rights, title and interest
(including intellectual property rights) the CoreLogic Data contained in this publication. All rights reserved.Main Cities Housing Market Indicators
Auckland Market Activity
                    Buyer Demand – Auckland (volume index)

                                                                                                                        Market activity in Auckland is below the levels a
                                                                                                                        year ago, with high numbers of listings on the market
                                                                                                                        meaning that prospective buyers don’t have to rush.
                                                                                                                        Although activity may have reached a floor there
                                                                                                                        aren’t any obvious signs that it is about to start
                                                                                                                        rising significantly again.

                                                                                                                        Within that relatively quiet market, the biggest change
                                                                                                                        in recent months has been from first home buyers
                                                                                                                        (FHBs), who have raised their share of purchases from
                                                                                                                        23% a year ago to 26% now. So despite high prices
                                                                                                                        and low affordability, this illustrates just how keen
                                                                                                                        FHBs still are to buy, helped along by access to
                                                                                                                        their KiwiSaver funds for a deposit.

                                                                                                                        By contrast, the share of purchases made by movers
                                                                                                                        has dipped to a historically low level (23%), with
                                                                                                                        this group facing no real pressure or having much
                                                                                                                        incentive to be active in the market. Instead of
                   Buyer Classification – Auckland (% of sales)                                                         spending the real estate agent fees and other
                                                                                                                        moving costs, many of this group are choosing
                                                                                                                        to stay put and renovate instead.

                                                                                                                        Investors have also been largely treading water in the
                                                                                                                        past few months, with the market share for mortgaged
                                                                                                                        multiple property owners (MPOs) flat at 26% and cash
                                                                                                                        MPOs hovering at 12-13%. No doubt some investors are
                                                                                                                        just biding their time to try and find the right property,
                                                                                                                        in a market where capital gains have diminished and
                                                                                                                        yields are at low levels.

26 | CoreLogic Quarterly Property Market & Economic Update New Zealand Q4 2018

    © Copyright 2018. CoreLogic and its licensors are the sole and exclusive owners of all rights, title and interest
    (including intellectual property rights) the CoreLogic Data contained in this publication. All rights reserved.
Auckland Values
Average Value of Housing Stock – Auckland ($)
Both the quarterly and annual growth rates for
average Auckland property values continue to
fluctuate around zero, as they did for pretty
much all of 2018.
In the past three months, Manukau has seen values
increase by almost 1%, while North Shore on the other
hand has seen a small drop of 0.3%. The spread across
Auckland on a 12-month comparison is reasonably
even, with growth ranging in a tight band from -1.1%
in North Shore to 1.2% in Manukau.
Annual and Quarterly Value Change – Auckland (%)
December 2018
Current value 3 months 12 months Since Peak
Rodney $950,940 0.1% 1.1% 62%
North Shore $1,212,664 -0.3% -1.1% 88%
Waitakere $822,906 -0.2% -0.2% 94%
Auckland City $1,233,311 -0.1% -1.0% 98%
Manukau $906,658 0.9% 1.2% 98%
Papakura $701,230 0.2% 0.6% 95%
Franklin $673,679 0.5% 1.1% 70%
CoreLogic Quarterly Property Market & Economic Update New Zealand Q4 2018 | 27
© Copyright 2018. CoreLogic and its licensors are the sole and exclusive owners of all rights, title and interest
(including intellectual property rights) the CoreLogic Data contained in this publication. All rights reserved.Auckland Suburb Value Change
Riverhead
Albany
Paremoremo
Huapai
Waimauku
Kumeu
Whenuapai
Northcote Point
Massey Te Atatu Peninsula
Waitakere
Swanson
Henderson Valley
Mount Wellington
Oratia Hillsborough
Waiatarua Green Bay Lynfield
Titirangi
Piha
Laingholm
Mangere
Ma
Huia
Wiri
Manukau Heads
28 | CoreLogic Quarterly Property Market & Economic Update New Zealand Q4 2018
© Copyright 2018. CoreLogic and its licensors are the sole and exclusive owners of all rights, title and interest
(including intellectual property rights) the CoreLogic Data contained in this publication. All rights reserved.Property values across Auckland as a whole were
basically stable in 2018. But that doesn’t mean that
all suburbs have followed that pattern. As a broad
generalisation, areas to the South and West have
been more likely to have increased modestly, while
those to the north and east have been more subdued.
Of course, many suburbs across Auckland have simply
seen no change in values.
Oneroa
Ostend
Surfdale Onetangi Waiheke Island
Omiha
Maraetai
Beachlands
East Tamaki Heights
Kawakawa Bay
Flat Bush
Clevedon
anukau
Orere Point
Takanini
*Size of bubble represents the
number of properties in the suburb.
Based on CoreLogic Median E-valuer
Pahurehure Red Hill
CoreLogic Quarterly Property Market & Economic Update New Zealand Q4 2018 | 29
© Copyright 2018. CoreLogic and its licensors are the sole and exclusive owners of all rights, title and interest
(including intellectual property rights) the CoreLogic Data contained in this publication. All rights reserved.Current Suburb Values:
‘Mapping the Market’
Auckland Suburb Values 2018 ($)
Over the past five years, almost all parts of the country have seen large rises in property values. CoreLogic’s interactive
‘Mapping the Market’ product (– www.corelogic.co.nz\mapping-market) shows these changes across the country, it’s freely
available and updated quarterly. The heatmaps in ‘Mapping the Market’ are point-in-time snapshots from 2013 and 2018.
Auckland is illustrated in the heatmap. There are no longer any suburbs with a median property value below $500,000
in Auckland. Five years ago 19.8% of all suburbs were below that threshold. In addition, five years ago, 10.9% of suburbs
had a median property value greater than $1 million. Today that stands at about half (49.3%).
*Based on CoreLogic Median E-valuer
30 | CoreLogic Quarterly Property Market & Economic Update New Zealand Q4 2018
© Copyright 2018. CoreLogic and its licensors are the sole and exclusive owners of all rights, title and interest
(including intellectual property rights) the CoreLogic Data contained in this publication. All rights reserved.CoreLogic Quarterly Property Market & Economic Update New Zealand Q4 2018 | 31
© Copyright 2018. CoreLogic and its licensors are the sole and exclusive owners of all rights, title and interest
(including intellectual property rights) the CoreLogic Data contained in this publication. All rights reserved.Hamilton Market Activity
Buyer Demand – Hamilton (volume index)
Buyer demand has flattened off in Hamilton, albeit
at levels well below those seen in 2015 and 2016.
In terms of the different buyer groups, first home
buyers (FHBs) enjoyed a good year in Hamilton in
2018, albeit their share of purchases dipped away a
bit in the last quarter of the year (having been up at
27% in Q3). At 25% in the final quarter, FHBs’ share
was the same as movers in Hamilton.
Cash multiple property owners (MPOs) enjoyed a
reasonably stable share of purchases throughout 2018,
but it’ll be interesting to see how the foreign buyer
ban might affect those figures in 2019 (not just in
Hamilton but everywhere around the country).
After a soft patch in the middle of the year, mortgaged
MPOs enjoyed a strong rise in their share of purchases
in Q4 2018, and at 30%, the figure is as high as it’s
Buyer Classification – Hamilton (% of sales) been since early 2017. This suggests that investors
in Hamilton are not fretting to any great degree
about extra costs being imposed on them by
the government.
32 | CoreLogic Quarterly Property Market & Economic Update New Zealand Q4 2018
© Copyright 2018. CoreLogic and its licensors are the sole and exclusive owners of all rights, title and interest
(including intellectual property rights) the CoreLogic Data contained in this publication. All rights reserved.Hamilton Values
Average Value of Housing Stock – Hamilton ($)
Hamilton’s property values ended 2018 on a softer
note, reducing by a minor 0.2% in the final three
months of the year. However, at 5%, the annual
growth rate remains pretty decent.
The softer end to the year reflected weakness in
Hamilton North East, where values were down by
1.8%. Central & North West and South West were
basically flat, with the shining light for the city being
the South East (with a gain of 1.8%). Over the full year,
however, the strongest gain was actually in Central
& North West (7.0%).
Annual and Quarterly Value Change – Hamilton (%)
December 2018
Current value 3 months 12 months Since Peak
Hamilton Central & North West $528,155 -0.1% 7.0% 48%
Hamilton North East $713,105 -1.8% 3.0% 59%
Hamilton South East $525,172 1.8% 6.0% 50%
Hamilton South West $510,288 0.5% 5.0% 49%
CoreLogic Quarterly Property Market & Economic Update New Zealand Q4 2018 | 33
© Copyright 2018. CoreLogic and its licensors are the sole and exclusive owners of all rights, title and interest
(including intellectual property rights) the CoreLogic Data contained in this publication. All rights reserved.Tauranga Market Activity
Buyer Demand – Tauranga (volume index)
Similar to Hamilton, buyer demand in Tauranga has
flattened off (i.e. stopped falling), but of course at a
much lower level than in 2016 and 2016.
Looking at the various buyer groups, Tauranga is quite
different to other main centres. Here, movers dominate
the market, and accounted for 35% of purchases in Q4
2018, up from 32% a year earlier.
Also by contrast to other parts of the country,
mortgaged multiple property owners (MPOs) had
another soft year in Tauranga in 2018. At 20% in the
final quarter, their share of purchases was down from
23% a year earlier – for context, the comparative NZ-
wide figures were 23% in Q4 2017 and rising to 24%
by Q4 2018.
With movers (who often have significant amounts
of equity behind them) dominant in Tauranga, first
home buyers (FHBs) find things a little harder, only
Buyer Classification – Tauranga (% of sales) accounting for 18% of purchases in Q4 2018 (NZ-
wide figure was 23%), unchanged from a year ago.
34 | CoreLogic Quarterly Property Market & Economic Update New Zealand Q4 2018
© Copyright 2018. CoreLogic and its licensors are the sole and exclusive owners of all rights, title and interest
(including intellectual property rights) the CoreLogic Data contained in this publication. All rights reserved.Tauranga Values
Average Value of Housing Stock – Tauranga ($)
After a bit of an up and down year for values in
Tauranga in 2018, the final few months ended on
a stronger note. Values were up by 1.6% in the three
months to December, helping to lift the annual rate
from its lull of 1% in mid-2018 to 4% by the end.
Annual and Quarterly Value Change – Tauranga (%)
CoreLogic Quarterly Property Market & Economic Update New Zealand Q4 2018 | 35
© Copyright 2018. CoreLogic and its licensors are the sole and exclusive owners of all rights, title and interest
(including intellectual property rights) the CoreLogic Data contained in this publication. All rights reserved.Wellington Market Activity
Buyer Demand – Wellington (volume index)
Activity levels have quitened down a bit in Wellington
in the past few months, which might seem odd given
the buoyancy of this market. However, this can be
explained by the lack of listings – sales volumes are
being held back a little simply because there’s not
much listed for purchase.
Looking at buyer classification, the two key stories
in Wellington are, the keen interest from first home
buyers (FHBs) and mortgaged multiple property
owners (MPOs), and also how that contrasts with
low activity from movers.
Starting with FHBs, 2018 was a strong year for
Wellington, with FHBs’ share peaking at 33% in the
first quarter of the year. Back in 2006 and 2007, peaks
were lower at around 30%. Although their share of
activity eased back for the rest of 2018, it was always
30% or more. Again, KiwiSaver funds for the deposit
will have helped FHBs in Wellington, along with a
Buyer Classification – Wellington (% of sales) willingness to live further away from the CBD – note
that in Q4, FHBs accounted for 34% of purchases
in Porirua and 35% in Lower Hutt.
Meanwhile, from a low 24% in Q4 2017, mortgaged
MPOs had increased their share of purchases in
Wellington to 26% by the end of 2018 – that was
a two year high. Investors have clearly been seeing
enough opportunities to buy into future capital
(and/or rental) gain or on a decent current yield.
By contrast, movers’ share of the market dipped to
20% in Q4 2018, the lowest level since at least 2005.
Along with the high costs to move house (e.g. legal
and agency fees), many existing owner-occupiers
in Wellington may just be choosing to sit tight and
stay away from the tight competition between FHBs
and MPOs.
36 | CoreLogic Quarterly Property Market & Economic Update New Zealand Q4 2018
© Copyright 2018. CoreLogic and its licensors are the sole and exclusive owners of all rights, title and interest
(including intellectual property rights) the CoreLogic Data contained in this publication. All rights reserved.Wellington Values
Average Value of Housing Stock – Wellington ($)
Value growth across Wellington remains strong, with
the increase in the final three months of 2018 coming
in at 3.2%, holding up the annual growth rate at 8%.
In the City itself, recent gains have been a little softer
– presumably reflecting the higher level of average
property values. But out in Upper and Lower Hutt,
and Porirua, the rise in values in the final three months
of 2018 was at least 4.2%. And in Upper Hutt, the
annual gain in values last year was a strong 12%.
Annual and Quarterly Change in Value – Wellington (%)
December 2018
Current value 3 months 12 months Since Peak
Porirua $591,421 5.3% 9.0% 55%
Upper Hutt $526,702 5.7% 12.0% 50%
Lower Hutt $559,319 4.2% 7.0% 43%
Wellington City $813,052 2.3% 7.0% 53%
CoreLogic Quarterly Property Market & Economic Update New Zealand Q4 2018 | 37
© Copyright 2018. CoreLogic and its licensors are the sole and exclusive owners of all rights, title and interest
(including intellectual property rights) the CoreLogic Data contained in this publication. All rights reserved.Christchurch Market Activity
Buyer Demand – Christchurch (volume index)
Buyer demand in Christchurch has perhaps drifted a
little lower in the past few months, but not by much.
The bigger picture is that it seems to have found a
floor, albeit at levels down on 2015 and 2016.
Looking at buyer classification, 2018 was ‘the year of
the first home buyer’ in Christchurch. Having become
the biggest individual buyer group towards the end of
2017, FHBs held on to that position throughout 2018,
even getting as high as 29% of purchases in the third
quarter. The large supply of new property available
in Selwyn and Waimakariri has allowed some existing
owners to move out of Christchurch, freeing up the
stock for FHBs to purchase in the city.
Movers and cash multiple property owners (MPOs)
were reasonably steady in Christchurch throughout
2018, so the only other point of interest in buyer
classification was the mortgaged MPOs – having
dipped to a 21% share in Q1 2018, they recovered to
Buyer Classification – Christchurch (% of sales) 24% by the end of the year. Again, a tendency for
some owner-occupiers to leave the city will have freed
up more property for mortgaged MPOs to buy.
Indeed, note that in Selwyn, movers are the biggest
individual buyer category, at 37%, with the same
applying even more strongly in Waimakariri (45%).
38 | CoreLogic Quarterly Property Market & Economic Update New Zealand Q4 2018
© Copyright 2018. CoreLogic and its licensors are the sole and exclusive owners of all rights, title and interest
(including intellectual property rights) the CoreLogic Data contained in this publication. All rights reserved.Christchurch Values
Average Value of Housing Stock – Christchurch ($)
With most indicators suggesting that Christchurch’s
property market is nicely balanced in terms of supply
and demand, it’s no surprise that values are still more
or less flat. Indeed, they have hovered in and around
$495,000 for the past two years.
Banks Peninsula is performing reasonably well in a
Christchurch market context, but the rest of the city
is showing only modest gains (of around 1% annually)
or even a slight dip (-0.3% in Central & North).
Around Greater Christchurch, property values in
Selwyn and Waimakariri didn’t do much in the final
three months of 2018, but growth for the full year
was a bit stronger (1.7% and 2.0% respectively)
than in the city itself.
Annual and Quarterly Value Change – Christchurch (%)
December 2018
Current value 3 months 12 months Since Peak
Banks Peninsula $524,368 1.5% 2.9% 9%
Christchurch Central & North $582,090 0.3% -0.3% 31%
Christchurch East $375,641 0.6% 1.1% 21%
Christchurch Hills $671,507 -0.2% 1.0% 21%
Christchurch Southwest $475,096 0.9% 0.9% 40%
Selwyn $555,387 0.0% 1.7% 49%
Waimakariri $448,027 0.5% 2.0% 40%
CoreLogic Quarterly Property Market & Economic Update New Zealand Q4 2018 | 39
© Copyright 2018. CoreLogic and its licensors are the sole and exclusive owners of all rights, title and interest
(including intellectual property rights) the CoreLogic Data contained in this publication. All rights reserved.Dunedin Market Activity
Buyer Demand – Dunedin (volume index)
Market activity in Dunedin was strong in 2018,
despite a tight number of properties available to buy.
Early in 2018, movers remained the dominant
group in Dunedin, consistently accounting for 30%
of purchases, with first home buyers (FHBs) and
mortgaged multiple property owners (MPOs) jostling
for second place. However, by the end of the year,
there had been some shifts. In Q4 2018, movers’
market share had dropped to 27%, and they were
overtaken by FHBs – who jumped from a 21% share
in mid-2018 to 28%. The lower values of properties in
Dunedin will be helping FHBs get on the ladder more
easily than in some other main centres.
In addition, although they tailed off at the end of
the year, the share of purchases going to mortgaged
MPOs was still 22% in Q4, up from 19% a year earlier.
Buyer Classification – Dunedin (% of sales)
40 | CoreLogic Quarterly Property Market & Economic Update New Zealand Q4 2018
© Copyright 2018. CoreLogic and its licensors are the sole and exclusive owners of all rights, title and interest
(including intellectual property rights) the CoreLogic Data contained in this publication. All rights reserved.You can also read