CAN WE ACHIEVE 100 MILLION PLUG-IN CARS BY 2030? - Working Paper 13 - Global ...
←
→
Page content transcription
If your browser does not render page correctly, please read the page content below

CAN WE ACHIEVE 100 MILLION PLUG-IN CARS BY 2030?

                                      Working Paper 13

                U NEP
Acknowledgements
This publication was co-authored by Lew Fulton (Co-Director, STEPS Program), Gil Tal (Senior
Researcher, PH&EV Center) and Tom Turrentine (Director, PH&EV Center), of the University of
California, Davis, Institute of Transportation Studies.

The authors would like to acknowledge very helpful comments from the IEA (Pierpaolo Cazzola and
Marine Gorner), ICCT (Zifei Yang), ITF (Wei-Shiuen Ng) and Alex Korner. However the authors are
responsible for any errors in the analysis or data. The authors would also like to thank the FIA
Foundation for their support of the UC Davis STEPS program and Sheila Watson, Richard Clarke and the
FIA Foundation for their direct efforts to help produce this paper.

                                                                                                       1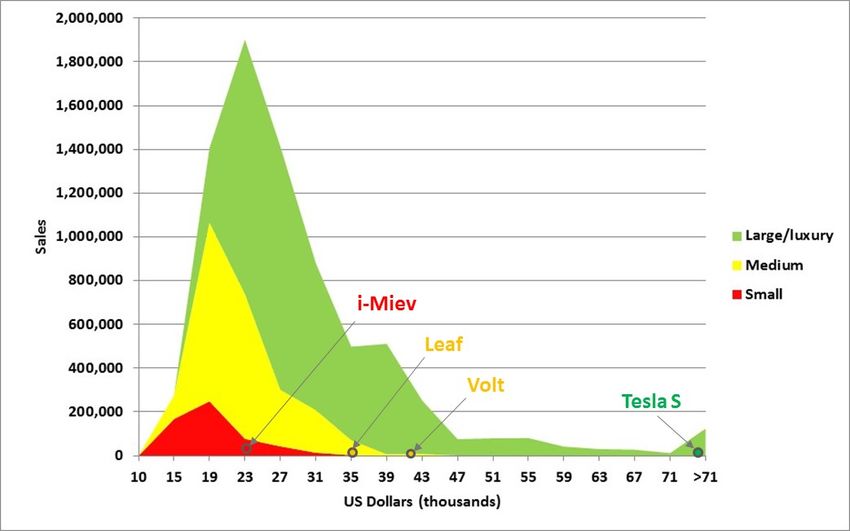
Table of Contents
Acknowledgements....................................................................................................................................... 1
Executive Summary....................................................................................................................................... 3
1.      Introduction .......................................................................................................................................... 6
2.      Electric vehicle market status worldwide ............................................................................................. 7
     Vehicle type .............................................................................................................................................. 7
     Vehicle size.............................................................................................................................................. 10
     Number of models .................................................................................................................................. 11
     Model sales in different markets ............................................................................................................ 12
3.      Three PEV markets in more detail ...................................................................................................... 14
     United States........................................................................................................................................... 14
     France...................................................................................................................................................... 18
     Japan ....................................................................................................................................................... 19
4.      Achieving the 100 million target ......................................................................................................... 21
     PEV market growth dynamics ................................................................................................................. 26
5.      An Initial Exploration of Policy: Competitiveness of PEVs in their market segments ......................... 28
     Next Study Phase: Scenario Development and Further Policy Considerations ...................................... 32
References .................................................................................................................................................. 33

                                                                                                                                                                   2
Executive Summary
This paper explores recent trends in the market penetration of plug-in electric vehicles (PEVs) in
selected countries around the world, and the implications of this for a potential transition to a fairly
dominant PEV market presence within the next 15 years. A useful context is provided by the Paris
Declaration on Electro-mobility (UNFCCC, 2015), which calls for 400 million PEVs on the world’s roads by
2030, of which at least 100 million are expected to be passenger light-duty vehicles (automobiles, sport
utility vehicles/SUVs, vans and passenger light trucks). Today there are about one and a quarter million
PEVs (IEA, 2016), comprised of battery electric vehicles (BEVs) and plug-in hybrid electric vehicles
(PHEVs), on the world’s roads with the vast majority in the United States, Europe, Japan and China. Thus
the Paris Declaration represents a call for nearly a 100 fold increase in these numbers over the coming
15 year period.
This paper investigates the feasibility and extent of the challenge in achieving such a target in a number
of ways:
• It reviews the status and recent trends in development and sales of PEVs across the 8 largest
world markets (China, Japan, France, Germany, Netherlands, Norway, UK and US), representing
the vast majority of global PEV sales to date.
• It explores the expected growth in all light-duty vehicle sales and stocks around the world, and
what a 100 million target may mean in terms of a necessary international sales growth
trajectory for PEVs.
• It undertakes a PEV market analysis for a few specific countries.
• It creates one plausible scenario for growth in PEV sales to meet the target, and how growth in
sales per model sold can help drive the much needed growth in the number of models offered.
• It considers some of the challenges in achieving this scenario, and some initial considerations
around policies needed to achieve the 100 million target.
Regarding achieving 100 million PEVs worldwide by 2030, our analysis finds:
• To reach a global stock of 100 million PEVs by 2030, sales growth will need to be very rapid and
reach somewhere between 20 and 40 million per year by 2030, depending on the shape of the
sales growth curve. Here we use a 30 million target which represents a slightly declining growth
rate over time, consistent with a growing market, and an average growth rate of about 35% per
year for 15 years.
• This target can be thought of in terms of numbers of PEV models multiplied by the average sales
per model. For example, 30 million sales could be achieved with 100 models of PEV selling
300,000 units each around the world in that year, or 300 models selling 100,000 units each;
either way a daunting challenge. We look at the case of 200 models with 150,000 unit sales.
• Figure ES-1 shows one potential sales trajectory to get to 30 million per year in 2030. If it
occurred completely in the current “Major Markets”, it would represent nearly half of the
projected 4-wheel passenger light-duty vehicles (PLDV) sales in those countries in that year.
Clearly it will be easier to meet this challenge if a significant number are also sold in non-OECD
countries, where nearly all overall PLDV sales growth is expected to occur.
3• Although the 30 million sales target is not that large compared to the projected global PLDV
sales in 2030 (about 22%), it becomes a more daunting task when considered from the point of
view of the required growth rates in PEV markets around the world.
Figure ES-1: Achieving 30 million PEV sales in 2030
140
120
100
80
60
40
20
0
2015 2020 2025 2030
Major Markets PEV Major Markets Other Rest of World
Source: PLDV sales projections from IEA 4 degree scenario (4DS)
Other key findings of this paper include:
• Though 2015 is still “early days”, it is encouraging that between 2011 and 2015, PEV sales across
the top 8 world markets (US, Japan, China, and 5 European countries) showed an overall steady
increase with average growth rates over 50% in all years (though this is not true of all countries
individually). The number of PEV models available across most of these countries also increased
steadily, with by 2015 a reasonable overall balance of PHEV vs. BEV models, and across different
light-duty vehicle market classes (i.e. small, medium and large/luxury cars as well as SUV
models). By far the weakest PLDV segments for models and sales were vans and pickup trucks.
• However, these trends were quite uneven across the 8 countries and in 2015 there was still a
lack of wide PEV model selection in key market segments in most countries. Although in our
database we track close to 100 PEV models worldwide, very few were sold in more than a few
countries.
• A deeper look at the US, France and Japan shows that, across all passenger light-duty vehicle
sales, there are very different distributions by market class, and that the models of PEVs were
not well aligned with the various dominance of vehicle types in these countries. It also showed
that average sales per model for PEVs were quite low relative to non-PEVs. On the other hand,
BEVs tend to dominate smaller vehicle classes and more PHEVs are now appearing in larger car
segments (such as SUVs), which may be appropriate given the characteristics of these two types
of PEVs.
• An examination of PEV prices across compact and mid-size car market segments in the U.S.
shows that the PEVs sold tend to be quite expensive for these market classes, even with national
4price incentives. Given the tendency for high price sensitivity of consumers in these market
classes, it is not surprising to see that some of the more successful PEV models are in premium
market classes.
• We estimate that the benefit of price incentives, in terms of making PEVs more price
competitive, rises rapidly for PEVs that are competing in these lower price categories, especially
once it puts their sales price into a zone where large numbers of conventional vehicles are sold.
Current US national incentives do not appear to help current compact and mid-size PEV models
reach these price points.
In the next phase of the study, a deeper policy analysis will be undertaken, including a competitiveness
analysis taking into account the impact on likely market trends of a full range of vehicle attributes such
as vehicle range and recharge time, and the effects of various public policies on PEV competitiveness by
country and market segment. We will also develop more detailed scenarios of vehicle sales to 2030 and
how 100 million cars on the world’s roads by 2030 could be reached.
51. Introduction
Plug-in electric vehicles (PEVs), including battery electrics and plug-in hybrid electric vehicles, will need
to play a major role in the future in order to achievedeep decarbonization of transportation systems
around the world. This is especially true post-2030, when efficient conventional cars alone will not be
sufficient to reach a 2 degree emission trajectory (IEA 2016). The recently adopted Sustainable
Development Goals (UN, 2015) call for a doubling of the energy efficiency improvement rate, as well as
major reductions of air pollution. PEVs can contribute to both goals.
To play a major role post-2030, PEVs will need to reach full commercialization and large sales levels by
2030. The Paris declaration on electro-mobility (UNFCCC, 2015), launched at the 21st session of the
Conference of the Parties (COP21) in Paris in December 2015, calls for at least 20% of all road vehicles
around the world to be electrically driven by 2030. Even if a very high share of 2-wheelers were
electrified by then, achieving this20% target would also require a large number of 4-wheel passenger
light-duty vehicles (PLDVs) to be electrified; the declaration explicitly mentions 100 million or more, out
of the expected 1.5 to 2 billion PLDVs on the world’s roads by 2030. While still a small share of the
global totals, achieving 100 million by 2030 compared to today’s number of around 1 million plug-in
electric vehicles will require a very rapid rate of growth in sales – effectively a revolution with some
markets at very high sales shares to help lead the way.
It should be noted that there are other targets in play – notably the IEA ETP 2 degree scenario, which
targets 140 million PEV light-duty vehicles by 2030 (shown Figure 1, taken from GEVO 2016). This will
clearly be even more challenging to reach than the Paris Declaration 100 million target. There are also
targets for 2020 shown in the figure. All of these will be challenging to achieve. This paper focuses on
the Paris Declaration 100 million target for 2030.
Figure 1. Different PEV targets for 2020 and 2030
Source: GEVO 2016, Figure 9.
Can the world reach 100 million electric passenger cars by 2030? What will be required to do this? This
paper explores this future by drilling into some of the details and projecting how different aspects of the
market, in multiple countries, would need to develop, and highlighting the challenges that are likely to
be involved. These challenges include technical ones, economic ones, policy ones, consumer
preferences and simple market dynamics – rates of change in sales and rates of technology diffusion
that, at least for automotive markets, are faster than what we typically have seen in the past for major
6new automotive and new fuel technologies, although there are some encouraging recent examples of
rapid tech market penetration 1. Recent studies suggest this is possible (and is in fact consistent with
summing the targets set by a range of national governments, GEVO (2016), Lutsey (2015a)), but will be
very challenging to meet.
If the 100 million target can be achieved it will lead the way into a new world from which there is likely
to be no going back. It seems reasonable to assume that it will put the world on a path whereby perhaps
all new cars and other light-duty vehicles operate on electric drive by 2040, and a high share of all cars
on the road do so by 2050. Coupled with a transition to low-carbon electricity generation around the
world, this transition to electric vehicles could lead to very low operational CO2 emissions from
passenger cars in this time frame – though that assumption (of clean power) is critical to realize this
outcome. In any case, a world with plug-in electric drive vehicles operating on low-carbon electricity is
the vision behind the Paris declaration, and has fairly broad support as a strategy for decarbonizing
automobiles by 2050.
This paper considers the 100 million PEVs in 2030 scenario from several perspectives. First, we develop a
scenario with sufficient detail to have a rough idea what level of sales might be needed in different parts
of the world, and how fast PEV sales growth may need to occur. Next we look at where things stand in
2016, both in terms of sales and in terms of other market and policy characteristics. Third, we roll out
new PEV models and assume sales growth, and diffusion, on a global/regional basis to identify the
growth rates that will be needed. Finally, we take an initial look at policies for achieving the 2030 target.
A deeper policy analysis will be provided in a follow-on paper.
This paper specifically addresses:
• The numbers and types of PEVs in specific markets and the trajectory of sales to 2030 that
would likely be needed to meet the 100 million target;
• How this breaks down into the required number of PEV models and sales per model by markets
and market segments;
• Some initial considerations of the need for models to be competitive within their segments, and
where policies could most effectively help achieve this.
This paper is intended as a “think piece” on this topic but also as guide for countries; and also for the
GFEI, for whom an active involvement in advancing PEVs will help carry forward the idea of sustainable,
individual motorized transport – based mainly on maximizing the efficiency of conventional combustion
engine vehicles in the near- to mid-term (GFEI 2014) – to a long-term, truly low carbon future.
2. Electric vehicle market status worldwide
Vehicle type
Battery electric and plug-in hybrid electric vehicles are currently sold in significant numbers in just a few
countries around the world. These include the large car markets of the EU (particularly northern EU),
Japan, the U.S. and China.
1
Though there are some cases where such fast increases have been observed, such as diesel uptake in Europe
(GEVO 2016)
7In 2015, about 550,000 PEVs were sold worldwide, with the vast majority in the 8 countries included in
Figures 2a and 2b, including both battery electric and plug-in hybrid cars 2. The sales growth rate has
been impressive, with 50% or more increase in sales across the 8 markets each of the past 4 years, and
71% in 2015. In 2015, China became the largest PEV market, followed by the US, after four years where
the US was largest. In the same year, European nations together reached the sales level of the U.S.
Since 2011, the international market has shown impressive growth, yet PEVs still account for less than
1% of the 90 million-per year global PLDV market. As a percentage of sales the dominant leaders at this
time are Norway where PEVs have over 20% market share, and the Netherlands with around 10%. No
other country has more than about a 2% market share (Sweden and Demark were slightly over 2% in
2015, all others were below 2% (GEVO 2016). Figure 2b also shows that countries are experiencing a
large variance of relative shares of BEV and PHEVs, with the Netherlands and UK leading on PHEV share
and Norway and France on BEV share. The United States, Japan and Germany had close to equal shares
of the two.
2
The data used in this paper is based on a range of data sources and was compiled by UC Davis. These data do not
precisely match other compiled data sources such as EIA (as shown, for example, in GEVO 2016). In the future,
better alignment of international PEV data and data sources is a goal of GFEI.
8Figure 2a and 2b: PEV sales in eight largest vehicle markets (annual sales growth rate above bars)
600,000
76%
500,000
400,000
300,000 50%
200,000 74%
307%
100,000
0
2011 2012 2013 2014 2015
Sales BEV Sales PHEV
200,000
180,000
160,000
140,000
120,000
100,000
80,000
60,000
40,000
20,000
0
Norway
China
Germany
France
UK
US
Japan
Netherlands
2015
Sales BEV Sales PHEV
Source: UC Davis compiled data based on a range of internet sources (see references).
9Vehicle size
Another view on PEV sales is by market class. Figure 3a shows the evolution of sales 2011-2015 on this
basis, while Figure 3b shows it by country for 2015. These show that PEV sales are concentrated in cars
rather than “light trucks” (SUVs, vans and pickups), with the latter categories accounting for about 15%
of PEV sales in 2015 (nearly all of which was SUVs), and well less than 10% in most of the 8 countries.
On the other hand, SUVs were the fastest growing group in 2015.
Figure 3a and 3b: PEV sales by market class
600,000
500,000
400,000
300,000
200,000
100,000
0
2011 2012 2013 2014 2015
Totals across 8 countries
Subcompact Compact/midsize Large/Luxury SUV Van Pickup truck
200,000
180,000
160,000
140,000
120,000
100,000
80,000
60,000
40,000
20,000
0
Norway
China
Germany
France
UK
US
Japan
Netherlands
2015
Subcompact Compact/midsize Large/Luxury SUV Van Pickup truck
10Number of models
The market development of PEVs is uneven across countries, and across PEV types (both in terms of BEV
vs. PHEV and in terms of market class shares). One reason for these sales differences is the relative
availability of specific models of PEV. There are fairly divergent offerings of PEVs in these 8 countries –
including within the different countries that are part of the EU.
Figures 4a and 4b show the number of PEV models offered for sale in the 8 countries in 2015, broken
out by BEV/PHEV and by market class. While there appears to be surprisingly good availability of
different types of PEVs across most of the countries, some interesting differences emerge. The two
countries with the lowest PEV sales (Japan and UK) also have quite low numbers of models on offer.
This may reflect a number of factors, such as manufacturers choosing not to sell models in those
countries, but in any case it suggests that the number of models on offer matters in terms of total PEV
sales. There does appear to be a reasonable selection of models in most countries across market
classes – though the absolute numbers are quite small compared to the numbers of conventional
vehicle models on offer (over 500 in larger markets like the US and China, as well as around the EU).
Figure 4a and 4b: PEV model counts by vehicle type and country, 2015
40
35
30
25
20
15
10
5
0
Norway
China
Germany
France
UK
US
Japan
Netherlands
2015
Model Count BEV Model Count PHEV
40
35
30
25
20
15
10
5
0
China France Germany Japan Netherlands Norway UK US
2015
Subcompact Compact/midsize Large/Luxury SUV Van Pickup truck
11Another question is whether individual models are sold across markets, or whether they are
concentrated in just a few markets (and thus with a more splintered global PEV market). Figure 5 traces
the growth in the number models available for sale from 2011 to 2015, from the point of view of how
many countries they were sold in. One evident trend is an increase in the number of PEV models
offered – reaching at least 70 worldwide by 2015. However, no clear trend has emerged so far – there
has been steady growth in the number of models available in only one country (typically US or China)
along with those available in many countries. Almost no models were available in 2015 or earlier years
in all 8 countries, though there has been growth in the number of models available in 5 to 7 countries.
Overall, many models may be restricted in global sales because of the limited number of markets they
are sold in. Availability in only a few countries could reflect technical obstacles, such as incompatible
charging infrastructure across countries. Type approval may be a challenge in some countries, for some
models. And some may just be targeted to a single market or sold by small manufacturers that are not in
a position to sell internationally.
Figure 5: Number of countries in which individual PEV models were sold
80
70
60
50
Models
40
30
20
10
0
2011 2012 2013 2014 2015
Number of countries individual models are available in
1 2 3 4 5 6 7 8
Model sales in different markets
Figure 6 looks at the sales situation from the point of view of specific models. It shows the 2015 sales of
the top 20 selling PEV models worldwide, and where they sold. There are arange of experiences, but the
top three selling models, the Tesla S, Mitsubishi Outlander and the Nissan Leaf, sold in a range of
different countries. The Tesla S and Nissan Leaf had the U.S. as something of an “anchor” country, while
the Mitsubishi Outlander was notable for being sold mainly in European countries. Some models did
reasonably well selling in only one country, but in almost all cases this country was either the U.S. or
China. Clearly, models that were only sold in one or two small markets were not likely to be high sellers.
One notable exception was the Volkswagen e-Golf, which was one of the top selling models in the
robust PEV market in Norway.
12Figure 6: Sales of top 20 models in 2015, broken out by country of sale
40,000
35,000
30,000
25,000
20,000
15,000
10,000
5,000
0
Tesla Model S
Zotye Z100
Roewe 550 PHEV
Nissan Leaf
BYD Qin
VW Golf GTE
Renault Zoe
Audi A3 e-Tron
BAIC E150 EV
JAC iev
Peugeot iOn/Mitsubish I-
Kandi K10 EV
BMW i3
Chevrolet Volt/Ampera
Kandi Panda EV
BYD Tang
VW e-Golf
Ford Fusion Energi
Ford C-Max Energi
Mitsubishi Outlander
Miev/Citroen C-0
2015
China France Germany Japan Netherlands Norway UK US
Finally, Figures 7a and 7b show the 2015 sales and numbers of PEV models in the top 8 markets, broken
down by vehicles produced by domestic manufacturers versus those by foreign manufacturers (based
only on the nationality or region of the manufacturer, not the specific location of production). There
was a range of experience, but typically national producers have done well within their own country (if
there are any). China and Japan sold almost exclusively PEVs produced by Chinese manufacturers (some
in collaboration with foreign manufacturers, but with the Chinese manufacturer nameplate), while the
US and European countries sold a mix of domestic and international models. Japanese models (such as
the Nissan Leaf) did well in most international markets while the only other regional “crossover” was
that models from EU manufacturers did well in the US. This is mostly consistent with the availability of
models across the 8 markets – the one clear difference being the widespread availability of U.S.
manufacturer models in Europe, but with modest sales.
All of this shows that there is as yet relatively little “cross fertilization” of models from different regions
selling in other regions. A greater spread of “internationalism” may help to increase the overall rate and
level of PEV sales over time.
13Figure 7a and 7b: sales and models available within top 8 markets by country of vehicle manufacturer
200,000
180,000
160,000
140,000
120,000
100,000
80,000
60,000
40,000
20,000
0
China EU Japan Korea US
40
35
30
25
20
15
10
5
0
China France Germany Japan Netherlands Norway UK US
China EU Japan Korea US
3. Three PEV markets in more detail
To further explore questions around the sales of PEVs across countries and market classes, we now
consider three PEV markets in somewhat greater detail andin the context of the broader light-duty
vehicle markets the US, France, and Japan.
United States
In the United States, sales of light-duty vehicles (LDVs) tend to be dominated by relatively large cars,
SUVs and pick-up trucks. This is fairly unusual world wide – the U.S. has by far the highest market share
of these types of vehicles (relative to small cars) of any major world market, and lowest share of
subcompact (European market class A and B) vehicles. Figures 8a and 8b show the U.S. sales
14distribution of all passenger light-duty vehicles (PLDVs) for the most recent year available (2013) and
just for PEVs (updated tor 2015). This reveals that while medium and large cars, SUVs and pickups are
the dominant market classes in the US, sales of PEVs are to date occurring mainly on the medium to
smaller car side. Even hybrids (shown in the left hand graph) sell mainly in the compact and
medium/large car segments, rather than SUVs or pickups. There are very few sales of hybrids, BEVs and
PHEVs in light truck (SUV or pickup) market classes.
Figure 8a and 8b: U.S. PLDV sales in 2013 by Market Segment and technology/fuel type, and just PEV
sales (updated to 2015)
6
Millions
5
4
3
2
1
0
Conventional Hybrid Battery electric Plug-in hybrid
60,000
50,000
40,000
30,000
20,000
10,000
0
BEV PHEV
Looking at the number of PEV models on offer, Figures 9a and 9b show that one reason for the
preponderance of PEVs in just a couple of car classes is that the number of models offered in most car
classes is roughly proportional to the sales of that car class. To some degree, this is true for BEVs and
PHEVs as for other types of cars; clearly the reason that BEVs had no sales in the pickup and van classes
15is because there were no models on offer. Similarly there were only two models on offer in the large
SUV class. On the other hand, there were many models offered in the subcompact class, more than in
the compact/midsize class, but sales for subcompacts were far lower (as per previous figure).
The focus on producing PEV models for car rather than light-truck market segments may reflect the fact
that smaller (and lighter) vehicles need smaller battery packs and are thus cheaper to produce; they are
also more oriented toward shorter range driving (such as mainly urban driving), than longer cars. But it
does mean a lack of PEV availability in market segments that account for a large share of U.S. LDV sales.
Figure 9a and 9b: U.S. vehicle models offered in 2013, by market class and technology/fuel type, and
updated to 2015 for PEV models
250
200
150
100
50
0
Conventional Hybrid Battery electric Plug-in hybrid
12
10
8
6
4
2
0
BEV PHEV
16Another metric, average sales per model by market segment and vehicle technology, is shown in Figure
10. This is obtained by dividing the total sales within each segment by the number of models sold in that
segment. In the U.S., compact cars have by far the highest sales per model, with an average around
60,000, while most other classes average in the 20,000-40,000 range. This reflects a fairly high variance
– top selling models such as the Honda Civic and Toyota Corolla are well over 100,000, with some
models far below 50,000. Similarly a few pickup trucks such as the Ford F-150 sell hundreds of
thousands of units, but these are offset by many low-sales models, resulting in the average around
30,000 per model. Thanks mainly to the Prius, hybrids sold an average of 30,000 in the C class.
At such an early stage of market introduction of PEVs, the relationship between the number of models
offered and the sales in those market classes (and thus average sales per model) is similarly idiosyncratic
– much can be explained by the success or failure of individual models. The Nissan Leaf (compact class),
Chevy Volt (compact class) and the Tesla (sport class), account for more than half of all PEV sales. On
the other hand, there does appear to be a pattern that PEVs have tended to be offered in very small car
classes, while most LDV sales are in larger car and light-truck classes.
One reason for the low average sales of PEVs, especially in the subcompact class, is that there are really
two types of models on offer: limited production models, sometimes titled “compliance cars” that are
built by the OEMs to explore the technology and meet the Californian Zero Emission Vehicle (ZEV)
program requirements, and larger production vehicles that though limited in production are still
designed to be sold well above the ZEV requirement needs.
Figure 10: United States 2013 average sales per model (updated to 2015 for BEV/PHEV) by market
segment
70,000
60,000
50,000
40,000
30,000
20,000
10,000
-
Conventional Hybrid Battery electric Plug-in hybrid
17These figures indicate that it is “early days” for battery electric and plug-in hybrid vehicles, with
relatively few models offered (and no models in some important market classes), and with quite low
average sales per model in every segment.
In some respects, the French and Japanese car markets provide a striking contrast to the U.S. situation:
for example both are dominated by small car sales, and neither has a significant number of large SUVs or
pick-up trucks.
France
As shown in Figures 11a-11e (in particular 11b), the French market in 2015 had around 25,000 electric-
drive vehicles registered, and more than half were in the sub-compact class (such as the Renault Zoe),
the rest being mainly compact cars (e.g. Nissan Leaf). Several hundred plug-in hybrids were sold, all of
them in the medium/large car class. In terms of numbers of models, there were actually more
medium/large car models on offer than any other segment, but average sales were fairly low as many of
these are low volume luxury models. Electric drive vehicles were available in a fairly wide array of
classes but there were far more subcompacts than any other type, and these were clearly the most
successful (keeping in mind that total sales were very small for all electric drive vehicles).
In general, sales per model in France are very low compared to the U.S., not surprisingly since it is a
much smaller market. However there are nearly as many different PEV models available in France as in
the U.S., probably due mainly to its position within the EU, sharing the much larger market, and serving
as one of the current leaders in adopting PEVs. But sales of plug-in vehicles in 2015 averaged less than
1000 per model in all market segments except for subcompacts, indicating some combination of low
production volumes, low competitiveness of these models and/or a very immature market (e.g. low
awareness of available models).
18Figure 11a-b: France new registrations, 2013 (updated to 2015 for PEV models)
0.9 16
Millions
Thousands
0.8 14
0.7 12
0.6
10
0.5
8
0.4
6
0.3
0.2 4
0.1 2
0 0
Conventional Hybrid Battery electric Plug-in hybrid Battery electric Plug-in hybrid
Figure 11c-d: France number of models offered for sale, 2013 (updated to 2015 for PEV models)
250 10
9
200 8
7
150 6
5
100 4
3
50 2
1
0 0
Conventional Hybrid Battery electric Plug-in hybrid Battery electric Plug-in hybrid
Figure e: France sales per model by market segment and technology
8,000
7,000
6,000
5,000
4,000
3,000
2,000
1,000
-
Conventional Hybrid Battery electric Plug-in hybrid
Japan
Japan is not that different fromFrance in terms of the dominance of small cars there, but two notable
differences emerge (Figures 12a-12e). One is that compact cars in Japan in 2013 were dominated by
sales of hybrid vehicles. This is probably the most successful market segment for hybrids in any country
in the world (with the possible exception of Sri Lanka). The other difference is that electric drive
vehicles in Japan were dominated by compact cars (namely the Nissan Leaf) rather than the
19subcompacts in France. Of the four subcompact electric vehicles available in Japan none sold more than
a few hundred units. This may be related to the dominance of “kei” cars in this market segment, which
are very low cost and create an environment that PEVs may have a difficult time competing with.
Figure 12a-12b: Japan new registrations, 2013 (updated to 2015 for PEV models)
2.5
12
Millions
Thousands
2 10
1.5 8
6
1
4
0.5
2
0 0
Conventional Hybrid Battery electric Plug-in hybrid Battery electric Plug-in hybrid
Figure 12c-d: Japan number of models offered for sale, 2013 (updated to 2015 for PEV models)
180 3.5
160 3
140
2.5
120
100 2
80 1.5
60
1
40
20 0.5
0 0
Conventional Hybrid Battery electric Plug-in hybrid Battery electric Plug-in hybrid
Figure 12e: sales per model by market segment and technology, 2013 (updated to 2015 for PEV models)
60,000
50,000
40,000
30,000
20,000
10,000
-
Conventional Hybrid Battery electric Plug-in hybrid
20Conclusions from this comparison of sales and model offerings across the three countries are:
• Each country has its own market characteristics, and different market segments dominate. The
U.S. is a particular outlier in the large size of its cars compared to France and Japan (and almost
any other country worldwide, GFEI 2016).
• As of 2015, an increasing number of electric and plug-in hybrid models were available in the
three countries, but the numbers were still very small relative to non-plug-ins, and tended to be
dominated by certain market segments, whilst others had few or no offerings.
• Even where models were offered, sales per model tended to be quite low – not surprising for
new technologies.
• As a result, thecentral question that companies and policy makers in all of these markets
areasking ishow can sales of PEV models be increased?
4. Achieving the 100 million target
The preceding discussion suggests that PEVs are making important progress across the world’s four
biggest car markets: the U.S., EU, Japan and China. A fairly large number of models are on offer, though
sales per model are generally quite low and the coverage of different market segments can be spotty in
many cases.
When put into perspective with global light-duty vehicle sales (Figures 13a and 13b), it becomes clear
that PEVs have a very long way to go to become an important part of the entire world market. To
achieve a target of 100 million PEVs on the road by 2030, significant sales will need to occur in many
more countries and world regions. This is even more apparent when one considers the likely growth of
PLDV sales outside of the “big 4” markets – the rest-of-world sales nearly matches these markets by
2030 (figure 13b). Total world sales of PLDVs are projected by the IEA (in their 4DS, IEA 2016) to increase
from a little over 80 million per year today to over 130 million per year by 2030, with most of the growth
outside the current “big 4” markets.
21Figure 13a and 13b: PLDV sales by all major world regions, 2015 and projected to 2030
PLDV Sales by Region, Type
25
20
15
Millions
10
5
-
2015 PLDV sales 2015 PEV sales
PLDV Sales by Region, Type
80
70
60
50
Millions
40
30
20
10
-
Europe/US/China All Other Europe/US/China All Other
Japan Japan
2015 2030
2015 non-PEV 2015 PEV sales 2030 All PLDV sales
Sources for total PLDV and PEV data and projections: IEA Mobility Model (IEA ETP 2016), with updates for US and China 2015
sales data
22Figures 14a and 14b relate these sales projections to the stock of vehicles. Given an average vehicle life-
time of 15-20 years in different parts of the world, the IEA projects the stocks of vehicles as a function of
sales and retirements. Global stocks by 2030 are projected to rise from about 1 billion today to nearly
1.8 billion light-duty vehicles. These figures do not break out PEV stocks in 2030, which is discussed
next.
Figure 14a and 14b: PLDV stocks by all major world regions, 2015 and projected to 2030
PLDV Stocks by Region, Type
300
250
200
Millions
150
100
50
-
2015 non-PEV 2015 PEV sales
PLDV Stocks by Region, Type
1,200
1,000
800
600
400
200
-
Europe/US/China All Other Europe/US/China All Other
Japan Japan
2015 2030
2015 non-PEV 2015 PEV sales 2030 All PLDV sales
23The next question is how sales and stock relate to each other for PEVs, i.e. what sales trajectory can
produce stocks of 100 million PEVs in 2030? A range of sales curves could, but one fairly logical way to
view this is to establish a steady sales growth rate that achieves the stock target. Such a sales rate is
shown in Figure 15a to 2030 (and with a zoom into just 2015-2020 in Figure 15b). From their current
levels of about 550,000 units per year worldwide, sales would need to grow by about 28% per year,
every year from 2015 to 2030. Along the way they must reach nearly 2 million in 2020, nearly 10 million
in 2025, and about 30 million in 2030 – with a combined effect (including some retirements over that
time frame) that hits the stock target of 100 million in that year.
Figure 15a and 15b: One possible scenario for growth in number of models and sales per model to 2030,
to reach 100 million PEVs on the world’s roads by that date. (Figure 15b zooms in on next 5 years)
120
100
80
Millions
60
40
20
0
2015 2020 2025 2030
Annual Sales Total Stock
6
5
4
Millions
3
2
1
0
2015 2020
Annual Sales Total Stock
This leads to the next question: in terms of setting targets, how might such a sales and stock trajectory
be logically “allocated” across the world’s countries and regions? As shown in Figure 16a and 16b, the
100 million PEVs, if sold entirely in the “Big 4” markets of the U.S., EU, Japan and China, would account
24for about 10% of stocks in those countries in 2030. However, the sales required to reach this stock level
would need to account for about 42% of sales in that year. Clearly this will be challenging, and this
target would be easier to reach (for the big 4 markets, at least) if a significant number of PEV sales occur
in other parts of the world. For example, if we assume that by 2030, the PEV sales in the “rest-of-world”
grows to be about half that in the “Big 4” markets (i.e. about 10 million out of 30 million total, with 20
million sold in the “Big 4” markets). This reduces the market share requirement of PEVs in the “Big 4”
markets in 2030 from 42% to about 28%, with about a 15% sales share in the rest-of-world. This latter
distribution will serve as an indicative basis for the analysis in this paper.
Figure 16a and 16b: two regional scenarios for reaching 100 million PEVs in 2030
All PEV sales in "Big 4" Markets
80 1,200
70
60 900
50
Millions
Millions
40 600
30
20 300
10
- 0
Europe/US/China All Other Europe/US/China All Other
Japan Japan
2030 sales 2030 stocks
Non-PEV sales PEV sales Non-PEV stocks PEV stocks
Two-thirds of PEV sales in "Big 4" Markets
80 1,200
70
60 900
50
Millions
Millions
40 600
30
20 300
10
- 0
Europe/US/China All Other Europe/US/China All Other
Japan Japan
2030 sales 2030 stocks
Non-PEV sales PEV sales Non-PEV stocks PEV stocks
25PEV market growth dynamics
The central point of the foregoing discussion is that PEV markets around the world are still evolving, and
as of 2015 are becoming more international, with rising numbers of models, and models that sell
reasonably well (e.g. over 5000 units per year). Though in comparison to the overall size of the PLDV
market and the typical sales of PLDV models, PEVs are still in their infancy. In order to increase overall
sales of plug-in vehicles, many more makes/models will need to be offered, in more market classes,
more countries, etc. However, in order to encourage manufacturers to introduce more models, current
models will need to sell increasingly well. Figure 17 shows one combination of growth in the number of
models and sales per model that can achieve 30 million sales in 2030 (and thus, as shown above, the 100
million stock target). This is to achieve 200 models selling 150,000 units each in 2030. That compares
to the current situation of roughly 50 models selling 10,000 units each (taking into account all models
that currently sell 1,000 or more units worldwide). Of course this target could also be achieved with
fewer models and higher sales per model, or more models with lower sales per model; in any case the
combined targets will be very challenging to achieve.
Figure 17: PEV models and sales per model that could achieve 30 million sales by 2030
250
200
150
100
50
0
2015 2020 2025 2030
Number of models sales/model (000)
As a “thought experiment”, one can hypothesize a level of average model sales that is great enough to
encourage new models to be introduced. Though highly uncertain, perhaps as average PEV sales move
upwards from 10,000, past 20,000, 30,000 etc., this will encourage manufacturers to introduce more
models (with some lag time in terms of planning – though also affected by market analytics that suggest
that such sales increases are coming). In turn, sales per model are basically a function of the state of
competition within the market segment, and PEVs will need to become much more competitive within
their market segments in each country to increase their sales counts.
26The following is a simplified scenario taking the United States market as an example 3. It uses Polk data
on US PEV registrations and the number of models by market segment. The scenario is based on the
following logic:
1) Via a range of policies to make PEVs competitive, and improvements/cost reductions in PEV
technologies, sales per PEV model are assumed to increase from the 2013 averages by steady
amounts per year until total PEV sales reach 28% of the market (the same percentage as
represented by 30 million sales in 2030 for the global UN target). They must reach this market
share by 2030. The exact nature of the needed policies to achieve this is not considered here
(and not critical for this example, but is a key question to be addressed in the follow-on study).
2) A new PEV model is assumed to be introduced when the average sales per existing PEV model
reaches a target level. This target is related to the average sales level of all models in the same
market segment, with the threshold set low in early years – 50% of average sales (in other
words, manufacturers will add models if the current ones are selling at least half as well as non-
PEV models). This rises over time to 100% in later years as the market matures and
manufacturers expect equal market performance from PEVs as non-PEVs.
3) Both the number of models and the sales per model in each segment are capped to avoid
reaching particularly unrealistic levels by 2030; the number of models may not exceed 50% of
the total models in a segment, and the sales per model may not exceed 120% of the average for
non-PEVs in the segment. This forces the 28% market share target to be reached by more than
just a few models (or a few market segments) doing incredibly well – it requires a broad success
of PEVs across a range of market segments.
With these “rules” or assumptions, one key degree of freedom remains and the question: what
annual growth rate in the sales per model will drive the market so that a) new models are
introduced at a rapid rate and b) the combination of additional models and sales per model reaches
the target of 28%?
The results are shown in the following figures (18a-18d). The first shows the number of models in
the U.S. and how this grows for each market segment; the second shows this as a percentage of all
models in the segment; the third shows the average sales per PEV model by market segment, and
the last shows the combined effect of these on total sales of PEVs, as a percentage of total light-duty
vehicle sales. The weighted average of these percentages in 2030 is about 28%.
The third figure contains the answer to the question of necessary sales growth rate per model – 30%
per year. Average sales per model in all market segments grows by 30% a year until it reaches its
capped level, which triggers enough increase in the number of models to hit the overall sales target
in 2030. Figure 18a and 18b indicate that the growth in models is “lumpy”, as it only increases when
sales per model hit a target level. Figures 18c and 18d show the growth rates per model and overall,
as a share of total PLDV sales within the market segment. The overall growth rates are variable but
in some cases very rapid.
3
For this example, using the entire world market instead of the US might be preferable, but key data is not
available worldwide, such as total vehicle sales by market class, or sales per model.
27Figures 18a-18d: A PEV models/sales growth scenario:
18a: PEV models per market segment 18b: PEV model share of all PLDV models in segment
45%
25
PEV models as a % of all models
40%
35%
20
Number of PEV models
30%
15 25%
20%
10 15%
10%
5
5%
0 0%
Subcompact Compact Medium/large Small-mid SUV Subcompact Compact Medium/large Small-mid SUV
Large SUV Pick-up Van/LCV Large SUV Pick-up Van/LCV
18c: PEV average sales per model 18d: PEV share of total sales by market segment
70
70%
Sales per model, thousands
60
PEV share of total sales 60%
50
50%
40
40%
30
30%
20
20%
10 10%
- 0%
Subcompact Compact Medium/large Small-mid SUV Subcompact Compact Medium/large Small-mid SUV
Large SUV Pick-up Van/LCV Large SUV Pick-up Van/LCV
This is simply one example, meant to illustrate the challenge of reaching a 28% market share target in 15
years. One important takeaway is that, when broken down into component problems of sales growth
per model and number of models, it will require rapid growth in both the sales of existing models and
the number of models offered, in all market segments, to have a reasonable chance of hitting a 28%
sales target in the U.S. If any of these market segments failed to achieve at least a 20% market share,
others would need to pick up the slack.
5. An Initial Exploration of Policy: Competitiveness of PEVs in their
market segments
Given the need for rapid growth in the sales of individual PEV models, how can such rapid increases be
achieved? It all comes down to the competitiveness of PEVs. This section examines some aspects of
PEV sales and competitiveness in the U.S. to explore this question.
Earlier in the paper, it was noted that in the U.S. there is something of a “mismatch” between the
market segments where PEVs are offered and the market classes with high potential sales. PEVs are
mostly offered in the smaller car classes whereas in the U.S. large cars and light-duty trucks (SUVs,
pickups, vans) account for a large share of sales. In addition, the PEVs offered in these small classes
tend to be significantly more expensive than the vehicles they compete with. This is not surprising,
given that PEVs use expensive technology. Figure 19 breaks out US car sales (small, medium, and
28large/luxury cars) and shows the sales of each at different MSRP price points. This shows, for example,
that nearly all subcompact cars are sold for less than $27,000, and compact cars for less than $35,000.
Large cars and luxury cars, on the other hand, go up to about $60k with a small additional “wedge” over
$70k. Several recent models of PEV are also plotted (only with respect to the x axis; sales are not
reflected in the y axis position). These plots are intended to that these (fairly representative) models
tend to fall near the high end of their market classes.
Figure 19: USA car sales by price point and market class, 2013
If PEVs are going to compete in compact and mid-size car classes, they need to be competitive on price
in these categories, even given that theymay save significant fuel costs, and there are many other
attributes that matter (such as driving range, recharge time, environmental performance, driving
performance, etc.). Some consumers may be willing to pay a premium for PEVs, though others will not
choose them even at a price parity point
Figures 20a and 20b break down themidsize car class by price point, and include all sales of PEVs along
with other cars in 2013. In2013 PEVs were very expensive for vehicles within this class. While the
“modal” price range for these cars was $15-19k, followed closely by vehicles priced at $19-23k, plug-in
vehicles in this class were priced at $27k-35k. PEVs were actually very competitive with vehicles in the
$31-34k price range, accounting for more than 1/3 of sales; but this is a tiny market segment with total
sales of about 50,000 cars out of the 15 million sold in 2013.
29Figure 20a and 20b: US mid-size car sales by price point, without (top) and with (bottom) national PEV
incentives taken into account
900
Thousands 800
700
600
500
400
300
200
100
0
Non-PEVs PEVs
900
Thousands
800
700
600
500
400
300
200
100
0
Non-PEVs PEVs
In the U.S., the preponderance of PEV models in the mid-size car segment is correlated with the
potential demand for alternative fuel cars with low fuel consumption similar to the demand for hybrid
cars, but it is also associated with U.S. policies and incentives. The U.S. government price incentives of
$2500 to $7500 for PEVs (depending on specific vehicle characteristics) serves to effectively lower the
retail price of PEVs by enough to move them into lower price brackets, as shown in the figure. However,
even with these incentives the vast majority of PEVs were sold within the top three most expensive
30price brackets among mid-size cars. This suggests that even greater price breaks might be needed to get
PEVs more solidly into competition with the cars that dominate the mid-size car market in the US.
The impact of cutting the retail price of PEVs across the U.S. mid-size market segment is shown for a
more detailed range of cost brackets in Figure 21. Here the cumulative sales of all cars (and all car
classes) is shown, and several “inflection points” become apparent. Getting PEV price below $40k is
needed to begin to compete with market segments that have significant sales; getting it below $28k
opens the door to much greater increases in the numbers of vehicles it may compete with (at least on
price). Each $1000 drop in price increases the total number of vehicles that a PEV is price-competitive
with by about 1.5% between $40k and $28k, and this percentage rises to 6.5% below $28k. Thus, for
mid-size PEV car models that enter the market at $28k, each $1000 of price incentive high leverages the
price competitiveness of the model. Providing incentives for vehicles with MSRP above $40k does
comparatively very little.
Figure 21. The Impact of a $1000 vehicle price change on the potential market
The point of these figures is to demonstrate that a) for PEVs to have a chance to sell in large numbers,
they probably need to be offered with a retail price (with incentives) that puts them into market price
segments where a lot of cars are sold, and b) that once they are into such price segments, cutting their
price further can make them price competitive with many more vehicles than if it is done when they are
situated well above the high volume segments. In 2013 these conditions were generally not met for
most PEVs in the U.S., even with significant government subsidies.
31Next Study Phase: Scenario Development and Further Policy Considerations
The earlier discussion of PEV pricing policy is an important aspect of helping to make PEVs competitive,
but of course there are many other relevant issues. Researchers at UC Davis and elsewhere are
undertaking detailed studies of consumer behavior when buying (or not buying) PEVs as well as how
they use these vehicles, how often and where they recharge, how much they drive plug-in hybrids on
electricity (v. gasoline), etc. Policies that affect buying patterns (and vehicle production patterns) are
clearlya critical element of future PEV success (Lutsey, 2015b). A fuller treatment of all of the consumer
choice considerations, and how policies interact with these to increase the sales of PEVs, will be
conducted during the next phase of this study. This will include consideration of key factors that are
likely to drive demand for PEVs, with the following among the most important:
• Vehicle price
• Vehicle operating (e.g. fuel) cost
• Driving range
• Recharging time and availability/location of chargers
• Vehicle performance and reliability
• Other attributes of utility (e.g. vehicle interior volume, number of seats, trunk space)
• Environmental factors (e.g. CO2 and pollutant emissions)
• Operational incentives or disincentives (e.g. access to “clean vehicle zones” or “high occupancy
vehicle” lanes)
Understanding how all these factors are likely to interact, their relative importance to different vehicle
buyers, how they may change over time, and how they are affected by specific policies, is highly
complex. Further, all of these characteristics is likely to vary from country to country. Part II of this
study, during 2016, will examine these issues in some detail and across several sample countries, and
endeavour to glean some useful insights
32References
GEVO 2013, Global EV Outlook: Understanding the Electric Vehicle Landscape to 2020, International
Energy Agency, Clean Energy Ministerial and Electric Vehicles Initiative.
http://www.iea.org/publications/freepublications/publication/GlobalEVOutlook_2013.pdf
GEVO 2016, Global EV Outlook 2016: Beyond One Million Electric Cars, International Energy agency,
Clean Energy Ministerial and Electric Vehicles Initiative
https://www.iea.org/publications/freepublications/publication/global-ev-outlook-2016.html
GFEI 2014, Working Paper 9, How vehicle fuel economy improvements can save $2 trillion and help fund
a long-term transition to plug-in vehicles, authored by Lew Fulton, UC Davis,
http://www.globalfueleconomy.org/data-and-research/publications/gfei-working-paper-9
GFEI 2015, Working Paper 11, IEA Report Update 2014:
International comparison of light-duty vehicle fuel economy: Evolution over 8 years from 2005 to 2013,
http://www.globalfueleconomy.org/data-and-research/publications/gfei-working-paper-11
IEA 2016, Energy Technology Perspectives 2016: Towards Sustainable Urban Energy Systems,
International Energy Agency, OECD, Paris. http://www.iea.org/etp/etp2016/
Lutsey, Nic, 2015a, Global Climate Change Mitigation Potential from a Transition to Electric Vehicles,
ICCT, http://www.theicct.org/sites/default/files/publications/ICCT_ghg-reduction-potential-
evs_201512.pdf
Lutsey, Nic, 2015b, Transition to a Global Zero-emission Vehicle Fleet: A Collaborative Agenda for
Governments.
http://www.theicct.org/sites/default/files/publications/ICCT_GlobalZEVAlliance_201509.pdf
McKinsey/ARF, 2014, Electric Vehicles in Europe: Gearing up for a New Phase? McKinsery Corp and
Amsterdam Roundtables Foundation
http://www.mckinsey.com/~/media/McKinsey%20offices/netherlands/latest%20thinking/PDFs/electric-
Vehicle-report-en_as%20Final.ashx
UN, 2015, Sustainable Development Goals, Goal 7: Ensure access to affordable, reliable, sustainable and
modern energy for all, http://www.un.org/sustainabledevelopment/energy/
UNFCCC (2015), Paris Declaration on Electro-Mobility and Climate Change and Call to Action, released
during COP 2015, Paris, http://newsroom.unfccc.int/lpaa/transport/the-paris-declaration-on-electro-
mobility-and-climate-change-and-call-to-action/
33Data sources for this study have included:
• IEA MoMo Database as used in the ETP 2016, International Energy Agency, Paris.(note that the
PEV data used in this study does not match the latest IEA data used in, for example, the GEVO
2016 publication as this was not available to UC Davis.)
• Blogspot website, http://ev-sales.blogspot.com
• European Alternative Fuels Observatory, http://www.eafo.eu
• Inside EVs website, http://insideevs.com
• Various manufacturer websites
3450BY50
GLOBAL FUEL ECONOMY INITIATIVE
What is the Global Fuel Economy Initiative?
The Global Fuel Economy Initiative believes that large gains
could be made in fuel economy which would help every
country to address the pressing issues of climate change,
energy security and sustainable mobility. We will continue
to raise awareness, present evidence, and offer support
to enable countries to adopt effective fuel economy
standards and policies that work in their circumstances
and with their vehicle fleet.
Secretariat Contact us
Global Fuel Economy Initiative Email: info@globalfueleconomy.org
60 Trafalgar Square Web: www.globalfueleconomy.org
London
WC2N 5DS @GlobalFuelEcon | #GFEINetwork
United Kingdom
+44 (0)207 930 3882 (t) www.youtube.com/GlobalFuelEcon
+44 (0)207 930 3883 (f)
www.flickr.com/50by50campaign
U NEP
With the support ofYou can also read