MECHANISMS OF DAMAGE DURING TYPHOON HAIYAN: STORM SURGE, WAVES, AND "TSUNAMI- LIKE" SURF BEAT
←
→
Page content transcription
If your browser does not render page correctly, please read the page content below
E-proceedings of the 36th IAHR World Congress
                                                                                   28 June – 3 July, 2015, The Hague, the Netherlands

 MECHANISMS OF DAMAGE DURING TYPHOON HAIYAN: STORM SURGE, WAVES, AND “TSUNAMI-
                                LIKE” SURF BEAT

                                                                     (1)                     (2)
                                               JEREMY D. BRICKER           & VOLKER ROEBER
                      (1)
                             International Research Institute of Disaster Science, Tohoku University, Sendai, Japan,
                                                           bricker@irides.tohoku.ac.jp
                       (2)
                             International Research Institute of Disaster Science, Tohoku University, Sendai, Japan
                                                          roeber@irides.tohoku.ac.jp

ABSTRACT
Typhoons cause damage by a variety of mechanisms: wind, large waves, and storm surge. Storm surge itself has three
components: pressure-driven setup (the inverse barometer effect), wind-driven setup (wind pushing water onshore), and
breaking-wave-induced setup (breaking waves pushing water onshore). Numerical modeling shows that in the fringing-
reef-protected town of Hernani during Typhoon Haiyan, pressure- and wind-driven setup were small, while breaking-wave-
induced setup varied in time as the envelope of large and small incident wave groups (sets), resulting in an infragravity
oscillation. The surf beat contained energy in a frequency range close to the natural resonant mode of the reef, which
amplified the energy of the surf beat (Nakaza and Hino, 1991; Nwogu and Demirbilek, 2010). During propagation over the
reef, the amplified surf beat steepened nonlinearly, and impacted the town as a tsunami-like bore, resulting in extensive
damage and casualties. Since coastal hazard planning presently relies on phase-averaged wave modeling, infragravity
surges such as the one that struck Hernani are not currently being accounted for, highlighting the necessity for a change
of policy and the adoption of phase-resolving wave models in regions protected by fringing coral reefs.

Keywords: Storm surge; surf beat; Typhoon Haiyan; OpenFOAM; Delft-3D/SWAN

1.   INTRODUCTION
The town of Hernani, Eastern Samar, in the Philippines is a fishing and agricultural community protected from the open
Pacific Ocean by a wide fringing reef. The tsunami-like bore (Figure 1; Gensis, 2013) that struck the town during Typhoon
Haiyan on November 8, 2013 astonished both villagers and disaster managers, as the coast near Hernani is sheltered by
a broad coral reef (Figure 2), which was expected to serve as a reliable wave defense (Ferrario et. al, 2013). Popular
media (i.e., BBC, 2013) have been confused by this event, incorrectly reporting it as storm surge, which refers to the rise
in still water level due to barometric-, wind-, and breaking-wave-induced setup (NOAA, 2014), which the research
presented below shows was not the case in Hernani. Based on the authors’ own interviews on site, local residents
believed that the typhoon triggered a landslide, which resulted in a near-field tsunami. However, no tsunami-genic
earthquake or landslide seismicity was reported. Furthermore, a similar tsunami-like flood was reported to have occurred
during the October 12, 1897 typhoon (Bankoff, 2007; Municipality of Hernani, 2014), underscoring the likelihood that the
bore was a direct consequence of the typhoon, and not a tsunami that happened to occur simultaneously. Even within the
coastal engineering community the event has been a mystery because the destructive bore lasted for a few minutes
(Nobuoka et. al., 2014), much longer than what would correspond to storm-induced ocean wind waves, which generally
have periods of less than 20 seconds. Additionally, the town’s seawall was not high enough to cause such a dam-break-
like wave when it collapsed during the typhoon, as the seawall crest was 2.5 m above mean sea level (MSL), while the
foundation of the house seen in Figure 1 was 3 m above MSL. Furthermore, Wikipedia (2014) incorrectly reports the
Hernani event as a meteotsunami, though the offshore bathymetry rapidly drops to hundreds of meters depth immediately
offshore of the reef. This is too deep for the generation of a meteotsunami (Monserrat et. al., 2006; Hibiya and Kajiura,
1982), which requires a broad shelf sea of depth on the order of 10’s of meters so that the long wave speed is close to the
propagation speed of the storm (less than 20 m/s).
The grave significance of the damage in Hernani is that the mechanism which caused the destruction is unaccounted for
in coastal hazard assessment, evacuation planning, and structural building codes. Hernani is protected by a fringing reef,
offshore from which the seabed rapidly drops to the 7 km deep Philippine Trench. In such deep water, wind-driven setup is
no larger than a few 10’s of centimeters and therefore of the same order as the setup caused by the barometric pressure
drop in the eye of the storm (Bricker et. al., 2014). This is in contrast to the situation around the city of Tacloban, on Leyete
Island to the west. Tacloban is located at the end of a shallow bay with a maximum water depth of 50 m. The strong winds
from Typhoon Haiyan pushed enough water onshore to cause up to 6 m of storm surge to flood the city of Tacloban (Mori
et. al., 2014). In addition, the wind-generated waves on top of this surge also destroyed buildings along the shoreline
(Bricker et. al., 2014). Storm surge and damage of the type seen in Tacloban were predicted with great accuracy (Sun
Star, 2013), as similar wind-driven surges have been studied for decades, with some outstanding examples being
Hurricane Katrina in the US, the Bhola cyclone in Bangladesh, and the Ise-Bay typhoon in Japan. Each of these events
affected low-lying land at the head of a shallow bay, similar to the geographic setting of Tacloban. Destructive bores in
places fronted by fringing coral reefs dropping quickly to deep water as in Hernani, however, have not been investigated
other than in the pioneering laboratory work of Nakaza and Hino (1991) and numerical model of Nwogu and Demirbilek

                                                                                                                                        1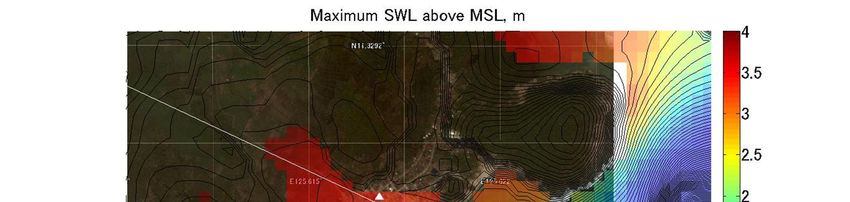
E-proceedings of the 36th IAHR World Congress,
28 June – 3 July, 2015, The Hague, the Netherlands
(2010), both of which showed that the interaction of incident wave groups with resonance over the reef topography
resulted in a “tsunami-like” or “bore-like” surf beat on shore. The video of Gensis (2013) offers the first chance to compare
model results to an actual event of this sort in the field. The present paper shows that this phenomenon can be
successfully reproduced with a phase-resolving model.
Section 2 of this paper discusses a field survey carried out to measure topography and bathymetry near Hernani. Section
3 outlines the setup of the phase-averaged Delft-3D/SWAN model used to hindcast the still water level and spectral wave
parameters affecting Hernani. Section 4 presents results of the phase-averaged modeling, which cannot successfully
reproduce the flow seen in Figure 1. Section 5 details the setup of the phase-resolving OpenFOAM Volume of Fluid (VOF)
model used to simulate the impact of surf beat on Hernani. Section 6 explains the results of the phase-resolving modeling,
which does successfully reproduce the flow seen in Figure 1. Section 7 summarizes the results and makes suggestions for
better coastal disaster preparedness.
0 sec 4 sec
15 m
10 m
8 sec 12 sec
Figure 1. Frames from the video of Gensis (2013), showing a house being swept away by an infragravity wave. Onshore-directed flow
lasted at least 20 seconds (the duration of the film). The base of the house is located 3 m above mean sea level (MSL). Images courtesy
of Plan International.
2. FIELD SURVEY
Land surface elevation in Hernani was measured from May 25-26, 2014 via walking and driving surveys with two Ashtech
ProMark 100 GPS units, in base/rover differential configuration (Figure 2). The base station was left in place for 4 hours, in
order to ensure vertical accuracy on the order of centimeters. DGPS data were post-processed for vertical accuracy with
GNSS Solutions software, to correct the rover-measured elevations to the base-station accuracy. The base station
elevation was surveyed with respect to local instantaneous sea level at the beginning of each measurement day with a
LaserTech TruPulse 200 rangefinder, and this was related to local mean sea level (MSL) using the TPXO (2014) global
tide database.
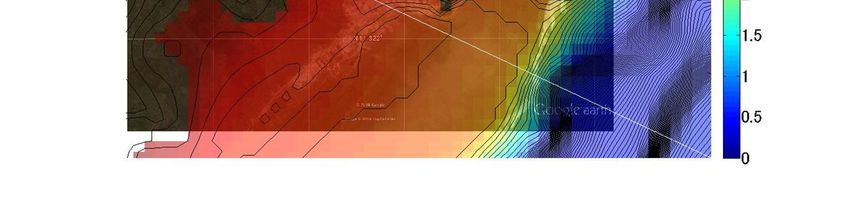
Figure 2. Overview of Hernani. Red lines indicate DGPS field survey locations, red dots indicate bathymetric survey locations, the white
triangle indicates the location of the house in Figure 1, and the white line indicates the transect used for phase-resolving modeling. Inset
at the top left shows DGPS survey locations from Guiuan 35 km to the southeast.
2
E-proceedings of the 36th IAHR World Congress
                                                                 28 June – 3 July, 2015, The Hague, the Netherlands

Water depth seaward of the coral reef crest (Figure 2) was measured from a hired fishing canoe, using a Hondex PS-7
handheld digital sounder. Sounder readings were photographed with a Canon PowerShot D20 GPS camera to record the
location of each measurement.
Since the elevation of the coral reef flat in Hernani was not measured during the May 25-26 field campaign in Hernani, the
reef flat elevation of a similar reef in Guiuan (35 km southeast of Hernani; see inset at top-left of Figure 2) was measured
during low tide on May 27, using the same DGPS base/rover configuration as described above, and corrected to local
MSL using TPXO (2014). The measured reef flat elevation was flat and uniform, varying from MSL to about 10 cm below
MSL. Therefore, for the storm surge modeling to follow, the reef flat in Hernani was assumed to have an elevation of 5 cm
below MSL in the area surrounded by the topography and bathymetry measurements show in Figure 2.
3.   PHASE-AVERAGED WAVE AND STORM SURGE MODEL SETUP
The behavior of Typhoon Haiyan was hindcast using typhoon track data from the Japan Meteorological Agency (2013),
which was input into Holland’s (1980) parametric hurricane model for air-pressure field estimation, followed by the moving-
typhoon model of Fujii & Mitsuda (1986) as described in Veltcheva & Kawaii (2002) for estimation of the wind field. The
typhoon track data included data on location of the center of the storm, surface-level air pressure at the storm center, and
maximum sustained wind speed vmax [m/s]. However, it did not contain information on the radius to maximum winds rm [m],
so the relation of Quiring (2011) is used to estimate this (Eq. [1)].
                                    = 1852(49.67 − 0.47         )                                     [1]

The hindcast pressure and wind fields were input into a combined hydrodynamic and wave model to hindcast the water
level and wave heights induced by the typhoon. The hydrodynamic model used was Delft-3D applied with only 1 layer in
the vertical (thus the shallow water equations), and the spectral wave model used was SWAN. Delft-3D and SWAN were
run together, with the hydrodynamic model repeatedly passing water level and current fields to the wave model, which
calculated the wave field including the effects of currents and storm surge. The wave model in turn passed the radiation
stress field back to the hydrodynamic model, which used this information to calculate breaking-wave-induced setup and
nearshore currents.
The Delft-3D/SWAN model was run using domain decomposition. The large domain (125°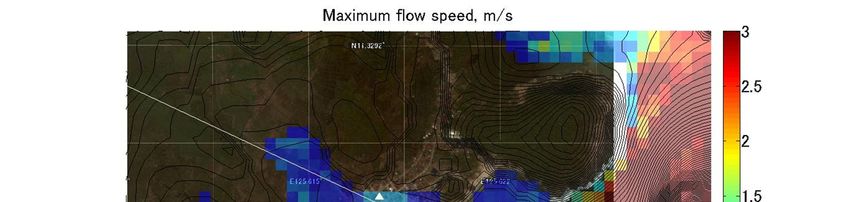
E-proceedings of the 36th IAHR World Congress,
28 June – 3 July, 2015, The Hague, the Netherlands

Figure 3. Top: still water level from storm surge (including pressure-, wind-, and breaking-wave-induced setup) and significant wave
height at the location of the house seen in Figure 1, as hindcast by the Delft-3D/SWAN model. The inset focuses in on the initial arrival of
the storm surge. Bottom: Depth averaged flow speed from storm surge and maximum wave-induced orbital velocity at the location of the
house seen in Figure 1, as hindcast by the Delft-3D/SWAN model. Time is shown in Japan Standard Time on November 8, 2013. The
time lag between storm surge and wave results is due to SWAN using a grid staggered compared to that used by Delft-3D, and also due
to the 15 minute interval between SWAN runs. The difference in elevation between the house foundation (3 m above MSL) and the
ground elevation shown in the model (2.6 m above MSL) is due to model grid resolution.

Figure 4. Maximum still water level in Hernani from the phase-averaged Delft-3D/SWAN model. White line indicates the transect used in
phase-resolving simulations, and white triangle indicates the location of the house in Figure 1. Black lines are elevation contours at 1 m
intervals. Map orientation is north up.

5.    PHASE-RESOLVING VOF MODEL SETUP
In order to evaluate the potential for infragravity motion (surf beat and resonance) to create the bore seen in Figure 1, the
InterFOAM phase-resolving Volume of Fluid (VOF) Navier Stokes Solver, part of the OpenFOAM CFD package, was used.
OpenFOAM was applied along a 1-dimensional transect (Figures 2, 4, 5, and 6) passing through the house seen washed
away in Gensis’ film, with a variable grid size reducing to a minimum of 0.5 m in the vertical and 2 m in the horizontal
within the region of wave breaking and runup. Figure 7 shows the bathymetry and topography of the model domain,
derived from the GPS and echosounder field survey described in section 2 of this paper. A uniform roughness height of 1
cm was assumed for both the seabed and coral/land surface. The upper and right-hand boundaries of the domain were
assumed to be open to the atmosphere. Turbulence was modeled with the RANS standard k-epsilon model. The PISO
algorithm was used for transient Navier-Stokes solution. First order-implicit Euler differencing was used for differencing the
unsteady term, second-order Gaussian for the pressure gradient, second-order upwind for momentum advection terms,
first-order upwind for turbulence advection, and second-order Gaussian for the diffusion term. Quantities on grid cell faces
4
E-proceedings of the 36th IAHR World Congress
28 June – 3 July, 2015, The Hague, the Netherlands
were determined using linear interpolation. Enhanced interface compression (anti-diffusion) was enacted in order to
maintain a sharp air-water interface. The model time step was variable, to keep the Courant number below 0.5. Typically,
this resulted in a time step on the order of 0.001 sec.
Figure 5. Maximum flow speed in Hernani from the phase-averaged Delft-3D/SWAN model. White line indicates the transect used in
phase-resolving simulations, and white triangle indicates the location of the house in Figure 1. Black lines are elevation contours at 1 m
intervals. Map orientation is north up
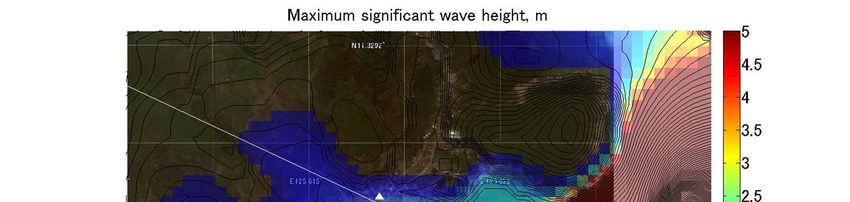
Figure 6. Maximum significant wave height in Hernani from the phase-averaged Delft-3D/SWAN model. White line indicates the transect
used in phase-resolving simulations, and white triangle indicates the location of the house in Figure 1. Black lines are elevation contours
at 1 m intervals. Map orientation is north up.
The left-hand boundary of the OpenFOAM model (located at a distance x=290 m in Figure 7) was a smooth-surface
piston-type wavemaker, implemented via the dynamic mesh capability of the InterDyMFOAM model. To generate the
motion of the piston, the SWAN wave spectrum output at the peak of the storm (Figure 8, with significant wave height 19
m and peak wave period 18 sec, at 6:30 am JST) was extracted in 150 m water depth offshore of Hernani. The variance of
each spectral frequency component was converted to a corresponding piston stroke length via the complete wavemaker
theory of Dean and Dalrymple (1991) shown as Eq. [2]
2( (2 ℎ) − 1) [2]
=
ℎ(2 ℎ) + 2 ℎ
where H is wave height (proportional to the square root of the variance), S is stroke length, h is water depth, and k is
wavenumber determined via the full dispersion relation for each frequency component. The piston stroke length spectrum
5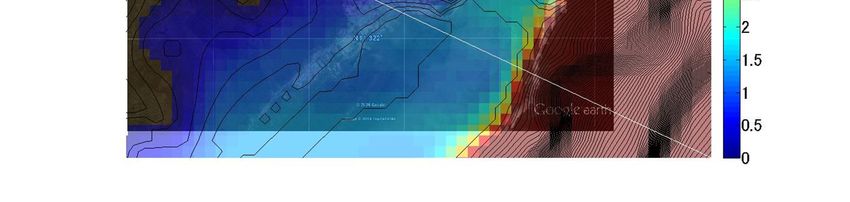
E-proceedings of the 36th IAHR World Congress,
28 June – 3 July, 2015, The Hague, the Netherlands

was then inverse Fourier transformed into a time series of piston position via an assumption of random initial phase for
each individual frequency component. The spacing between frequency bins df was small enough to avoid creating artificial
wave envelope beating (which occurs at a return period of 1/df) during the 1-hour time series for which the OpenFOAM
model was run. This piston position time series was used to drive the left wall of the model as a wavemaker. Waves were
then allowed to propagate freely and break over the reef and shoreline.
In addition to the OpenFOAM simulation, a 1-dimensional BOSZ (Roeber and Cheung, 2012) Boussinesq wave simulation
was run over the same model domain with the same input wave timeseries. This allowed the direct comparison of results
from two completely different types of numerical models. The BOSZ model setup and results are described in depth in
Roeber and Bricker (in prep.).
6.   PHASE-RESOLVING VOF MODEL RESULTS
Figure 9 shows the time series of water level hindcast by OpenFOAM at the house in Figure 1, and Figure 10 shows flow
velocity. Both OpenFOAM and BOSZ give similar results, with the exception of the arrival time of the initial wave. This is
due to the difference in wave breaking processes resolved over the reef. OpenFOAM resolves the physics of wave
breaking, and so reproduces the distortion of waves as they plunge and collapse. BOSZ, though correctly reproducing the
energy loss due to breaking, represents all breakers as a shock front. Regardless of this difference, both models produce
similar results for water level and flow speed at the house, giving confidence in each model’s result. In both models,
individual short-period swell (10-20 sec period) are not prominent at this location. Rather, infragravity oscillations with
periods of hundreds of seconds are visible. The flow depth (up to 3 m above the ground level at the house), flow speed
(up to 6 m/s), and landward flow duration (on the order of minutes) are in close agreement with the video of Gensis (2013),
in which a flow depth of approximately 2 m, flow speed of greater than 5 m/s, and landward flow duration of at least 20
seconds (before the video ceased) were observed. Also in agreement with the video, each of these modeled infragravity
oscillations strikes the location of the house as a sharp bore of 1 m to 2 m height. This is the same phenomenon
generated in the laboratory by Nakaza and Hino (1991) and modeled by Nwogu and Demirbilek (2010), and which these
authors termed “bore-like” or “tsunami-like” surf beat.

Figure 7. Left: bathymetry and topography of transect used in 1-D OpenFOAM simulation, as a function of distance x along the transect.
Right: Zoomed in topography of the reef and onshore region. Dashed line indicates the location of the house swept away by the tsunami
as seen in Figure 1. The spike seaward of the house is the town’s seawall.

Figure 8. Wave variance spectrum output from SWAN in 150 m water depth offshore of Hernani, and used to drive the wavemaker at
x=290 m (left boundary) in the OpenFOAM domain of Figure 7.

6
E-proceedings of the 36th IAHR World Congress
                                                                        28 June – 3 July, 2015, The Hague, the Netherlands

6.1 Spectral analysis
The physics responsible for the generation of tsunami-like surf beat can be understood by Figures 11, 12, and 13. Figure
11 shows time series of instantaneous water surface elevations throughout the OpenFOAM domain (Figure 7) over the
course of the simulation. Figure 12 shows the spatial variation of the power spectral density of the water surface elevation
signal, and Figure 13 shows the same for the velocity signal, along the transect of Figure 7. Seaward of the reef crest
(x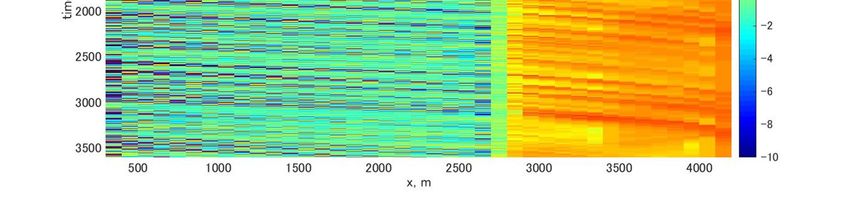
E-proceedings of the 36th IAHR World Congress,
28 June – 3 July, 2015, The Hague, the Netherlands
2 [3]
=
ℎ
where L in the length of the domain, g is acceleration due to gravity, h is water depth, and n is a positive integer. However,
since the depth of the domain in Figure 7 is irregular, the basin seiche period must be evaluated numerically by dividing
the domain into bins of width dx. The time it takes a long wave to propagate over a bin is dt=dx/ui, where ui=(ghi)1/2 is the
long wave speed in a cell of depth hi. The fundamental (n=1) seiche period is the time it takes a long wave to propagate
from the left wall of the domain, reflect from the reef face (at x=2700 m, which is the shoreward-most extent of this energy
band in Figure 12), and then propagate back to the left wall. This fundamental period is numerically found to be T=150 sec,
corresponding to the f=0.0065 Hz energy band in Figure 12. This energy band shows two antinodes (one at the
wavemaker and one at the reef face) and one node in between, as expected for a fundamental period basin seiche. The
n=2 mode seiche is responsible for the energy band at f=0.013 Hz, which is composed of 3 antinodes and two nodes. The
n=3 mode, composed of 4 antinodes and 3 nodes, is visible at f=0.0195 Hz. Even though this basin seiche is a model
artifact (due to reflection occurring at the wavemaker) and is not present in reality, its presence in the model is small
enough that it does not have a significant effect on the modeled flow over the reef or over land, as in Figure 12 little energy
is present in these bands shoreward of the reef face. Furthermore, since both basin seiche modes are present only in
deep water, neither signal is visible in Figure 13, as in deep water the depth-averaged velocity generated by the seiche is
small.
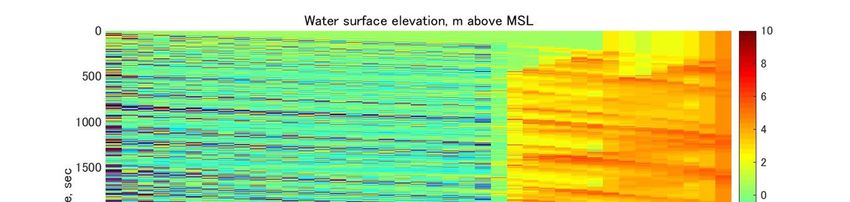
Figure 11. Time series of instantaneous water surface elevations extracted at 100 m intervals along the OpenFOAM transect. The dark
lines in deep water (x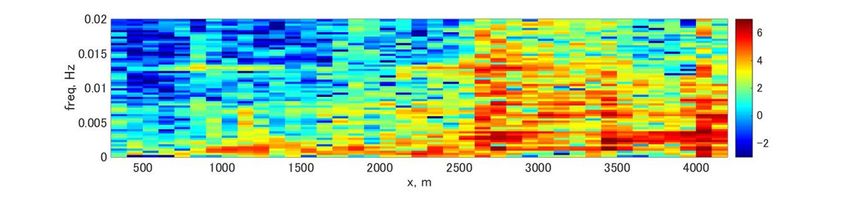
E-proceedings of the 36th IAHR World Congress
                                                                        28 June – 3 July, 2015, The Hague, the Netherlands

present over the reef and land in Figure 12 at two superharmonics of this signal (f=0.008 Hz and f=0.012 Hz). These
superharmonics are due to steepening of the surf beat, the process responsible for the bore-like shape of the observed
and modeled surf beat.

Figure 12. Power spectral density of water surface elevation extracted at 100 m intervals along the OpenFOAM transect. Top plot shows
the entire spectrum, while bottom shows only infragravity frequencies.

Figure 13. Power spectral density of flow velocity extracted at 100 m intervals along the OpenFOAM transect. Velocity data are extracted
from the grid cells at elevation 20 m below MSL at x2700m. Top plot
shows the entire spectrum, while bottom shows only infragravity frequencies.

6.4 Reef resonance
The lowest-frequency energy band is due to the excitation of resonance over the reef. The resonant period of a quarter-
wave oscillator is given by Eq. [6]
                                                       4                                                       [6]
                                              =
                                                  (2 − 1)      ℎ

where T is resonant period, L is cross-shore length of the reef, g is acceleration due to gravity, h is mean water depth, and
n is a positive integer. For the reef of Figure 7, the length of interest is the distance between the location where the waves
begin to break (approximately x=2700 m, according to Figure 12 and Figure 13), and the seawall (at x=3310 m), leading to
L=710 m. The average water depth over the reef during the simulation is h=4m. This results in a quarter-wave oscillator
period of T=450 sec, corresponding to a frequency of approximately f=0.0022 Hz. Landward of the breaking region,

                                                                                                                                      9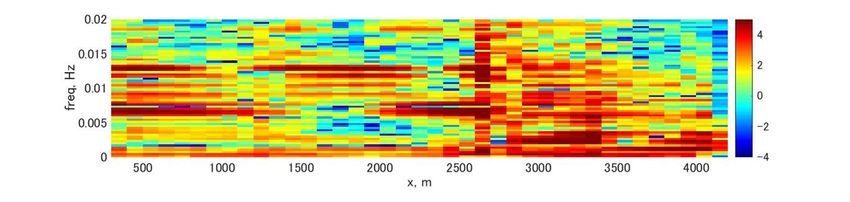
E-proceedings of the 36th IAHR World Congress,
28 June – 3 July, 2015, The Hague, the Netherlands

Figure 12 and Figure 13 show that most of the infragravity energy is present at this quarter-wave oscillator frequency,
indicating that resonance over the reef played a large role in exacerbating damage in Hernani. Some energy at this
frequency is even present in the deep-water portion of the domain; this is likely due to sloshing of the signal from the reef
back into deep water.
Figure 11 shows the occurrence of reflections from the seawall. An example of this occurs when the first wave set of the
simulation reaches the seawall at time t=250 sec. When the reflected wave returns to the reef crest (x=2700 m) at time
t=500 sec, it encounters another large wave group incident on the reef crest at the same time. This is the fundamental
mechanism of resonance, and occurs throughout the duration of the simulation. In addition to reflections from the seawall,
reflections also occur at the landward extent of runup (x=4200 m). Multiple locations of reflection, combined with
temporally and spatially varying water depth, create complicated modes of resonance occurring over this topography.
Therefore, in addition to the simplified resonance analyzed with Eq. [6], longer period modes also exist.
7.   CONCLUSIONS
Numerical model results show that the tsunami-like bore which struck Hernani, Eastern Samar during Typhoon Haiyan
was generated by infragravity energy released from wave groups overlapping closely in the spectral domain with the
natural resonant frequency of the reef. This is the same phenomenon recreated in the laboratory by Nakaza and Hino
(1991) and modeled numerically by Nwogu and Demirbilek (2010). In the present work, similar results were obtained
using two entirely different types of phase-resolving models: the OpenFOAM Volume-of-Fluid (VOF) model and the BOSZ
Boussinesq wave model. The agreement between these models corroborates the validity of each model’s result.
Since the actual topography and bathymetry of Hernani vary substantially in 2 dimensions, the results presented here are
admittedly oversimplified. In a 2-dimensional model, greater asymmetry between incident and return flow at the house of
Figure 1 would likely occur, as during tsunami-like events incident flow tends to be uniform while return flow is
concentrated in low-lying areas (Mano et. al., 2013). As Figure 4 shows, the house is located on a slope of relatively high
ground with lower ground to the south and west, so it is expected that a 2-dimensional simulation would result in a more
rapid and larger drop in water level at the house when return flow commences after each bore. Furthermore, incident wave
directionality and longshore resonant modes may complicate the infragravity signal seen at the house. This is under
investigation by Roeber and Bricker (in prep.).
Regardless of the details of the physical processes involved in the event, the failure of the phase-averaged Delft-
3D/SWAN model to reproduce this event underscores the importance of phase-resolving modeling for coastal disaster
assessment in regions protected by fringing reefs. Phase-resolving models (which simulate individual ocean waves) are
not commonly used in coastal disaster planning in the US, Europe, or elsewhere. As such, the phenomenon that struck
Hernani is not being accounted for. In the US, FEMA and the National Flood Insurance Program determine the coastal
wave hazard zone (V-zone for flood insurance rate map assessment) by use of a shallow water model together with a
phase-averaged wave model (commonly the Delft-3D/SWAN or ADCIRC/SWAN coupling, which estimate statistical wave
properties, but do not resolve individual ocean wind waves). For places near shallow water (such as Tacloban, New
Orleans, Bangladesh, and Nagoya), this is sufficient, but the hazard potential is being underestimated for places fronted
by fringing reefs (such as Hernani, Hawaii, Puerto Rico, and Okinawa). This is also important for areas being developed
for oil and gas terminals. For these places, coastal hazard must be assessed with a phase-resolving model such as BOSZ
or OpenFOAM.

This research has shown that in the face of extreme storm waves, the presence of a fringing coral reef may not protect the
shore landward of it, and may even amplify and transform incident wave groups into tsunami-like surf beat. In order to
reduce casualties and property loss due to events like the one in Hernani, knowledge of the cause and potential for onset
of this tsunami-like phenomenon must be proliferated, and reef-protected communities should implement appropriate
countermeasures, such as evaluation of the potential for onset of tsunami-like bores via phase-resolving model studies,
construction of protective structures of sufficient strength, and drafting or updating of evacuation plans.
ACKNOWLEDGMENTS
This work was funded by an IRIDeS Tokutei Project grant, and by the JSPS-NSF Cooperative Program for
Interdisciplinary Joint Research Projects in Hazards and Disasters, project entitled “Evolution of Urban Regions in
Response to Recurring Disasters”. We are also grateful to Shuichi Kure for facilitating the IRIDeS field surveys after
Typhoon Haiyan.
REFERENCES
Bankoff, G. (2007). Storms of History: Water, hazard, and society in the Philippines. In A world of water: rain, rivers, and
    seas in Southeast Asian Histories (Boomgaard, P., ed.). KITLV Press, Leiden.
BBC News Asia (2013). Typhoon Haiyan Storm Surge Destroys House in Seconds. http://www.bbc.com/news/world-asia-
    24985592.
Bricker, J., Takagi, H., Mas, E., Kure, S., Adriano, B., Yi, C., and Roeber, V. (2014). Spatial variation of damage due to
    storm surge and waves during Typhoon Haiyan in the Philippines, Journal of Japan Society of Civil Engineers, Ser. B2
    (Coastal Engineering), Vol. 70, No. 2, I_231-I_235.
Dean, R.G., and Dalrymple, R.A. (1991). Water Wave Mechanics for Engineers and Scientists. Advanced Series on
    Ocean Engineering Volume 2. World Scientific. Singapore. 353p.
Dietrich, J.C., Westerink, J.J., Kennedy, A.B., Smith, J.M., Jensen, R.E., Holthuisjen, L.H., Dawson, C., Luettich, R.A. Jr.,
    Powell, M.D., Cardone, V.J., Cox, A.T., Stone, G.W., Pourtaheri, H., Hope, M.E., Tanaka, S., Westerink, L.G.,

10
E-proceedings of the 36th IAHR World Congress
28 June – 3 July, 2015, The Hague, the Netherlands
Westerink, H.J., and Cobell, Z. (2011). Hurricane Gustav (2008) waves and storm surge: hindcast, synoptic analysis,
and validation in southern Louisiana, Monthly Weather Review, Vol. 39, pp. 2488-2522.
Ferrario, F., Beck. M.W., Storlazzi, C.D., Micheli, F., Shepard, C.C., and Airoldi, L. (2014). The effectiveness of coral reefs
for coastal hazard risk reduction and adaptation. Nature Communications. 5:3794..
Fujii, T., and Mitsuda, Y. (1986). Synthesis of a stochastic typhoon model and simulation of typhoon winds. Annuals
Disaster Prevention Research Institute, Kyoto University, No. 29 B-1 pp. 229-239.
GEBCO (2014). General Bathymetric Chart of the Oceans. British Oceanographic Data Center. http://www.gebco.net.
Gensis, N. (2013). Plan International video: Typhoon washes house away. http://plan-international.org/about-
plan/resources/videos/video-typhoon-washes-house-away/.
Hibiya, T., and Kajiura, K. (1982). Origin of the Abiki phenomenon (a kind of seiche) in Nagasaki Bay, Journal of the
Oceanographical Society of Japan, Vol. 38, pp. 172-182.
Holland, G.J. (1980). An analytic model of the wind and pressure profiles in hurricanes. Monthly Weather Review. v. 108
pp. 1212-1218.
Holthuijsen, L.H. (2007). Waves in Oceanic and Coastal Waters. Cambridge University Press. 387 pages.
Japan Meteorological Agency (2013). Regional Specialized Meteorological Center Tokyo – Typhoon Center, Best Track
Data, http://www.data.jma.go.jp/fcd/yoho/data/typhoon/T1330.pdf
Lounget-Higgins, M.S. (1984). Statistical Properties of Wave Groups in a Random Sea State. Philosophical Transactions
of the Royal Society of London, Series A, Mathematical and Physical Sciences, Vol. 312, Issue 1521, pp219-250.
Mano, A., Iida, T., Udo, K., and Tanaka, H. (2013). Breaking process and mechanism of coastal levees on Sendai Bay
Coast hit by 2011 mega tsunami. Proceedings 12th International Coastal Symposium (Plymouth, England), Journal of
Coastal Research, Special Issue No. 65, Conley, D.C, Masselink, G., Russell, P.E., and O’Hare, T.J. (eds.), pp. 772-
777.
Masselink, G. (1995). Group bound long waves as a source of infragravity energy in the surf zone. Continental Shelf
Research. Vol. 15, No. 13, pp1525-1547.
Monserrat, S., Vilibic, I., and Rabinovich, A.B.: Meteotsunamis (2006). Atmospherically induced destructive ocean waves
in the tsunami frequency band. Natural Hazards and Earth Systems Science. 6, 1035-1051.
Mori, N., Kato, M., Kim, S., Mase, H., Shibutani, Y., Takemi, T., Tsuboki, K., and Yasuda, T. (2014). Local amplification of
storm surge by Super Typhoon Haiyan in Leyte Gulf. Geophysical Research Letters, 41, 5106-5113.
Municipality of Hernani (2014). Homepage http://www.hernani-esamar.gov.ph/index.php/history.html
Nakaza, E., and Hino, M. (1991). Bore-like surf beat in a reef zone caused by wave groups of incident short period waves.
Fluid Dynamics Research 7, 89-100.
NASA (2014). Shuttle RADAR topography mission (SRTM). http://www2.jpl.nasa.gov/srtm/
NOAA (2014). Storm Surge Overview. Website of the National Weather Service. http://www.nhc.noaa.gov/surge/
Nobuoka, H., Yasuda, T., Tajima, Y., Mori, N., Shimozono, T., Sasaki, J., Tsujio, D., Kennedy, A., and Miyamoto, M.
(2014). Coastal Flood Disaster due to Historic Typhoon Haiyan in Hernani, Eastern Samar Province, Philippines.
Journal of Japan Society of Civil Engineers, Ser. B2 (Coastal Engineering) 70 (2) I_1426-I_1430, in Japanese.
Nwogu, O., and Demirbilek, Z. (2010). Infragravity wave motions and runup over shallow fringing reefs. Journal of
Waterway, Port, Coastal, and Ocean Engineering, ASCE 136, 295-305.
Powell, M. D. (2006). Drag coefficient distribution and wind speed dependence in tropical cyclones. Final report to the
NOAA Joint Hurricane Testbed (JHT) Program, 26 pp.
Quiring, S., A. Schumacher, C. Labosier, and Zhu, L. (2011). Variations in mean annual tropical cyclone size in the
Atlantic, J. Geophys. Res., 116, D09114, doi:10.1029/2010JD015011.
Roeber, V., and Bricker, J.D. (in prep.) Destructive tsunami-like bore generated by surf beat over coral reef during
Typhoon Haiyan.
Roeber, V., and Cheung, K.F. (2012). Boussinesq-type model for energetic breaking waves in fringing reef environments.
Coastal Engineering, Vol.70(1), pp.1-20.
Sun Star (2013). Storm Surge: Biggest Threat from Tropical Cyclone. http://www.sunstar.com.ph/breaking-
news/2013/11/11/storm-surge-biggest-threat-tropical-cyclone-313195
Tajima, Y., Yasuda, T., Pacheco, B.M., Cruz, E.C., Kawasaki, K., Nobuoka, H., Miyamoto, M., Asano, Y., Arikawa, T.,
Ortigas, N.M., Aquino, R., Mata, W., Valdez, J., and Briones, F. (2014). Initial Report of JSCE-PICE Joint Survey on
the Storm Surge Disaster Caused by Typhoon Haiyan. Coastal Engineering Journal. Vol. 56, No. 1, 1450006 (12
pages).
TPXO (2014). The OSU TOPEX/POSEIDON Global Inverse Solution. http://volkov.oce.orst.edu/tides/global.html.
Veltcheva, A., and Kawai, H. (2002). Investigation of the typhoon pressure and wind field with application for storm surge
estimation. Report of the Port and Airport Research Institute, vol. 41 no. 2 pp. 23-44.
Wikipedia (2014). http://en.wikipedia.org/wiki/Storm_surge.
Wu, J. (1982). Wind-Stress Coefficients Over Sea Surface From Breeze to Hurricane, Journal of Geophysical Research,
Vol. 87, No. C12, pp. 9704-9706, Nov. 20.
11You can also read