Influence of oxygen source on the ferroelectric properties of ALD grown Hf1-xZrxO2 films - IOPscience
←
→
Page content transcription
If your browser does not render page correctly, please read the page content below
Journal of Physics D: Applied Physics

PAPER • OPEN ACCESS

Influence of oxygen source on the ferroelectric properties of ALD grown
Hf1-xZrxO2 films
To cite this article: Ruben Alcala et al 2021 J. Phys. D: Appl. Phys. 54 035102

View the article online for updates and enhancements.

                                This content was downloaded from IP address 46.4.80.155 on 04/01/2021 at 10:27
Journal of Physics D: Applied Physics
J. Phys. D: Appl. Phys. 54 (2021) 035102 (12pp) https://doi.org/10.1088/1361-6463/abbc98
Influence of oxygen source on the
ferroelectric properties of ALD grown
Hf1-xZrxO2 films
Ruben Alcala1,4, Claudia Richter1, Monica Materano1, Patrick D Lomenzo1,
Chuanzhen Zhou2, Jacob L Jones3, Thomas Mikolajick1,4 and Uwe Schroeder1
1
NaMLab gGmbH, Noethnitzer Strasse 64 a, 01187, Dresden, Germany
2
Analytical Instrumentation Facility, North Carolina State University, Raleigh, NC,
United States of America
3
Department of Materials Science and Engineering, North Carolina State University, Raleigh, NC,
United States of America
4
Chair of Nanoelectronics, TU Dresden, Noethnitzer Strasse 64, 01187, Dresden, Germany
E-mail: ruben.alcala@namlab.com
Received 22 July 2020, revised 16 September 2020
Accepted for publication 29 September 2020
Published 22 October 2020
Abstract
Hafnium oxide (HfO2 ), zirconium oxide (ZrO2 ), and the solid-solution (Hf1-x Zrx O2 ) system
continue to be some of the most relevant ferroelectric materials, in particular, for their
promising application in CMOS integrated ferroelectric memories. Recent understanding of the
influence of oxygen supplied during film deposition on the structural phase formation process in
Hf1-x Zrx O2 films has drawn attention to a commonly overlooked parameter for tuning
ferroelectric and electrical properties of these films. In this paper, a comparison of O3 and O2
plasma used as the oxygen source in an atomic layer deposition process for Hf1-x Zrx O2 films
within the full compositional range is discussed. A combination of structural and electrical
characterization methods grant insight on the influence of each of the oxygen sources on the
crystalline phase formation during deposition of Hf1-x Zrx O2 films. These observations are then
correlated to the material’s behavior regarding its ferroelectric and electrical properties; mainly,
dielectric constant, ferroelectric remanent polarization, and number of electric field cycles to
breakdown.
Keywords: ALD, PEALD, hafnium oxide, zirconium oxide, ferroelectric, ozone, oxygen plasma
(Some figures may appear in colour only in the online journal)
1. Introduction on the order of nanometers [1]. Almost simultaneously,
ferroelectric behavior in Hf0.5 Zr0.5 O2 thin films was also
In 2011, Böscke et al discussed a ferroelectric crystalline discussed [2]. These findings came at a time when traditional
phase stabilization in doped HfO2 films with thicknesses ferroelectrics, such as PZT and SBT, were struggling with
scalability and Si compatibility issues [3]. In addition, the
integration of HfO2 and ZrO2 as high-k dielectrics into micro-
electronic devices had already been adopted for dynamic ran-
dom access memory and high-k gate dielectrics in metal oxide
semiconductor transistors [4, 5]. Since then, HfO2 -ZrO2 based
Original content from this work may be used under the terms
of the Creative Commons Attribution 4.0 licence. Any fur-
oxides have gained widespread interest as ferroelectric mater-
ther distribution of this work must maintain attribution to the author(s) and the ials; particularly for their application in novel ferroelectric
title of the work, journal citation and DOI. memory technologies [6].
1361-6463/21/035102+12$33.00 1 © 2020 The Author(s). Published by IOP Publishing Ltd Printed in the UK
J. Phys. D: Appl. Phys. 54 (2021) 035102                                                                                      R Alcala et al

    Under ambient conditions, both pure hafnia (HfO2 ) and              and was applied at a volume flow rate of 700 sccm with a
pure zirconia (ZrO2 ) crystallize into a monoclinic structure           150 g m−3 density. O2 plasma was generated via an induct-
(m-phase) with space group P21 /c when bulk materials are               ively coupled plasma source at 300 W and a 20 sccm O2
considered [7, 8]. Nevertheless, it has been long known that            gas flow rate. Key deposition parameters of the ALD process
additional high-temperature phases of these fluorite-structured         which were varied during this work were deposition temperat-
oxides, that is, a tetragonal (t-) P42 /nmc and cubic (c-) Fm3̄m        ure and oxidation exposure time. In addition, film composition
phase, can be stabilized at room temperature in the form of             was varied by modifying the Hf to Zr precursor cycle relation,
thin films or nanocrystallites. This comes as a result of a sig-        defined here as Zr/(Zr + Hf), for a specific number of ALD
nificant difference in the surface to bulk free energy relation         cycles, referred to as a supercycle.
for grain sizes in the nanoscale and due to dopant distribu-                In order to evaluate electrical properties, TiN\
tion across grain boundaries [9–13]. In a similar fashion, the          Hf1-x Zrx O2 \TiN\Ti\Pt structured metal-insulator-metal
orthorhombic (o-) Pca21 phase, responsible for the ferroelec-           (MIM)-capacitors were fabricated on (100) oriented p-Si
tric behavior in HfO2 –ZrO2 oxides, is also expected to be              substrates. 10 nm TiN layers were used as bottom and top
influenced by size and surface related effects. The origin of           electrodes and were deposited via sputtering in a Bestec
this ferroelectric phase has been extensively discussed in liter-       ultrahigh vacuum sputter cluster at room temperature using a
ature [14–16].                                                          Ti target and N2 plasma. 10 nm thick Hf1-x Zrx O2 layers were
    Nanometer-scale thin films of simple Hf1-x Zrx O2 (x = 0–1)         deposited via the aforementioned ALD method. A 20 s post-
oxide compositions have already been reported to present fer-           metallization anneal (PMA) at 450 ◦ C in a N2 atmosphere
roelectric behavior [17, 18]. Even so, additional doping of the         was employed to achieve a crystallization of the Hf1-x Zrx O2
oxide films, in an attempt to understand the ferroelectric beha-        dielectric layer. Additionally, a 10 nm thick Ti layer and a
vior and improve the reliability of the material, has also been         25 nm thick Pt layer were deposited via electron beam evap-
widely researched [19–21]. At the same time, factors such as            oration through a shadow mask as an adhesion and contact
the influence of the substrate [22, 23], the choice of electrode        layer, respectively. In a final fabrication step, excess TiN was
material [24, 25], and the annealing treatment [26, 27] have            etched with a SC-1 procedure at 50 ◦ C for 5 min in a solution
all been identified to influence the ferroelectric behavior of          of H2 O, H2 O2 , and NH3 at a 50:2:1 ratio, in order to isolate
Hf1-x Zrx O2 oxide films. Recently, the impact of oxygen and            the contact pads.
nitrogen vacancies on the phase formation process has been                  Structural characterization of the deposited films was per-
reported [28].                                                          formed with a Bruker D8 Discover XRD Tool using a Cu Kα
    Different techniques for ferroelectric Hf1-x Zrx O2 film            source with λ = 0.154 nm. X-ray reflectometry was utilized for
depositions have been studied, such as atomic layer depos-              film thickness determination; from which the growth per cycle
ition (ALD), sputter deposition (PVD) [29] chemical solution            (GPC) could also be extracted. Grazing incidence x-ray dif-
deposition [30], pulsed laser deposition [31], and molecular            fraction (GIXRD) and further diffraction peak analysis were
beam epitaxy [32]. That said, ALD remains the most robust               used for crystalline phase identification and content determ-
and well established method for the deposition of very thin             ination. Furthermore, time-of-flight secondary ion mass spec-
oxide films, especially for CMOS processes, with a clear                trometry (TOF-SIMS) analyses were performed using a TOF
advantage in deposition conformality on three dimensional               SIMS V (ION TOF, Inc.) tool.
structures [33]. Multiple reports comparing different metal-                Electrical characterization was used to determine proper-
precursor combinations for Hf1-x Zrx O2 film deposition have            ties such as remanent polarization (Pr ), electric field cycles to
been published [34–36]. In contrast, a comparison of oxy-               breakdown and dielectric constant (k) of the material, and was
gen sources for the same deposition process is rather uncom-            performed using an aixACCT TF Analyzer 3000. Dynamic
mon [37, 38]. To better understand the role of the ALD oxy-             hysteresis measurements (DHM) were preformed using a 4 V
gen sources and its link to the recently reported vacancy               triangular pulse signal at 1 kHz with additional field cycling
dependency on phase formation in Hf1-x Zrx O2 films, this work          performed at 100 kHz. The dielectric constant was extracted
focuses on analyzing the effects of O3 and O2 plasma during             from the small-signal capacitance of CV-measurements.
ALD growth and their influence on the ferroelectric properties
of Hf1-x Zrx O2 thin films.
                                                                        3. Results and discussion

                                                                        3.1. Mixed Hf0.5 Zr0.5 O2 films
2. Experimental
                                                                        Based on previous work on the optimization of the ALD pro-
Hf1-x Zrx O2 thin-films were deposited on (100) oriented p-Si           cess for ferroelectric Hf1-x Zrx O2 films [34, 37], a fixed metal-
wafer substrates via ALD in an Oxford OpAL tool. All films              organic precursor pulse length and oxidation pulse length
had a target thickness of 10 nm. Cyclopentadienyl-amine-                were evaluated under distinct deposition temperatures for
based Cp -Hf[N(CH3 )2 ]3 and Cp -Zr[N(CH3 )2 ]3 were used as            Hf0.5 Zr0.5 O2 films deposited using either O3 or O2 plasma as
metal-organic precursors and were bubbled with Ar gas at                an oxygen source. As depicted in figure 1, the GPC, derived
65 ◦ C and 70 ◦ C, respectively, to assist precursor delivery.          from the complete film thickness and the number of ALD
Either O3 gas or O2 plasma was employed as the oxidizing                cycles, maintained a mean value of around 0.81 Å/cycle in the
agent. O3 gas was obtained from a Sorbios ozone generator               case of O3 and 0.92 Å/cycle in the case of O2 plasma, with

                                                                    2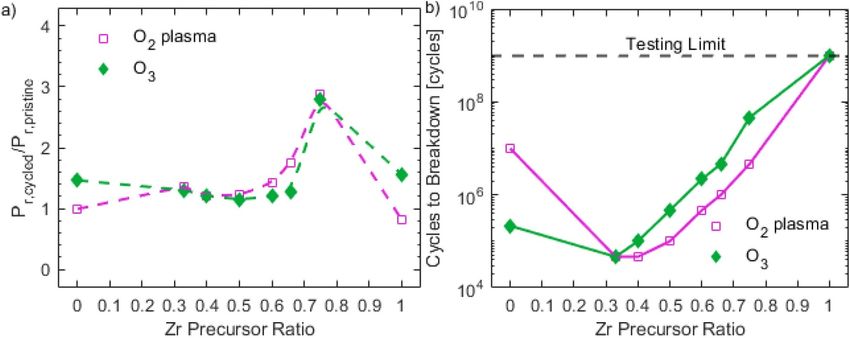
J. Phys. D: Appl. Phys. 54 (2021) 035102                                                                                                        R Alcala et al

                                                                                          initial layer growth on the TiN substrate. Despite the impur-
               0.94
                                                                             +            ity presence, both oxygen sources presented a consistent GPC
                                                                                 p
               0.92                                                                       in the evaluated deposition temperature interval, suggesting a
                                                                             GPC          minimal interference with the growth process. The influence
                                                                             -   p
               0.90                                                              p
                                                                                          of impurities on ferroelectric performance shall be discussed
GPC[Å/cycle]

               0.88                                                                       later.
                                                        O plasma                              GIXRD analysis of the as-deposited Hf0.5 Zr0.5 O2 films
                                                            2
               0.86
                                                        O
                                                            3
                                                                                          shows that these films are amorphous with only some nano-
               0.84                                                                       crystallite formation in the order of 1 to 5 nm grain size, as
                                                                             +
                                                                                 O3       estimated by the Debye-Scherrer formula implemented on the
               0.82
                                                                             GPC O3       weak diffraction peaks at the expected 2Θ values of 28.5◦ ,
               0.80                                                          -   O3
                                                                                          30.4◦ , 30.8◦ , and 31.6◦ of the m(−111), o(111), t(011), and
                                                                                          m(111) planes, respectively (figure 2) [45]. The slight increase
               0.78
                                                                                          in grain size was directly related to the deposition temperature.
                      250      270    290       310       330          350                An exception to this subtle behavior was the Hf0.5 Zr0.5 O2 film
                              Deposition Temperature [°C]                                 deposited at 350 ◦ C with O3 as an oxygen source for which a
                                                                                          considerably larger increase in grain size to around 8–10 nm
Figure 1. Average GPC of Hf0.5 Zr0.5 O2 films with respect to                             was observed.
different deposition temperatures. GPC was determined from final                              Further peak analysis and peak deconvolution identified
film thickness divided by number of cycles. All films had a
thickness of around 10 nm.                                                                a trend of higher monoclinic phase (m-phase) fraction for
                                                                                          increasing deposition temperatures (figure 3). Partial in-situ
Table 1. TOF-SIMS derived impurity comparison for Hf0.5 Zr0.5 O2                          crystallization during the ALD process is anticipated, espe-
films deposited at 300 ◦ C using different oxygen sources. C-                             cially for higher deposition temperatures. Nevertheless, a
concentration for the bottom electrode (BE) interface is excluded                         divergence between oxygen source trends for the m-phase
due to interest in carbon contribution only from the deposition                           fraction at 350 ◦ C can be identified. This observation leads to
process. For the OH- and TiO- ions, the values presented are relative
to HfO2 - + ZrO2 -.                                                                       the assumption of a higher oxygen presence in the Hf0.5 Zr0.5 O2
                                                                                          films deposited using O3 as an oxygen source since such cor-
                                 Impurity concentration                                   relation has been reported for nanoscale Hf0.5 Zr0.5 O2 films
                                            In bulk              At BE interface          [28, 46]. Because the values presented in figure 3 are extrac-
Impurity               Unit          O3     O2 plasma           O3      O2 plasma
                                                                                          ted from the GIXRD patterns, and therefore only represent
                                                                                          phase fraction percentage relative to the crystallized portion
C-                     1020 cm−3     1.5 6.1                    -       -                 of the film, the m-phase fraction difference between O3 and
OH-                    a. u.         0.02 0.02                  0.35    0.02              O2 plasma at 350 ◦ C, with the additional consideration of the
TiO-                   a. u.         0.00 0.00                  0.42    0.22              amorphous fraction of the film, is expected to be larger due to
                                                                                          the difference in crystallization identified in figure 2. Further
                                                                                          diffraction peak deconvolution of the t/o-phase is known to be
a ± 0.015 Å/cycle one-sigma interval for both oxygen sources,                             difficult and was not undertaken in this work.
extracted from the GPC values at different deposition temper-                                 GIXRD analysis of post-metallization annealed MIM-
atures. An increased GPC is commonly reported for O2 plasma                               capacitor stacks with Hf0.5 Zr0.5 O2 layers deposited at different
use as a result of its reaction mechanism along with possible                             ALD temperatures was also performed. Additional determin-
emergent background chamber variations [39–42].                                           ation of the orthorhombic (o-) and tetragonal (t-) phase con-
    Considering the organic nature of the metal-organic pre-                              tent, in addition to the m-phase, was now possible due to an
cursors used, carbon-ligand derived impurities are expected                               increase in diffraction peak intensities and average crystalline
to be found in the film [34]. Additionally, specific oxygen                               grain size. Nevertheless, due to the overlapping nature of the
group contamination has been reported for each of the oxy-                                main reference diffraction peaks of these phases, that is, (111)o
gen sources [39, 43, 44]. As a result, interference in the                                at 2Θ equal to 30.4◦ and (011)t at 2Θ equal to 30.8◦ , a com-
growth process of the film is expected, especially for lower                              bined phase fraction value was preferred.
deposition temperatures which are prone to higher impurity                                    As shown in figure 4, the overall phase composition of
concentrations. TOF-SIMS was used to determine impurity                                   the Hf0.5 Zr0.5 O2 layer when using O2 plasma as an oxygen
concentrations resulting from the use of each of the oxygen                               source presented little relation with respect to deposition tem-
sources for Hf0.5 Zr0.5 O2 films deposited at 300 ◦ C. Concen-                            perature, showing only a slight increase in m-phase for higher
tration of impurities for two regions of the film, a bulk or                              deposition temperatures. In contrast, for O3 , at 250 ◦ C the
mid-film region and at the interface with the bottom electrode                            Hf0.5 Zr0.5 O2 layer remained mostly amorphous even after the
(BE), are presented in table 1. O2 plasma presented higher                                PMA treatment and, for increasing deposition temperatures, a
carbon related impurities with a concentration of around                                  larger amount of a monoclinic phase was observed. This trend
6.1 × 1020 cm−3 . For O3 , the corresponding concentration                                fits well with previous observations in figure 3 for O3 and illus-
was around 1.5 × 1020 cm−3 . O3 based films also show a                                   trates how the as-deposited stabilized monoclinic phase limits
higher OH- content at the interface to the BE as an effect of the                         o- and t-phase formation.

                                                                                      3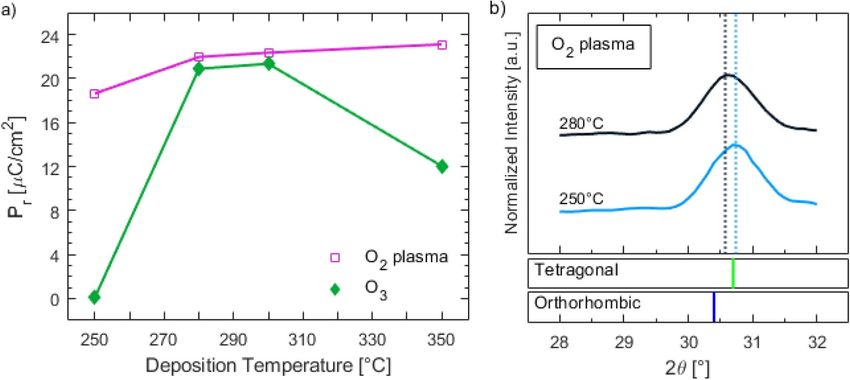
J. Phys. D: Appl. Phys. 54 (2021) 035102                                                                                                    R Alcala et al

Figure 2. GIXRD patterns of as-deposited Hf0.5 Zr0.5 O2 films obtained at different deposition temperatures using (a) O3 and (b) O2 plasma
as the oxygen source. Diffraction patterns for pure phase powder samples are included at the bottom of each plot.

                    50                                                                           100
                                                                                                  90
                                                                                                  80
                                                                             Phase Fraction [%
Phase Fraction [%

                                                                                             ]
                ]

                                                                                                  70          o + t-phase (O 2 pl.)
                                                                                                  60
                                                                                                              o + t-phase (O 3)
                    25                                                                            50          m-phase (O 2 pl.)
                                                                                                  40
                                                                                                              m-phase (O 3)
                                                                                                  30
                                                                                                  20
                                                 m-phase (O 2 pl.)
                                                                                                  10
                                                 m-phase (O 3)                                     0
                    0
                                                                                                       250     275            300     325         350
                         250     275       300       325         350
                                                                                                             Deposition Temperature [°C]
                               Deposition Temperature [°C]
                                                                            Figure 4. Phase fraction of annealed Hf0.5 Zr0.5 O2 films, when using
Figure 3. Monoclinic phase (m-phase) fraction of as-deposited               O3 or O2 plasma as an oxygen source, as a function of deposition
Hf0.5 Zr0.5 O2 films when using O3 or O2 plasma as an oxygen                temperature.
source, deposited at distinct temperatures. Phase fraction
percentages are with respect to the crystallized portion of the film;
the amorphous portion is not considered.
                                                                            is reached at 280 ◦ C and no relevant improvement is obtained
                                                                            for higher deposition temperatures. Considering that no clear
   On the same structures, a DHM was used to assess reman-                  change in m-phase composition was identified for O2 plasma
ent polarization values (Pr ) at a pristine state (figure 5(a)). For        with respect to deposition temperature in figure 4, it is pre-
O2 plasma, a lower Pr value was only identified when using a                sumed that a larger t-phase stabilization, visible as a peak shift
250 ◦ C deposition temperature. A Pr of around 22.5 µC cm−2                 in GIXRD patterns depicted in figure 5(b), is responsible for

                                                                        4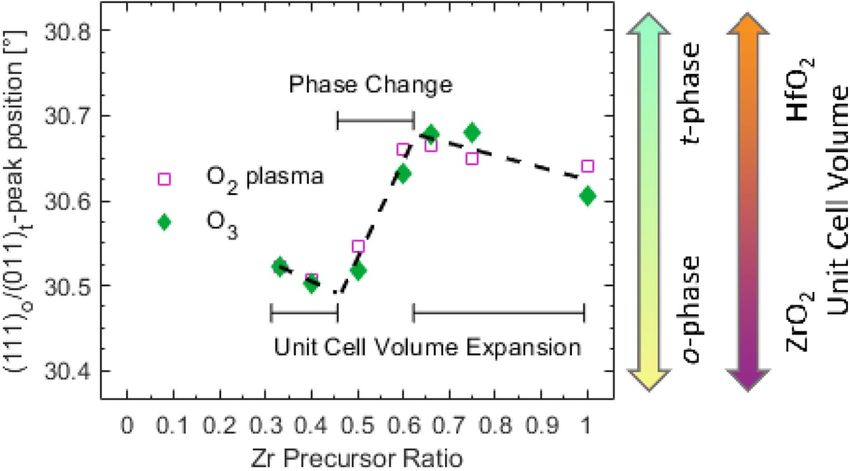
J. Phys. D: Appl. Phys. 54 (2021) 035102                                                                                              R Alcala et al

                                                                             Figure 6. Phase fraction percentage of O3 -based Hf0.5 Zr0.5 O2 films
Figure 5. (a) Pr values of annealed Hf0.5 Zr0.5 O2 films, when using
                                                                             after annealing as a function of the oxidation exposure length used
O3 and O2 plasma as an oxygen source, as a function of deposition
                                                                             during deposition.
temperature. A 4 V triangular signal at 1 kHz was applied for the
hysteresis measurement. (b) A Diffraction peak shift between two
Hf0.5 Zr0.5 O2 films deposited at 250 ◦ C and 280◦ using O2 plasma.
A different t-phase fraction for the different deposition temperatures       process. Regarding O2 plasma, no effect of reduced crystalliz-
is observed.
                                                                             ation in the Hf0.5 Zr0.5 O2 films was observed at any of the eval-
                                                                             uated oxidation exposure lengths. Longer oxidation exposure
the reduced Pr at 250 ◦ C. Regarding O3 , the increasing m-                  lengths led to increased m-phase fraction, regardless of the
phase trend identified in figure 4 is coherent with the decreas-             oxygen source (see figures 6 and 7(a)). This is due to the direct
ing Pr trend in figure 5(a). In addition, the amorphous case at              relation between oxidation exposure length and oxygen con-
250 ◦ C correspondingly lacked any ferroelectric behavior.                   tent in the Hf0.5 Zr0.5 O2 layer [47].
    From this analysis, it was determined that the deposition                   As depicted in figure 7(a), o + t-phase fraction appears to
temperature has little effect on the crystalline phase content               remain constant between the 3 s and 5 s oxidation exposure
and therefore little effect on the Pr of the Hf0.5 Zr0.5 O2 layer            lengths when using O2 plasma as an oxygen source. Never-
when using O2 plasma as an oxygen source. In contrast, when                  theless, a closer analysis of the combined (111)o /(011)t dif-
using O3 as an oxygen source, crystallization was limited at                 fraction peak (figure 7(b)) clearly identifies a right-shift in the
250 ◦ C and an underlying trend of increasing m-phase content                peak position for the 3 s exposure length with respect to the 5 s
was identified for increasing deposition temperatures. Both                  exposure length. This qualitatively confirms a larger t-phase
phenomena have a clear detrimental effect on the ferroelec-                  fraction in the Hf0.5 Zr0.5 O2 layer when using the shorter expos-
tric properties of the film. Regardless, at the 280 ◦ C–300◦ C               ure length. As a result, the O2 plasma exposure length series
deposition temperature range, similar stabilization of the polar             exhibits a transition from a film with high t-phase stabiliza-
o-phase is expected, independent of the oxygen source, due                   tion at 3 s, through a film with mostly o-phase stabilization
to similar Pr values and o + t diffraction peaks observed in                 at 5 s, up to films with increasing m-phase content for longer
GIXRD.                                                                       exposure lengths. This coincides with the previously reported
    The influence of the oxidation exposure length during the                phase development dependence on the oxygen content in the
ALD process on the ferroelectric properties of Hf0.5 Zr0.5 O2                Hf0.5 Zr0.5 O2 film [28].
films was also studied for both O3 and O2 plasma. First,                        DHM were also performed on these structures to assess
PMA treated MIM-capacitor stacks with a 10 nm Hf0.5 Zr0.5 O2                 remanent polarization (Pr ) in the pristine state (figure 8). For
dielectric layer deposited at 300 ◦ C and varying oxidation                  both oxygen sources, the Pr values fit well with the trends
exposure lengths were characterized using GIXRD. Once                        observed in the structural analysis: for O3 , the mostly amorph-
more, diffraction peak deconvolution and intensity compar-                   ous Hf0.5 Zr0.5 O2 layer obtained from a 5 s oxidation exposure
ison were used to determine the phase fraction distribution in               length deposition showed no remanent polarization (Pr ) and
the Hf0.5 Zr0.5 O2 layer. For O3 , an oxidation exposure length              the Hf0.5 Zr0.5 O2 layer with reduced crystalline phase devel-
of 10 s presented a weak diffraction peak pattern indicating                 opment at 10 s presented only a small Pr . With regard to the
limited crystalline phase development and a shorter 5 s time                 rest of the exposure lengths, a maximum Pr is reached at a
interval lacked any relevant crystalline phase development.                  20 s exposure length after which only equal or smaller Pr val-
In effect, both pulse lengths are excluded from figure 6. The                ues are obtained due to increasing m-phase fraction or, rather,
underlying reason behind these deficiencies for O3 is expec-                 a decrease in o-phase content (see figure 6). Similarly for O2
ted to be insufficient exposure time to achieve a full reaction              plasma, a peak Pr value is reached at 5 s after which a decreas-
with the substrate surface during the half-cycle of the ALD                  ing trend is observed, also in accordance with the increasing

                                                                         5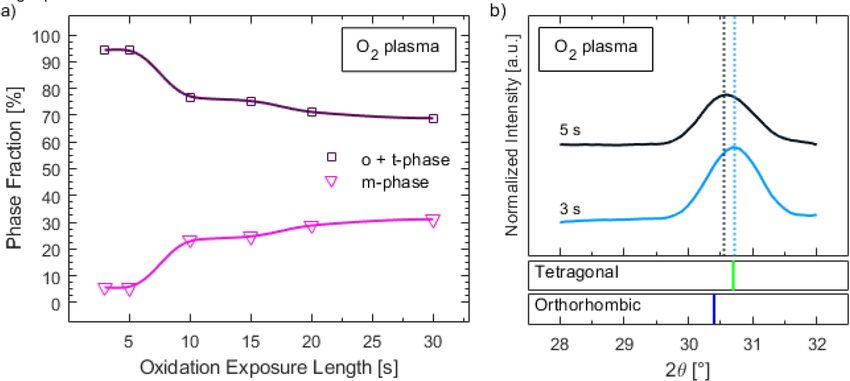
J. Phys. D: Appl. Phys. 54 (2021) 035102                                                                                           R Alcala et al

Figure 7. (a) Phase fraction percentage of O2 -plasma-based Hf0.5 Zr0.5 O2 films after annealing as a function of the oxidation exposure length
used during deposition. (b) GIXRD patterns of two Hf0.5 Zr0.5 O2 films after annealing, deposited using O2 plasma exposure lengths of 3 and
5 s. A shift in the main diffraction peak is observed, likely indicating a variation in o- and t-phase fraction between the two films.

                                                                              Despite having similar combustion-like ALD reaction
                 24   o/   o                          /m                  mechanisms [39, 43, 44], O2 plasma presented only a minor
                                                                          relation to the deposition temperature and oxidation exposure
                 21
                                                                          length in comparison to O3 . This suggests that the reaction
                 18                                                       mechanism when using O2 plasma is dependent on the plasma
P r [ C/cm 2 ]

                 15                                                       conditions. In contrast, film deposition can be controlled
                                                                          through the aforementioned parameters if O3 is employed. In
                 12        a   o/          o                     /m
                                                                          addition, O2 plasma presents faster reactivity than O3 in view
                 9                                                        of the fractional oxidation exposure length required to achieve
                                                                          a full surface reaction with the substrate.
                 6
                                                      O 2 plasma
                 3
                                                      O3                  3.2. Hf1-x Zrx O2 films with various compositions
                 0
                                                                          As reported previously, the ideal oxide composition for ferro-
                      0    5   10   15     20   25   30    35   40        electric MIM-capacitors, corresponding to a high o-phase frac-
                           Oxidation Exposure Length [s]                  tion in the Hf1-x Zrx O2 dielectric layer, appears to be around
                                                                          identical Hf and Zr content (Hf0.5 Zr0.5 O2 ) for ALD deposited
Figure 8. Pr values of annealed Hf0.5 Zr0.5 O2 films, when using O3       layers of around 10 nm thickness, characterized by the highest
and O2 plasma as an oxygen source, as a function of the oxidation         obtainable Pr around this oxide composition [16, 34, 48]. A
exposure length during deposition. A 4 V triangular signal at 1 kHz       decrease in Pr is commonly observed when deviating from
was applied for the measurement. Predominant phase formation
trends are indicated in the figure, where ‘a’ refers to amorphous.        this composition, with increasing Hf or Zr content; although
                                                                          it is not always the case [49]. Increasing Hf content leads
                                                                          to a monotonic decrease in Pr until a paraelectric behaved
m-phase fraction (see figure 7(a)). The Pr value for the 3 s              monoclinic HfO2 layer is reached. In the opposite direction,
oxidation exposure length also decreases with respect to the              an increase in Zr content produces a strong pinching effect in
5 s case due to an increase in non-polar t-phase content in the           the hysteresis loop around the 0 MV cm−1 electric field region,
Hf0.5 Zr0.5 O2 layer, discussed previously (see figure 7(b)).             leading to an anti-ferroelectric-like behavior. This effect con-
    Oxidation exposure length plays a significant role in                 sistently increases as a pure ZrO2 composition with a high t-
determining the structural and electrical properties of the               phase fraction is approached (see figure 9) [14]. In this section,
evaluated Hf0.5 Zr0.5 O2 layers, that is, the exposure length             the influence of the oxygen source of the ALD process on the
presents a direct relation with the oxygen content of the                 behavior of Hf1-x Zrx O2 films is examined.
Hf0.5 Zr0.5 O2 film [47]; consequently influencing the crys-                  Based on the previous ALD process optimization discussed
talline phase development. Furthermore, insufficiently short              above, Hf1-x Zrx O2 layers in the complete HfO2 to ZrO2 com-
exposure lengths will limit crystalline phase development as              position range with a thickness of 10 nm were deposited at
a result of incomplete reactions during the ALD process in the            300 ◦ C within a MIM-capacitor structure and given a PMA
form of inefficient ligand removal.                                       treatment at 450 ◦ C for 20 s. The oxidation exposure lengths

                                                                      6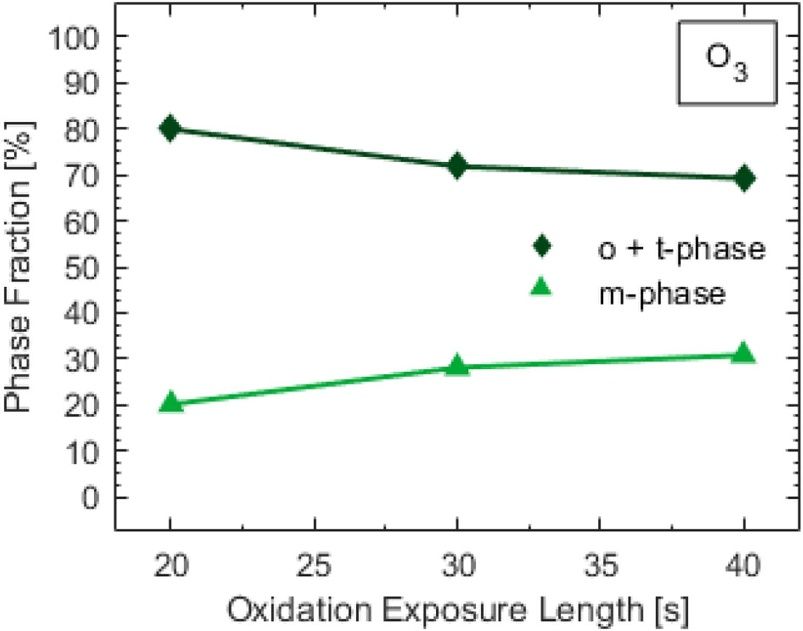
J. Phys. D: Appl. Phys. 54 (2021) 035102                                                                                           R Alcala et al

                       30     0.0           0.33                0.5                    0.75                 1.0
          P [ C/cm ]
         2

                       15

                                                                                                                                Ozone
                        0
                       -15
                                    HfO 2                                                                         ZrO2
                       -30
                       30

                                                                                                                               O2 plasma
          P [ C/cm ]
         2

                       15
                        0
                       -15
                       -30
                             -4 -2 0 2 4 -4 -2 0 2 4 -4 -2 0 2 4 -4 -2 0 2 4 -4 -2 0 2 4
                                                   Electric Field [MV/cm]
Figure 9. Polarization-electric field hysteresis curves of annealed Hf1-x Zrx O2 films, when using O3 and O2 plasma as an oxygen source, at
specific Zr/(Zr + Hf) ratios identified for each column. All samples were previously cycled with a 4 V triangular signal at 100 kHz.

when employing O3 or O2 plasma as the oxygen source in the                    0.6 suggests a meaningful change in t-phase fraction in
ALD process were 20 s and 5 s, respectively. To achieve a spe-            the dielectric film. For all other cases, the unit cell volume
cific oxide composition, a supercycle formatted ALD process               expansion seemingly has a larger influence on the detected
was used, in which the metal-organic precursors was alternat-             (111)o /(011)t peak-shift since a negative trend, or rather a left-
ingly used for a defined fraction of cycles. To avoid a nano-             shift, is maintained for increasing Zr precursor ratios. Despite
laminate structure formation [34, 50, 51], a maximum of three             this simple model, additional factors such as strain/stress in the
continuous ALD cycles of a single metal organic precursor                 film are also expected to impact the 2Θ peak position [28]; one
during any deposition process was used. Due to oxide com-                 of the clearest external influences being the choice of the elec-
position discrepancies as a result of the ALD growth process,             trode material. For this work, TiN was chosen due to its known
rather than using the expected Zr content in the Hf1-x Zrx O2             mechanical constraint that allows for higher non-monoclinic
layer, the ratio of the Zr metal-organic precursor to the total           phase stabilization [53]. Nevertheless, other materials have
number of cycles in the supercycle, defined as Zr/(Zr + Hf)               shown a similar behavior [54–56].
and refered to as the ‘Zr precursor ratio’, was the preferred                 For the electrical characterization of the fabricated struc-
reference value.                                                          tures, first, remanent polarization (Pr ) at a pristine state was
    GIXRD diffraction patterns of the obtained annealed struc-            evaluated (figure 12). The obtained Pr trends were similar
tures are presented in figure 10. Starting with the pure HfO2             among oxygen sources. Nevertheless, using O3 as an oxygen
case (0.0 Zr precursor ratio), the dielectric layer presents pre-         source favored a slightly higher Pr in this case. As expected,
dominantly monoclinic phase crystallization in the case of                the highest Pr values were obtained around identical Hf and
O3 and remains mostly amorphous when using O2 plasma.                     Zr content. Increasing Hf had a stronger effect in reducing
For increasing Zr precursor ratios, the reference peak for the            Pr than increasing Zr and only pure HfO2 was paraelectric.
(111)o /(011)t planes at a 2Θ value of about 30.6◦ becomes the            This implies that, despite the (111)o /(011)t peak position shift
sole discernable diffraction peak.                                        toward higher t-phase percentage depicted in figure 11, the o-
    Hf4+ and Zr4+ ions have different ionic radii. Therefore,             phase is presumed to remain present even at high Zr contents.
a unit cell volume expansion is expected when transitioning               Additionally, the phase change spike in figure 11 does not
from pure HfO2 to ZrO2 [52]. This may be observed as a left-              coincide with the Pr drop in figure 12. Therefore, it is expected
shift in the diffraction peaks when comparing GIXRD patterns              that an increase in t-phase fraction in the Hfx Zr1-x O2 films, at
of films with increasing Zr content. Simultaneously, a right-             a Zr precursor ratio from 0.5 to 0.6, is the main reason behind
shift in the overlapping (111)o /(011)t reference peak at the 2Θ          the phase change spike of figure 11 but, only until the Zr pre-
value of about 30.6◦ when increasing Zr content is expected               cursor ratio interval of 0.6 to 0.75, does the o-phase fraction
due to an increase in t-phase stabilization [15]. This leads to an        considerably drop.
irregular (111)o /(011)t peak shifting. As depicted in figure 11,             Even though similar downtrends in Pr can be identified
the observed (111)o /(011)t peak shifting resulted independent            in figure 12 for increasing or decreasing Zr content beyond
of the oxygen source. The strong right-shift in the observed              the 0.5 Zr precursor ratio, this observation does not entirely
peak position at the transition in Zr precursor ratio from 0.5 to         reflect the hysteresis behavior of the films. As depicted in

                                                                      7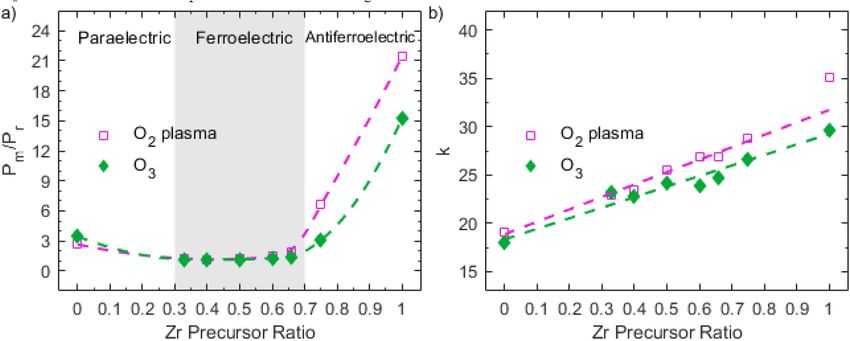
J. Phys. D: Appl. Phys. 54 (2021) 035102                                                                                        R Alcala et al

Figure 10. GIXRD patterns of annealed Hf1-x Zrx O2 films deposited under various Zr precursor ratios and using (a) O3 and (b) O2 plasma as
oxygen sources. A shift in the main diffraction peak is observed for increasing Zr presence. Diffraction patterns for pure-phase powder
samples are located at the bottom of each plot.

Figure 11. (111)o /(011)t diffraction peak position, obtained from GIXRD patterns of annealed Hf1-x Zrx O2 films deposited using either O3
or O2 plasma as an oxygen source, plotted against the Zr precursor ratio used during the deposition process. An expected predominant
peak-shifting phenomenon is identified in the figure. Linear trend-lines are introduced only as a visual aid.

                                                                     8
J. Phys. D: Appl. Phys. 54 (2021) 035102 R Alcala et al
of a developing pinching effect. Depolarization fields result-
22 ing from the co-existence of polar and non-polar regions of
O 2 plasma
20 a mixed o/t-phase dielectric layer, as well as parasitic dead
18 O3 layers present in the film stack, are expected to be the main
16 reasons behind the anti-ferroelectric-like behavior of the film
P r [ C/cm 2 ]
14 as discussed by Lomenzo et al [58].
12 Despite certain discrepancies among reported values for the
10 dielectric constant (k) of the m-, o- and t-phases for HfO2 and
8 ZrO2 [59], experimental results of Hf1-x Zrx O2 thin films indic-
6 ate that the t-phase presents the highest dielectric constant, fol-
4 lowed by the o-phase, and lastly the m-phase with approxim-
2 ate values of 40, 25, and 20, respectively [17]. As depicted
in figure 14(b), a clear trend of increasing dielectric constant
0
for increasing Zr precursor ratio was identified for both oxy-
0 0.1 0.2 0.3 0.4 0.5 0.6 0.7 0.8 0.9 1 gen sources. The observed trend fits well with the observed
Zr Precursor Ratio paraelectric behavior of monoclinic HfO2 and the increase in
t-phase stabilization for higher Zr content. Nevertheless, at a
Figure 12. Pristine Pr values of annealed Hf1-x Zrx O2 films when Zr precursor ratio of 1.0, the lower than expected k if only pure
using either O3 or O2 plasma as an oxygen source as a function of tetragonal phase ZrO2 were present, as well as the non-zero
the Zr precursor ratio. A 4 V triangular signal at 1 kHz was applied Pm /Pr relation in figure 14(a), is suggestive of the coexistence
for the Pr measurement.
of the o-phase in the dielectric film. In fact, it is suggested by
Lomenzo et al [60] that around 30% of the dielectric film could
35 still present a switchable orthorhombic phase. Additional t-
HfO2 phase stabilization doping, such as with Y, may be necessary
28
Hf 0.5 Zr 0.5 O 2 to achieve pure tetragonal/cubic phase ZrO2 with no switch-
C/cm 2 ]
21 ZrO 2 able polar phases [28].
14 Pr Continuous electric field cycling is known to have an effect
7 on the ferroelectric hysteresis loop of Hf1-x Zrx O2 films in what
Pm
is referred to as its electric field cycling behavior [61]. Partic-
Polarization[
0
ularly, a reduction in internal bias fields can be achieved after
-7
a certain number of field cycles. This ‘wake-up’ behavior is
-14 characterized by an increase in Pr and a reduction or possibly
-21 elimination of the pinching effect in the hysteresis loop [61].
-28 In figure 15(a), the ratio between the remanent polarization of
a Hf1-x Zrx O2 film in a pristine state and after 104 cycles with
-35
a 4 V amplitude signal is used as a figure of merit to compare
-4 -3 -2 -1 0 1 2 3 4 the wake-up behavior of the Hf1-x Zrx O2 films with varying Zr
Electric Field [MV/cm
] content. An increasing wake-up behavior was observed as a
Zr precursor ratio of 0.75 was approached from a lower Zr
Figure 13. Comparison of polarization-electric field hysteresis content. Considering the small Pr (figure 12) and increasing k
curves for annealed dielectric HfO2 , ferroelectric Hf0.5 Zr0.5 O2 and (figure 14(b)) for this precursor ratio, an increase in t-phase in
antiferroelectric ZrO2 films. Extracted values of remanent
the film is expected. From this, the influence of t-phase pres-
polarization (Pr ) and the maximum attained polarization without the
linear dielectric contribution (Pm )[57] values are marked. ence on the wake-up behavior is evident. When comparing
oxygen sources, the lower oxygen content that was discussed
in the first section for O2 plasma use appears to slightly dis-
figure 13, both ferroelectric behaved Hf0.5 Zr0.5 O2 and antifer- place the observed trend toward lower Zr content since a lar-
roelectric behaved ZrO2 films present a relevant non-linear ger wake-up behavior is observed at lower Zr ratios and no
polarization contribution under the maximun evaluated elec- wake-up effect is present at a pure ZrO2 composition. This is
tric field denominated Pm [57]. By plotting Pm /Pr against the expected to be directly related to higher t-phase stabilization
Zr precursor ratio additional insight on the hysteresis loop in comparison to its O3 counterpart.
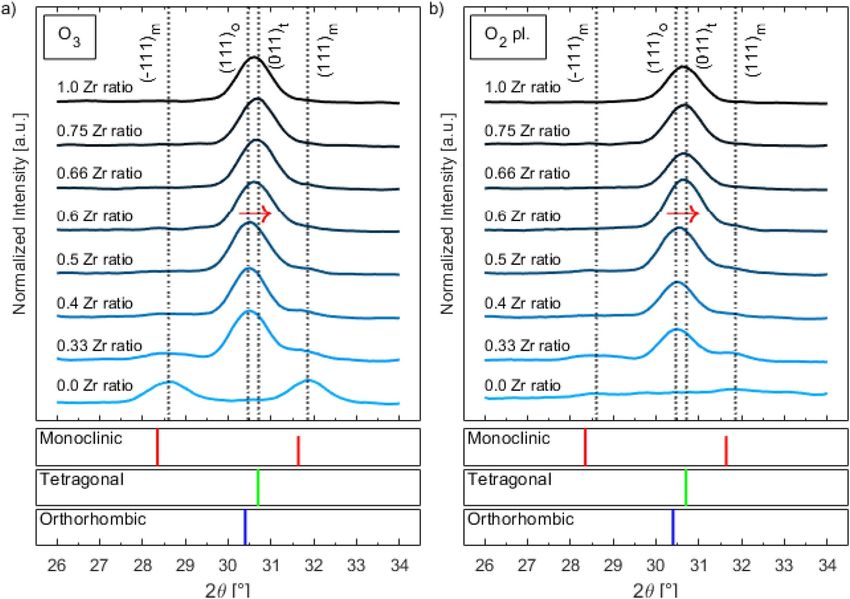
behavior is obtained (see figure 14(a)). Zr precursor ratios In addition to a wake-up effect, remanent polarization
ranging from 0.0 to 0.66 presented a small Pm /Pr relation fatigue and eventual breakdown of the ferroelectric after addi-
which is expected for a ferroelectric hysteresis loop. Never- tional cycling can occur [61]. The number of field cycles
theless, from figure 12, a lack of Pr for pure HfO2 , confirms before breakdown is presented in figure 15(b). The field cycles
that oxides with this composition exhibit a purely paraelectric to breakdown for varying Zr precursor ratios presented a sim-
behavior. An increasing Pm /Pr relation for Zr precursor ratios ilar but inverted trend to remanent polarization (see figure 12).
of 0.75 and above indicates a transition from a ferroelectric to This illustrates how the switching dynamics of the ferroelec-
an anti-ferroelectric-like hysteresis loop behavior as a result tric grains inside the film contributes to the breakdown of the
9J. Phys. D: Appl. Phys. 54 (2021) 035102 R Alcala et al
Figure 14. (a) Pm /Pr ratio of annealed Hf1-x Zrx O2 films obtained using O3 or O2 plasma as the oxygen source as a function of the Zr
precursor ratio used for the deposition process. The type of dielectric behavior is identified for different ranges. (b) Dielectric constant of
annealed Hfx Zr1-x O2 films obtained using O3 or O2 plasma as the oxygen source as a function of the Zr precursor ratio used for the
deposition process.
Figure 15. (a) Wake-up behavior defined by the ratio Pr,cycled /Pr,pristine and (b) electric field cycles to breakdown of annealed Hf1-x Zrx O2
films, obtained using O3 or O2 plasma as the oxygen source, as a function of the Zr precursor ratio. For the cycled samples in (a), all
samples were cycled for 104 cycles with a 4 V amplitude signal.
material [46]. Nevertheless, increasing the Zr content leads to for example in figures 12 and 14(b), remained intrinsic to the
a higher number of cycles to breakdown of the film compared dielectric material.
to increasing the Hf content. Also, the higher oxygen vacancy
concentration in the O2 plasma films becomes evident when
comparing oxygen sources since a high oxygen vacancy con- 4. Conclusions
centration is listed among the causes for early onset of fatigue
and a general reduction in the number of field cycles to break- Differences between the oxygen sources, O3 and O2 plasma,
down [46]. for an ALD process to deposit Hf1-x Zrx O2 films, were identi-
As a result of this analysis, a higher impurity presence in fied. Crystalline phase stabilization during the deposition pro-
the form of oxygen vacancies and carbon content related to cess was highly sensitive to the deposition temperature when
the use of O2 plasma during ALD growth increased hyster- using O3 as an oxygen source. In contrast, deposition tem-
esis loop pinching, increased t-phase stabilization at lower Zr perature had little effect on the film crystalline phase con-
precursor ratios, and reduced the number of cycles to break- tent when using O2 plasma. Additionally, a consistent GPC
down. This was observed as a reduction or shifting of trend was always observed for both oxygen sources in the evaluated
values for properties such as Pr and k for varying Zr content in interval, albeit, not equal among each other. Oxidation expos-
Hf1-x Zrx O2 films. Accordingly, an O3 usage would be favored ure length was shown to influence oxygen content in the film.
which underscores the relevance of the oxygen source. Nev- Consequently, a transient preference for t- to o- to m-phase
ertheless, it is worth mentioning that the overall trend shape, stabilization for increasing oxygen content was observed. In
10J. Phys. D: Appl. Phys. 54 (2021) 035102 R Alcala et al
comparison, O2 plasma clearly allowed for a faster oxida- [13] Shandalov M and McIntyre P C 2009 J. Appl. Phys. 106
tion step as it required only a fraction of the time compared 084322
to O3 . [14] Park M H, Lee Y H, Kim H J, Schenk T, Lee W, Kim K D,
Fengler F P G, Mikolajick T, Schroeder U and Hwang C S
Under the optimized ALD conditions regarding depos- 2017 Nanoscale 9 9973–86
ition temperature and oxidation exposure length, similar trends [15] Materlik R, Künneth C and Kersch A 2015 J. Appl. Phys. 117
among oxygen sources were obtained for varying Hf1-x Zrx O2 134109
film compositions. This indicates the possibility to use both [16] Schroeder U, Hwang C S and Funakubo H 2019
O3 and O2 plasma during ALD for Hf1-x Zrx O2 film depos- Ferroelectricity in Doped Hafnium Oxide: Materials,
Properties and Devices (Duxford: Woodhead Publishing)
itions. All things considered, O3 is suggested to be the favored ch 3
oxygen source due to reduced impurity concentrations in the [17] Müller J, Böscke T S, Schröder U, Mueller S, Bräuhaus D,
Hf1-x Zrx O2 films which lead to longer field cycling until break- Böttger U, Frey L and Mikolajick T 2012 Nano Lett. 12
down, reduced hysteresis loop pinching and a reduction in t- 4318–23
phase stabilization. [18] Shibayama S, Nishimura T, Migita S and Toriumi A 2018 J.
Appl. Phys. 124 184101
[19] Lomenzo P D, Jachalke S, Stoecker H, Mehner E, Richter C,
Acknowledgments Mikolajick T and Schroeder U 2020 Nano Energy 74
104733
P D L and C R are funded by the German Ministry of Eco- [20] Mehmood F, Hoffmann M, Lomenzo P D, Richter C,
Materano M, Mikolajick T and Schroeder U 2019 Adv.
nomic Affairs and Energy (BMWi) project (16IPCEI310) and Mater. Interfaces 6 1901180
would like to thank GlobalFoundries, Dresden, Germany for [21] Müller J, Polakowski P, Mueller S and Mikolajick T 2015 ECS
their support. TOF-SIMS experiments were performed at the J. Solid State Sci. Technol. 4 N30–5
Analytical Instrumentation Facility (AIF), which is suppor- [22] Shimizu T, Katayama K, Kiguchi T, Akama A, Konno T J,
ted by the State of North Carolina and the National Science Sakata O and Funakubo H 2016 Sci. Rep. 6 32931
[23] Lu Y W, Shieh J and Tsai F Y 2016 Acta Mater. 115 68–75
Foundation (award number ECCS-1542015). The AIF is a [24] Lomenzo P D, Takmeel Q, Zhou C, Fancher C M, Lambers E,
member of the North Carolina Research Triangle Nanotech- Rudawski N G, Jones J L, Moghaddam S and Nishida T
nology Network (RTNN), a site in the National Nanotechno- 2015 J. Appl. Phys. 117 134105
logy Coordinated Infrastructure (NNCI). The authors would [25] Fields S S et al 2020 ACS Appl. Mater. Interfaces 12
like to acknowledge Dr. Harm Knoops for fruitful discussions 26577–85
[26] Lomenzo P D, Takmeel Q, Moghaddam S and Nishida T 2016
and Air Liquide Inc. for their support. Thin Solid Films 615 139–44
[27] Kim S J, Mohan J, Lee J S, Kim H S, Lee J, Young C D,
Colombo L, Summerfelt S R, San T and Kim J 2019 ACS
ORCID iD Appl. Mater. Interfaces 11 5208–14
[28] Schroeder U, Materano M, Mittmann T, Lomenzo P D,
Ruben Alcala https://orcid.org/0000-0003-2799-9793 Mikolajick T and Toriumi A 2019 Japan J. Appl. Phys 58
SL0801
[29] Schroeder U, Hwang C S and Funakubo H 2019
References Ferroelectricity in Doped Hafnium Oxide: Materials,
Properties and Devices (Duxford: Woodhead Publishing)
[1] Böscke T S, Müller J, Bräuhaus D, Schröder U and Böttger U ch 3.3
2011 Appl. Phys. Lett. 99 102903 [30] Starschich S, Griesche D, Schneller T, Waser R and Böttger U
[2] Müller J, Böscke T S, Bräuhaus D, Schröder U, Böttger U, 2014 Appl. Phys. Lett. 104 202903
Sundqvist J, Kücher P, Mikolajick T and Frey L 2011 Appl. [31] Sharma Y, Barrionuevo D, Agarwal R, Pavunny S P and
Phys. Lett. 99 112901 Katiyar R S 2015 ECS Solid State Lett. 4 N13
[3] Mikolajick T et al 2014 Adv. Sci. Technol. 95 136–45 [32] Schroeder U, Hwang C S and Funakubo H 2019
[4] Berthelot A, Caillat C, Huard V, Barnola S, Boeck B, Ferroelectricity in Doped Hafnium Oxide: Materials,
Del-Puppo H, Emonet N and Lalanne F 2006 European Properties and Devices (Duxford: Woodhead Publishing)
Solid-State Device Research Conf. pp 343–6 ch 4
[5] Gusev E P et al 2001 Int. Electron Devices Meeting Technical [33] Jeon W 2020 J. Mater. Res 35 775–94
Digest (Cat. No.01CH37224) pp 20.1.1–4 [34] Materano M, Richter C, Mikolajick T and Schroeder U 2020 J.
[6] Park M H, Lee Y H, Mikolajick T, Schroeder U and Hwang C Vac. Sci. Technol. A 38 022402
S 2018 MRS Commun. 8 795–808 [35] Kim B S et al 2020 Nanoscale Res. Lett. 15 72
[7] Ohtaka O, Fukui H, Kunisada T, Fujisawa T, Funakoshi K, [36] Park S et al 2020 J. Mater. Chem. C 8 1344–52
Utsumi W, Irifune T, Kuroda K and Kikegawa T 2001 J. [37] Richter C, Schenk T, Schroeder U and Mikolajick T 2013 J.
Am. Ceram. Soc. 84 1369–73 Vac. Sci. Technol. A 32 01A117
[8] Ohtaka O, Fukui H, Kunisada T, Fujisawa T, Funakoshi K, [38] Lo Nigro R, Schilirò E, Mannino G, Di Franco S and
Utsumi W, Irifune T, Kuroda K and Kikegawa T 2001 Phys. Roccaforte F 2020 J. Cryst. Growth 539 125624
Rev. B 63 174108 [39] Rai V R and Agarwal S 2009 J. Phys. Chem. C 113 12962–5
[9] Garvie R C 1965 J. Phys. Chem. 69 1238–43 [40] Miikkulainen V, Leskelä M, Ritala M and Puurunen R L 2013
[10] Garvie R C 1978 J. Phys. Chem. 82 218–24 J. Appl. Phys. 113 021301
[11] Matsui K, Horikoshi H, Ohmichi N, Ohgai M, Yoshida H and [41] Knoops H C M, de Peuter K and Kessels W M M 2015 Appl.
Ikuhara Y 2003 J. Am. Ceram. Soc. 86 1401–8 Phys. Lett. 107 014102
[12] Pitcher M W, Ushakov S V, Navrotsky A, Woodfield B F, Li G, [42] Hur J, Tasneem N, Choe G, Wang P, Wang Z, Khan A I and Yu
Boerio-Goates J and Tissue B M 2005 J. Am. Ceram. Soc. S 2020 Nanotechnology 31 505707
88 160–7 [43] Rai V R and Agarwal S 2008 J. Phys. Chem. C 112 9552–4
11J. Phys. D: Appl. Phys. 54 (2021) 035102 R Alcala et al
[44] Rai V R, Vandalon V and Agarwal S 2010 Langmuir 26 [53] Triyoso D H, Tobin P J, White B E, Gregory R and Wang X D
13732–5 2006 Appl. Phys. Lett. 89 132903
[45] Hyuk Park M, Joon Kim H, Jin Kim Y, Lee W, Moon T and [54] Ryu H, Xu K, Kim J, Kang S, Guo J and Zhu W 2019 IEEE
Seong Hwang C 2013 Appl. Phys. Lett. Trans. Electron Devices 66 2359–64
102 242905 [55] Lin Y-C, McGuire F and Franklin A D 2018 J. Vac. Sci.
[46] Park M H et al 2020 J. Mater. Chem. C Technol. B 36 011204
8 10526-50 [56] Karbasian G, Dos Reis R, Yadav A K, Tan A J, Hu C and
[47] Materano M, Mittman T, Lomenzo P D, Zhou C, Jones J L, Salahuddin S 2017 Appl. Phys. Lett. 111 022907
Falkowski M, Kersch A, Mikolajick T and Schroeder U [57] Redin R D, Marks G W and Antoniak C E 1963 J. Appl. Phys.
2020 ACS Appl. Mater. Interfaces 34 600–10
[48] Polakowski P and Müller J 2015 Appl. Phys. Lett. 106 [58] Lomenzo P D, Materano M, Richter C, Alcala R, Mikolajick T
232905 and Schroeder U 2020 Appl. Phys. Lett. 117
[49] Smith S W, Kitahara A R, Rodriguez M A, Henry M D, [59] Schroeder U, Hwang C S and Funakubo H 2019
Brumbach M T and Ihlefeld J F 2017 Appl. Phys. Lett. Ferroelectricity in Doped Hafnium Oxide: Materials,
110 072901 Properties and Devices (Duxford: Woodhead Publishing)
[50] Park M H et al 2019 Appl. Phys. Rev. 6 041403 ch 2
[51] Weeks S L, Pal A, Narasimhan V K, Littau K A and Chiang T [60] Lomenzo P D, Richter C, Mikolajick T and Schroeder U 2020
2017 ACS Appl. Mater. Interfaces 9 13440–7 ACS Appl. Electron. Mater. 2 1583–95
[52] Suyama R, Takubo H and Kume S 1985 J. Am. Ceram. Soc. [61] Schenk T, Hoffmann M, Ocker J, Pešić M, Mikolajick T and
68 C-237 Schroeder U 2015 ACS Appl. Mater. Interfaces 7 20224–33
12You can also read