LINN-BENTON LOOP SERVICE DEVELOPMENT PLAN - Draft Plan March 2019
←
→
Page content transcription
If your browser does not render page correctly, please read the page content below
Attachment B

LINN-BENTON LOOP
SERVICE DEVELOPMENT PLAN
Draft Plan

                                  March 2019
Attachment B
Attachment B
                            LINN-BENTON LOOP SERVICE DEVELOPMENT PLAN | DRAFT PLAN
                                      Oregon Cascades West Council of Governments

Table of Contents
                                                                                                                                                              Page
Acknowledgements .................................................................................................................... ii
Executive Summary ............................................................................................................... ES-1
1   Introduction......................................................................................................................1-1
    Process ..................................................................................................................................................... 1-2
2   Issues and Opportunities .................................................................................................2-1
3   Transit Enhancements ......................................................................................................3-1
    Overview ................................................................................................................................................. 3-1
    Vision ........................................................................................................................................................ 3-2
    Phasing ..................................................................................................................................................... 3-6
    Financial Plan .......................................................................................................................................... 3-8
    Future Considerations .......................................................................................................................... 3-10
    Capital, Marketing and Other Supportive Elements .................................................................... 3-11
    Measuring Success ............................................................................................................................... 3-12

Table of Figures
                                                                                                                                                              Page
Figure 1                Regional Transit Vision Routes ........................................................................................... ES-3
Figure 2                Regional Transit Vision Network ....................................................................................... ES-4
Figure 3                Regional Commute Flows (2015)....................................................................................... 2-2
Figure 4                Percent of Households Defined as Low-Income (2009 to 2016) ................................ 2-3
Figure 5                Number of Low-Income Households .................................................................................. 2-3
Figure 6                Density of Low-Income Households (by Census Block Group, 2016) ......................... 2-4
Figure 7                Household income of respondents ..................................................................................... 2-5
Figure 8                Student Class Enrollment at OSU and LBCC by Time of Day ...................................... 2-7
Figure 9                Ridership Trends (FY 2009–10 to FY 2016–17) ........................................................... 2-9
Figure 10               Loop Weekday Ridership by Stop (Fall 2014)............................................................ 2-10
Figure 11               Top Service Improvement Requests ................................................................................. 2-11
Figure 12               Transit Brochures in the Linn-Benton Region ................................................................... 2-12
Figure 13               Assumptions ............................................................................................................................ 3-1
Figure 14               Regional Transit Vision Routes ............................................................................................ 3-2
Figure 15               Regional Transit Vision Map (Weekdays) ....................................................................... 3-4
Figure 16               Regional Transit Vision Map (Saturdays)......................................................................... 3-5
Figure 17               Phasing Summary .................................................................................................................. 3-6
Figure 18               Expenditure Details (Fiscal Year Ending) ......................................................................... 3-9
Figure 19               Service Evaluation............................................................................................................... 3-13

Cover photo: Linn-Benton Loop at the Corvallis Transit Center.
Source: City of Corvallis

                                                   Nelson\Nygaard Consulting Associates Inc. | i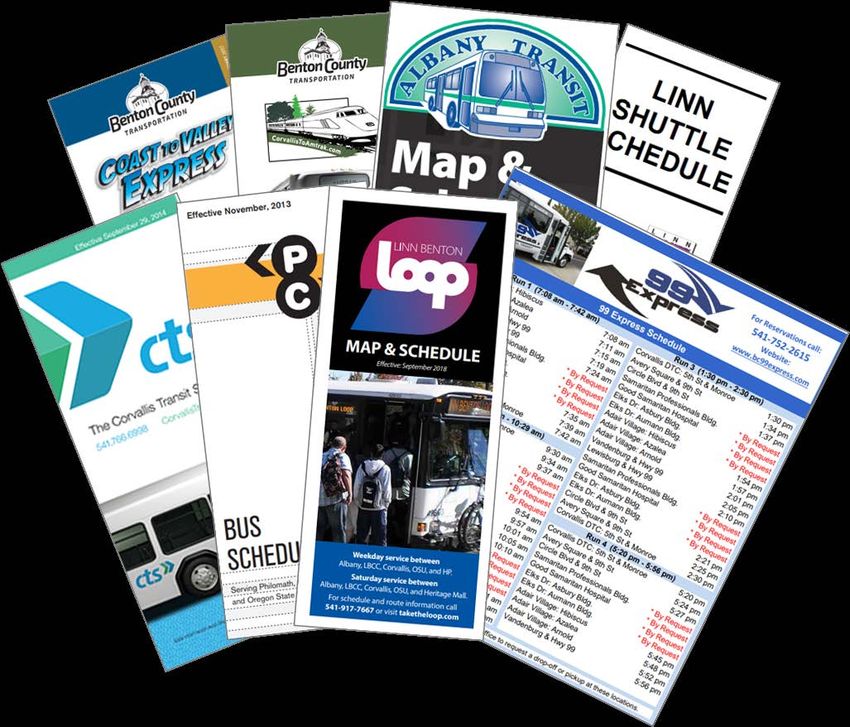
Attachment B
                LINN-BENTON LOOP SERVICE DEVELOPMENT PLAN | DRAFT PLAN
                          Oregon Cascades West Council of Governments

ACKNOWLEDGEMENTS

Linn-Benton Loop Governing Board                                Other Stakeholders
Hal Brauner, City of Corvallis                                  Mark Bernard, Oregon Department of
                                                                  Transportation (ODOT)
Bruce Clemetsen, Linn-Benton Community
  College (LBCC)                                                Ken Bronson, Linn Shuttle
Roger Nyquist, Linn County                                      James Feldmann, ODOT
                                                                Dave Henderson, Linn-Benton
Technical Advisory Committee (TAC)
                                                                  Community College (LBCC)
Chris Bailey, City of Albany
                                                                Deanna Merle Lloyd, Oregon State
Tim Bates, City of Corvallis                                      University (OSU)
Sarah Bronstein, Oregon State University                        M’Liss Runyon, LBCC
Barry Hoffman, City of Albany                                   Ann Scheerer, PhD, OSU
Andrew Koll, Resident-at-large                                  Oregon State University Fall 2018
                                                                  SUS 304 Students
Lisa Scherf, City of Corvallis
Mark Volmert, Linn County                                       Consultant Team
                                                                Nelson\Nygaard Consulting Associates:
Project Management Team
                                                                  Jamey Dempster, Paul Leitman,
Lee Lazaro, Benton County                                         Maggie Derk, and Oren Eshel
Phil Warnock, Oregon Cascades West Council of
  Governments (OCWCOG)
Nick Meltzer, Corvallis Area Metropolitan
   Planning Organization / OCWCOG
Dana Nichols, Albany Area Metropolitan
  Planning Organization/ OCWCOG

                                 Nelson\Nygaard Consulting Associates Inc. | ii
Attachment B
LINN-BENTON LOOP SERVICE DEVELOPMENT PLAN | DRAFT PLAN
Oregon Cascades West Council of Governments
EXECUTIVE SUMMARY
The Albany and Corvallis areas are important centers in the Mid-Willamette Valley and serve as
economic and educational hubs. Many people travel daily to and from the two cities, including
residents, employers, visitors, and students. Future growth will further reinforce the symbiotic
relationship in the region.
Public transportation is a key part of the region’s transportation system: it provides a critical
mobility for people who do not have access to a vehicle, provides an alternative to driving and
parking on busy roads, and can help reduce personal vehicle emissions.
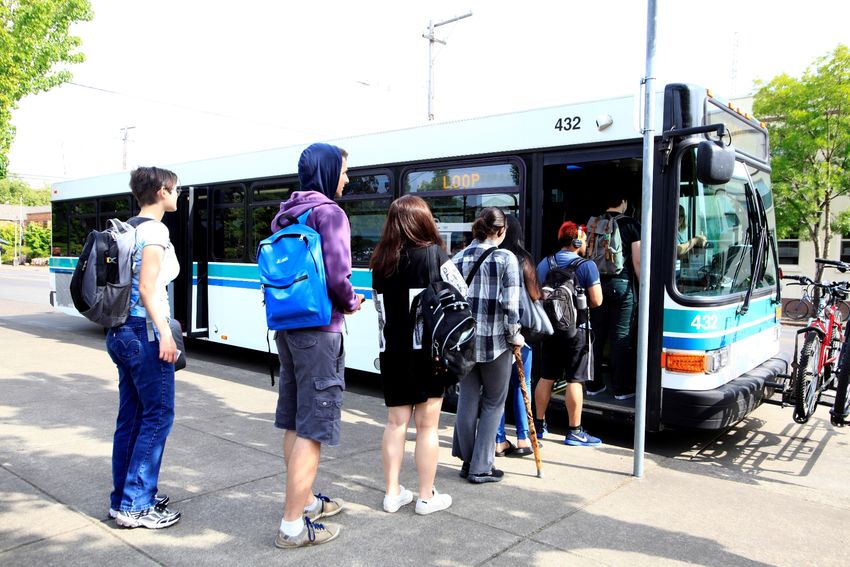
The Linn-Benton Loop (“the Loop”) bus system connects Albany and Corvallis. It has been in
service for almost 40 years, connecting people to education, work, shopping, and play.
The Linn-Benton Loop is an important service in the Mid-Willamette Valley.
Source: City of Corvallis
In 2019 public transportation providers in Oregon will begin receiving funds from the Statewide
Transportation Improvement Fund (STIF). The transit funds were part of the legislature’s
Nelson\Nygaard Consulting Associates Inc. | ES-1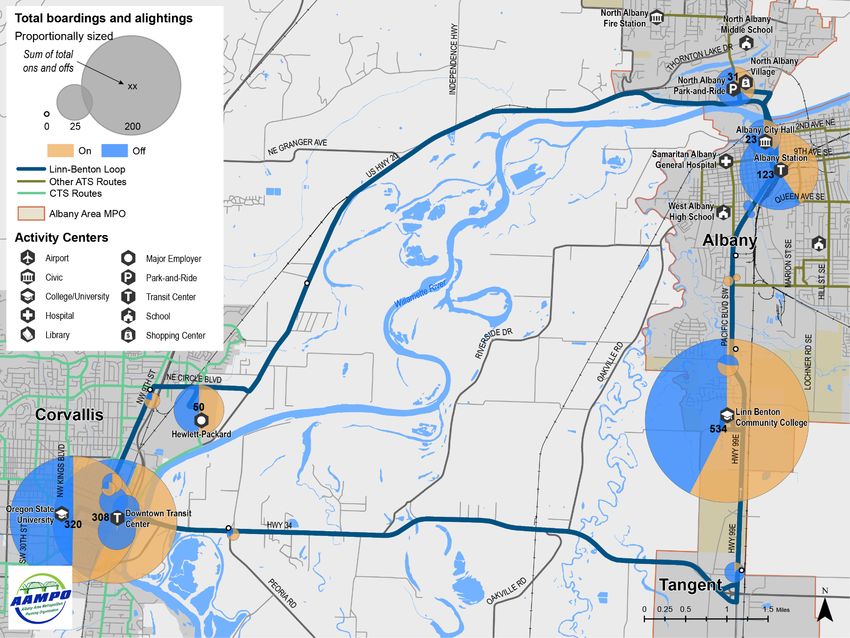
Attachment B
LINN-BENTON LOOP SERVICE DEVELOPMENT PLAN | DRAFT PLAN
Oregon Cascades West Council of Governments
transportation package passed in 2017 (House Bill 2017 Keep Oregon Moving). The Loop
Governing Board has since then preliminarily agreed to plan for up to $600,000 in service
enhancements, based on each County contributing an additional $300,000 each in new STIF
revenues.
The Plan was developed in collaboration with the Linn-Benton Loop Technical Advisory
Committee (TAC), and included analysis of the existing system and historical data, an on-board
survey of Loop passengers in October 2018, and a regional stakeholders workshop in December
2018.
Stakeholders at the December 2018 workshop discuss the tradeoffs of proposed service options.
Source: Nelson\Nygaard Consulting Associates
Recommended Service Plan
The Linn-Benton Loop Service Development Plan (SDP) was developed to identify and prioritize
service changes to the Loop. Recommendations described in this Plan include:
Additional service frequency when demand is highest
Bi-directional service to improve access, convenience, and reduce travel times
Later service until 10:00 p.m.
Maintain service to most locations that are served today.
The Linn-Benton Loop vision is to provide reliable and efficient transportation for commuters,
students, residents, and visitors. The Loop strives to be a clear and easy-to-understand service.
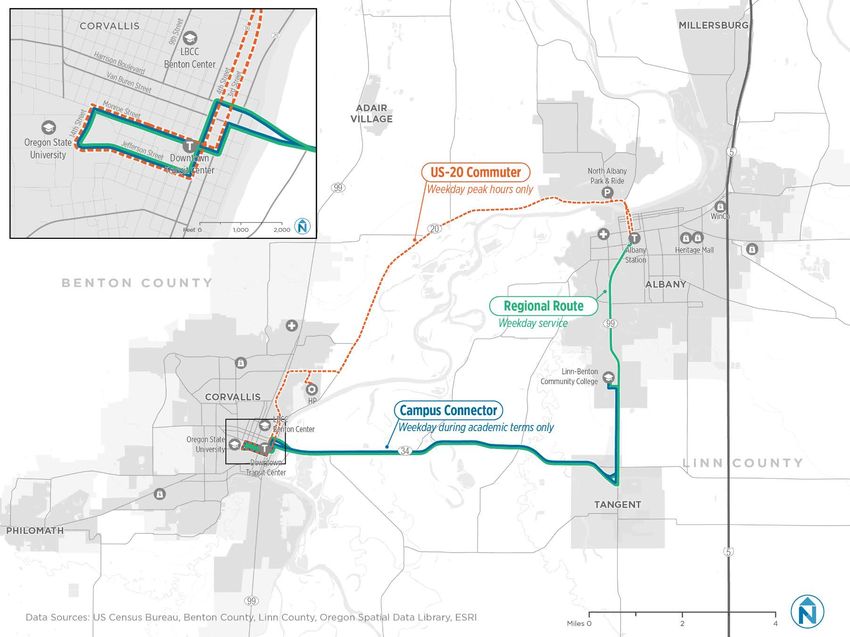
The Linn-Benton Loop system will be composed of three routes:
Regional Route: weekday and Saturday service between Oregon State University
(OSU)/Downtown Transit Center, Linn-Benton Community College (LBCC) and Albany
Station via OR-34 and OR-99E
Nelson\Nygaard Consulting Associates Inc. | ES-2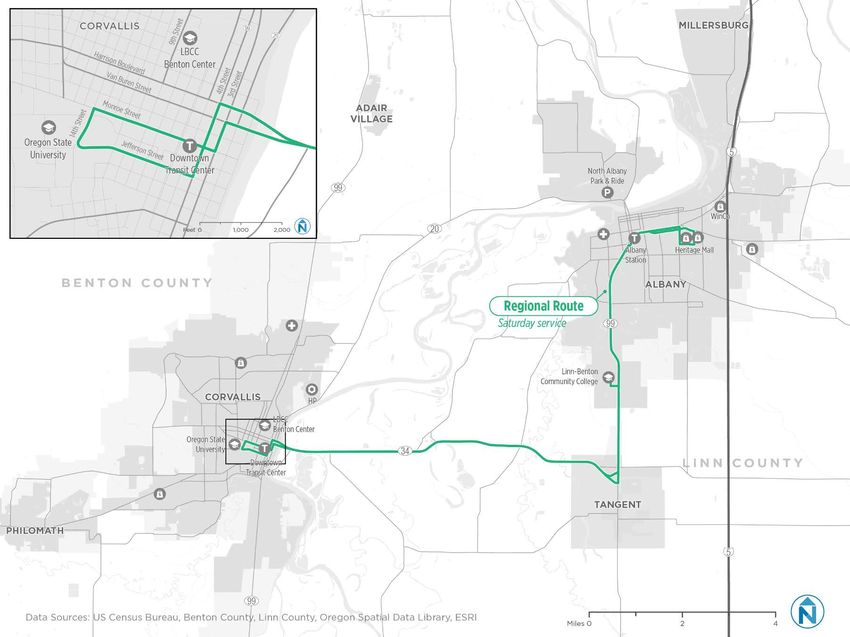
Attachment B
LINN-BENTON LOOP SERVICE DEVELOPMENT PLAN | DRAFT PLAN
Oregon Cascades West Council of Governments
Campus Connector: weekday service between OSU/Downtown Transit Center and
LBCC via OR-34
US-20 Commuter: weekday peak-hour service between OSU/Downtown Transit
Center and Albany Station via US-20
Routes and service characteristics and the regional transit network are shown in Figure 1 and
Figure 2 respectively.
Figure 1 Regional Transit Vision Routes
Time of Frequency
Route Service Days Year Hours of Service (min) Vehicles[A]
Monday-Friday All year 6 am – 10:15 pm 75
Regional Route 1
Saturday All year 8 am – 6 pm 90
6:00 – 9:00 am
US-20 Commuter Monday-Friday All year 60
4:30 – 7:30 pm 1[B]
OSU/LBCC Midday: 9:30 am – 4 pm 30
Campus Connector Monday-Friday academic
term 1 AM/PM: 7 – 9:30 am & 4 – 7 pm 60 1
Notes:
[A] Number of vehicles does not include spare vehicles necessary to support bus services.
[B] Preliminary analysis suggests one vehicle could serve both the morning and afternoon Commuter route, and the mid-day Campus Connector;
Campus Connector at 30 minute frequencies will require two vehicles.
1 Fall, Winter and Spring terms only
Nelson\Nygaard Consulting Associates Inc. | ES-3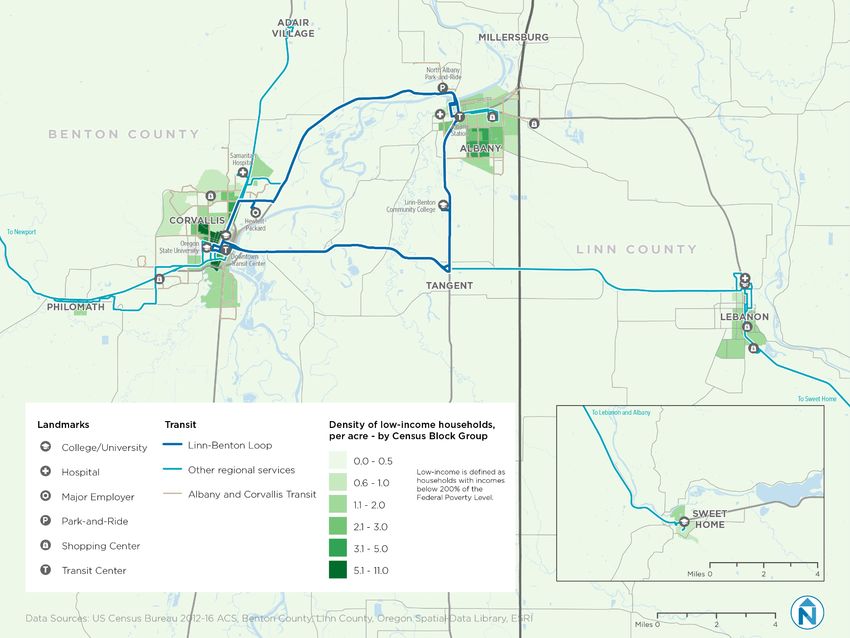
Attachment B
                                         LINN-BENTON LOOP SERVICE DEVELOPMENT PLAN | DRAFT PLAN
                                                   Oregon Cascades West Council of Governments

Figure 2   Regional Transit Vision Network

                                                  Nelson\Nygaard Consulting Associates Inc. | ES-4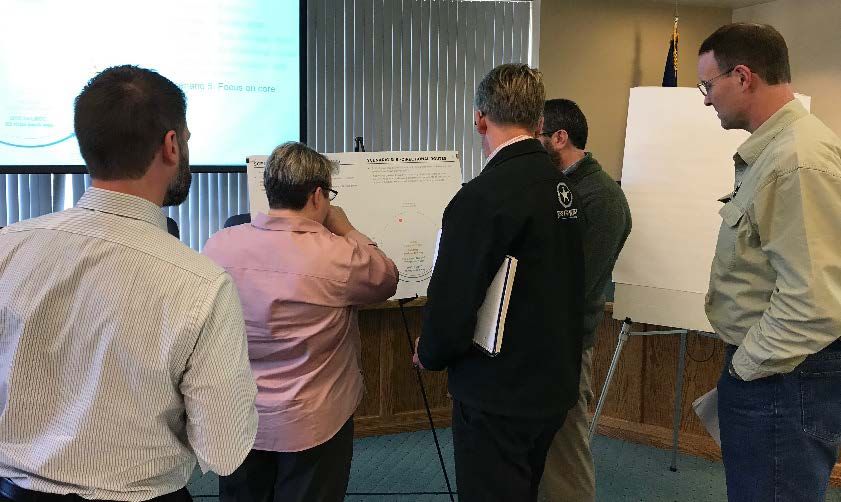
Attachment B
                         LINN-BENTON LOOP SERVICE DEVELOPMENT PLAN | DRAFT PLAN
                                   Oregon Cascades West Council of Governments

1 INTRODUCTION
The Loop is a public transportation partnership that links two communities to critical
educational, employment, and activity centers. The Loop began operating in 1980 to provide
transit service between Albany and Corvallis. Over the decades the route has expanded capacity
on its busiest segments and is an integral part of the transit system in the region.
The Loop has financial, political, and public support from a broad base of partners, including
Linn and Benton Counties, the Corvallis Area Metropolitan Planning Organization (CAMPO),
Albany Area Metropolitan Planning Organization (AAMPO), Linn-Benton Community College
(LBCC), Oregon State University (OSU), Oregon Department of Transportation (ODOT), Hewlett-
Packard (HP), and Good Samaritan Regional Medical Center. Many regional partners and the
public recognize there are opportunities to improve service and provide improved connectivity
and access for people traveling between the two cities.

Source: Nelson\Nygaard

                                   Nelson\Nygaard Consulting Associates, Inc. | 1-1
Attachment B
                 LINN-BENTON LOOP SERVICE DEVELOPMENT PLAN | DRAFT PLAN
                           Oregon Cascades West Council of Governments

In 2019 public transportation providers in Oregon will begin receiving funds from the Statewide
Transportation Improvement Fund (STIF). The transit funds were part of the legislature’s
transportation package passed in 2017 a transit-specific fund developed after passage of Oregon
(House Bill 2017 (known as Keep Oregon Moving). The Loop Governing Board has since then
preliminarily agreed to plan for up to $600,000 in service enhancements, based on each County
contributing an additional $300,000 each in new STIF revenues. This SDP provides the specific
steps and service adjustments for the Loop to achieve a 10-year transit vision using the additional
funds from STIF. Recommendations from the plan include additional frequency of service on the
busiest corridors when demand is highest, bi-directional service to enhance access and reduce
travel times, extended service into the evening, and maintaining service to all major locations that
are served today.

PROCESS
The SDP was developed through a collaboration with the Linn-Benton Loop Technical
Advisory Committee (TAC) based on an analysis of the existing system and historical data.
Meeting with the TAC occurred monthly between September 2018 and February 2019.
Students in an OSU Sustainability Assessment course conducted an on-board survey of Loop
passengers in October 2018 over a five day period. They collected 239 responses. The survey was
used to understand who was riding the Loop (including their affiliation with local institutions and
income levels) and the type of service improvements they were looking for most.
In December 2018, a Loop regional stakeholders planning workshop brought together
regional transit providers, partners and advisors to discuss the range of service changes that could
be implemented on the Loop. The workshop was designed to understand participants’ priorities,
weigh the tradeoffs of different operating models, and generate new ideas to address rider needs.
The result of the workshop was draft service vision that included preferred frequency, alignment,
and span.
Findings from technical analysis, input from TAC members, results from the on-board survey,
and outcomes from the workshop were all used to develop the Linn-Benton Loop Service
Development Plan.

                             Nelson\Nygaard Consulting Associates, Inc. | 1-2
Attachment B
LINN-BENTON LOOP SERVICE DEVELOPMENT PLAN | DRAFT PLAN
Oregon Cascades West Council of Governments
2 ISSUES AND OPPORTUNITIES
This chapter presents key issues, findings, and opportunities for the Loop, and travel between
Albany and Corvallis in general. These issues were identified through analysis, the on-board
survey, and feedback from regional stakeholders.
The key findings include the following issues. These are presented in more detail on the following
pages.
1. Commute trends indicate a demand for region transportation services.
2. Low-income populations in Linn and Benton Counties are increasing.
3. Most passengers on the Linn-Benton Loop live in households within incomes less than
$50,000.
4. The Loop serves two limited markets: commuters and students.
5. There is limited service for people traveling across the region on weekends.
6. People who depend on transportation in the evening have unmet transit needs.
7. The Linn-Benton Loop is scheduled at frequencies that do not coordinate well with other
regional schedules, presenting barriers for operations and passengers.
8. Ridership on the Linn-Benton Loop has remained relatively flat over the past several
years, with a slight downward trajectory.
9. Most ridership on the Linn-Benton Loop is at LBCC, Downtown Corvallis, and OSU.
10. The top priorities for Linn-Benton Loop service improvements are improved frequency
and later service in the evening.
11. Many of the region’s transit agencies have unique brands and provide information
independently of each other.
1. Commute trends indicate a demand for regional transportation services.
Current commute travel patterns indicate that approximately 5,700 workers travel between
Corvallis or Philomath and Albany, Millersburg, or Tangent on a daily basis (see Figure 3). 2 The
largest flow is from people who live in Albany, Millersburg, or Tangent and commute to jobs in
Corvallis or Philomath. Between 2009 and 2015, the strongest growth in travel flows has been
2 This data is based on Longitudinal-Employer Household Dynamics (LEHD) data. It represents commute trips contained
within the Corvallis, Albany, and Lebanon/Sweet Home areas. Residents of communities outside the region who commute
to jobs in the region, and employees that live in the region but commute to jobs outside the region (such as to Salem,
Eugene, or Portland) are not included in these values. LEHD data include information from IRS records that are based on
addresses provided by employers. Some work location addresses may not be for actual location of employment, but for
corporate or main offices. Therefore someone who lives in Corvallis may be shown as commuting out of the city, even
though they work for a company within Corvallis city limits or telecommute.
Nelson\Nygaard Consulting Associates, Inc. | 2-1Attachment B
LINN-BENTON LOOP SERVICE DEVELOPMENT PLAN | DRAFT PLAN
Oregon Cascades West Council of Governments
from people who commute between Lebanon/Sweet Home and the Albany area (29% increase)
and between Lebanon/Sweet Home and the Corvallis areas (23%). Growth in commutes between
Albany and Corvallis also grew notably (22%).
As population and employment grows in Linn and Benton Counties, travel demand between
major cities within the region is likely to continue increasing. Transit service will be a key part of
the transportation mix to provide people an option to avoid driving and for people who do not
have access to a private vehicle. To accommodate future demand, transit services will need to
operate more frequently and for longer periods of time.
Figure 3 Regional Commute Flows (2015)
Source: Longitudinal-Employer Household Dynamics (2015)
2. Low-income populations in Linn and Benton Counties are increasing.
Low-income populations are defined in the STIF rules as households below 200% of the federal
poverty level. 3 Lebanon and Corvallis have the region’s highest share of low-income households.
Between 2009 and 2016, most jurisdictions saw increases in the percent of people defined as low-
income (see Figure 4) and all jurisdictions experienced increases in the total number of
households defined as low-income (see Figure 5). Geographically within the region, the density
of low-income households at the Block Group level is highly concentrated in the region’s cities
(see Figure 6).
3 STIF guidance on estimating low-income households recommends applying the percent of population classified as low-
income to the number of households.
Nelson\Nygaard Consulting Associates, Inc. | 2-2Attachment B
LINN-BENTON LOOP SERVICE DEVELOPMENT PLAN | DRAFT PLAN
Oregon Cascades West Council of Governments
Low-income households benefit most from affordable, accessible, and reliable transit options.
Future transit demand will be influenced by where low-income individuals live and work. As low-
income households increase in the region, demand for transit service is expected to grow.
Figure 4 Percent of Households Defined as Low-Income (2009 to 2016)
Note: Low-income defined as people with incomes below 200% of the Federal Poverty Level.
Source: US Census Bureau, American Community Survey, 5-Year Estimates, 2005-09 to 2012-16, Table C17002
Figure 5 Number of Low-Income Households
City / County 2009 2016 Change Percent Change
Benton County 11,321 12,933 1,612 14.2%
Linn County 14,421 18,238 3,817 26.5%
Albany 6,236 7,841 1,605 25.7%
Corvallis 9,466 9,766 300 3.2%
Lebanon 2,405 3,257 852 35.4%
Sweet Home 1,283 1,770 487 40.0%
Notes: Low-income households calculated by dividing the total number of people with incomes below 200% of the Federal Poverty
Level by the average household size of occupied housing units. American Community Survey data is an estimate and values from
smaller communities have a higher margin of error.
Source: US Census Bureau, American Community Survey, 5-Year Estimates, 2005-09 to 2012-16, Table C17002 and Table B25010
Nelson\Nygaard Consulting Associates, Inc. | 2-3Attachment B
LINN-BENTON LOOP SERVICE DEVELOPMENT PLAN | DRAFT PLAN
Oregon Cascades West Council of Governments
Figure 6 Density of Low-Income Households (by Census Block Group, 2016)
Note: American Community Survey data is an estimate and values from rural areas or Census Block Groups with few people have a high margin of error.
Sources: US Census Bureau, American Community Survey, 5-Year Estimates, 2012-16, Table C17002 and B25010
Nelson\Nygaard Consulting Associates, Inc. | 2-4Attachment B
LINN-BENTON LOOP SERVICE DEVELOPMENT PLAN | DRAFT PLAN
Oregon Cascades West Council of Governments
3. Most passengers on the Linn-Benton Loop live in households within incomes
less than $50,000.
The Linn-Benton Loop on-board survey of in October 2018 asked respondents to indicate their
household income. The most common response, representing 45% of surveyed passengers, was
less than $25,000. Another quarter of respondents live in households with incomes between
$25,000 and $50,000 (see Figure 7).
The survey also asked respondents for the number of people who live in their household. If a
respondent answered both of these questions 4, their responses were compared to determine if
they lived in a low-income household (i.e., incomes below 200% of the federal poverty level based
on total household income and number of residents). Based on this evaluation, approximately
64% of respondents were classified as low-income.
Transit service provides an important option for people who lack the financial means to own or
operate a vehicle. Approximately two-thirds of the Loop ridership is low-income, indicating the
important role the Loop serves in connecting low-income individuals in the region.
Figure 7 Household income of respondents
$85,001 or
greater
31
14%
$50,000 to Less than
$85,000 $25,000
32 97
15% 45%
$25,000 to
$50,000
56
26% n = 216
4. The Loop serves two limited markets: commuters and students.
As a large region, travel needs in the Linn-Benton County area are diverse. The Loop, as currently
designed, primarily serves commuters and students at OSU and LBCC. However, travel between
Corvallis and Albany includes more than just work week commuters, or students. People use the
Loop to travel to and from work for non-traditional work shifts, to access healthcare facilities, and
to go shopping and run errands.
4 216 respondents provided their household income. 211 respondents provided their household size. 196 respondents
provided responses to both questions.
Nelson\Nygaard Consulting Associates, Inc. | 2-5Attachment B
LINN-BENTON LOOP SERVICE DEVELOPMENT PLAN | DRAFT PLAN
Oregon Cascades West Council of Governments
There are needs for additional transportation services to support regional mobility for all trip
types. More frequent service throughout the day and longer spans of service on weekends are
potential service adjustments that would expand the utility of the Linn-Benton Loop for more
people.
5. There is limited service for people traveling across the region on weekends.
The Loop currently provides most service during the weekday, with a focus on serving commuters
and college students. However, weekend travel needs are also present in the region, including
needed connections to weekend jobs, shopping centers, and medical facilities. In addition to
limited number of trips, the Linn-Benton Loop service on Saturday operates in the counter-
clockwise direction only.
Weekend trips are not well served because the limited frequency reduces the usefulness of the
service for spontaneous trips. Additionally, the one-way direction results in out-of-direction travel
for all passengers; but is greatest for passengers who only travel a relatively short distance. For
example, consider a passenger who needs to travel from Albany Station to LBCC (a distance of
approximately three miles). To make the journey on the Loop on Saturday, they would need to
travel all the way to Corvallis, a trip that would take approximately one hour.
6. People who depend on transportation in the evening have unmet transit
needs.
Classes start as early as 6:20 am at OSU and at 7 am at LBCC – both before the Loop begins. The
first Loop trip arrives (via US-20) at OSU at 7:05 am, and the first Loop trip arrives at LBCC at
7:25 am. Most students start classes later (between 8 and 9:30 am) and enrollment peaks at more
than 10,000 students around 11 am. Class enrollment remains relatively high until after 5 pm
when it begins to drop. Classes are in session on both campuses until after 9 pm.
The last trip from LBCC to Corvallis departs at 5:50 pm, and the last trip from OSU to Albany
departs at 6:20 pm 5. There are still more than 1,000 students actively in classes after service ends
for the day.
Figure 8 shows the total number of students enrolled in classes at both OSU and LBCC Main
Campus by time of day. The span of Loop service at each campus is shown as the horizontal bars
and faded backgrounds.
Service on the Linn-Benton Loop does not serve the needs of people who travel late in the
evening, including students, faculty, staff, or other late evening non-university affiliated
commuters. If these individuals lack access to a car, they may not have any dependable
transportation from campus or work to return home. These limited hours may deter students and
faculty at LBCC or OSU or regional employees from using the Loop.
5The last direct trip from Corvallis to LBCC (via OR-34) departs the Downtown Transit Center at 4:35 pm. Passengers
who catch the 6:20 pm trip can travel to LBCC via US-20 and Albany Station, with a 40-minute travel time.
Nelson\Nygaard Consulting Associates, Inc. | 2-6Attachment B
LINN-BENTON LOOP SERVICE DEVELOPMENT PLAN | DRAFT PLAN
Oregon Cascades West Council of Governments
Figure 8 Student Class Enrollment at OSU and LBCC by Time of Day
12,000
Loop service at OSU
Loop service at LBCC
10,000
Students enrolled (OSU and LBCC)
8,000
6,000
4,000
2,000
0
17:00
12:00
21:00
7:00
13:00
15:00
10:00
18:00
11:00
8:00
16:00
19:00
22:00
6:00
9:00
14:00
20:00
Average weekday Friday
Source: Oregon State University (Fall 2018) and Linn-Benton Community College (Fall 2018) schedules.
7. The Linn-Benton Loop is scheduled at frequencies that do not coordinate well
with other regional schedules, presenting barriers for operations and
passengers.
Most Loop trips in the morning and afternoon, in addition to the express trips between LBCC and
Downtown Corvallis, cycle in approximately 75 minutes. Service at this frequency makes it
difficult for passengers to easily remember the schedule, connect with other services, and get to
and from classes consistently.
Service every 75 minutes means individual stops are never served at the same time each hour.
This requires passengers to consult a schedule to know when the next bus arrives and makes the
service more difficult to remember or understand. Passengers typically find it easier to remember
a single time every hour, rather than mixed arrival times throughout the day.
Both CTS and ATS operate on a consistent schedule with pulses at their transit centers at the
same times each hour. Because the Loop’s schedule does not match the local services, riders
cannot connect to CTS or ATS consistently. The lack of consistent connections between the Loop
and each city’s system limits how easily riders can make transit connections. Passengers who need
Nelson\Nygaard Consulting Associates, Inc. | 2-7Attachment B
LINN-BENTON LOOP SERVICE DEVELOPMENT PLAN | DRAFT PLAN
Oregon Cascades West Council of Governments
to make connections and want to minimize their wait time must therefore travel at specific times
throughout the day when connections are easiest.
Similar to connections to CTS and ATS, the Linn-Benton Loop does not coordinate well with class
schedules at OSU and LBCC. The majority of classes at OSU and LBCC start or end hourly. 6
During the midday, Loop service is hourly and this provides greater consistency for students to
use the Loop to travel to or from classes. At LBCC – which has classes that start or end
approximately every 30 minutes – there is a slight mismatch between service and class schedules.
For example, midday Loop buses arrive at LBCC 45 minutes after the hour, and depart at the top
of the hour. Classes that begin at the top of the hour are well served on both ends of the class if
students can get between the bus stop and the class in 10 minutes. Classes that start at 30 minutes
past the hour and end at 20 minutes past the following hour require at least 40-45 minutes of
wait time before and after the classes. Hourly service would provide the greatest level of simplicity
to passengers and allow the service to coordinate well with other transit providers and class
schedules at the two colleges.
However, if service were to operate hourly using existing one-way loop structure and 75-minute
cycle times, the Loop would require an additional bus and driver. Because the cycle time of the
Loop trips are just over an hour, drivers would return to the starting point relatively soon after the
previous trip had departed. Therefore, to maintain consistent hourly service, the drivers would
need inefficient layover times between runs. In short, the Loop’s existing cycle time limits
opportunities to increase frequency of service in ways that are financially and operationally
efficient.
8. Ridership on the Linn-Benton Loop has remained relatively flat over the past
several years, with a slight downward trajectory.
Ridership on the Linn-Benton Loop has remained relatively flat between 2009–10 and 2017–18.
Although ridership grew more than 20% above 2009–10 levels between 2011 and 2014, ridership
has returned to its 2009–10 level, at approximately 110,000 boardings per year (see Figure 9).
The Linn-Benton Loop has maintained strong ridership in the past decade, but has seen some
small declines. These ridership trends are not consistent with the growth in the region’s
population, employment, and student enrollment. This suggests less transit use and reduced
relevance of the Loop in the region’s transportation system. However, as the Loop has not
undergone significant changes in service for many years. This suggests service changes may be
necessary to improve its usefulness for residents, employees, and students.
6 Most courses are scheduled from :00 to :50. Eighty-four percent (84%) of class enrollments at OSU, and 72% of class
enrollments at LBCC are on this cycle. Three percent (3%) of class enrollments at OSU, and 12% of class enrollments at
LBCC are in classes that start at a time other than the top of the hour.
Nelson\Nygaard Consulting Associates, Inc. | 2-8Attachment B
LINN-BENTON LOOP SERVICE DEVELOPMENT PLAN | DRAFT PLAN
Oregon Cascades West Council of Governments
Figure 9 Ridership Trends (FY 2009–10 to FY 2016–17)
140,000
Linn-Benton Loop
120,000
100,000
Albany Transit
Annual Boardings
80,000
Linn Shuttle
60,000
40,000
Philomath
Connection
20,000
Coast to Valley Express
99 Express
0
2009-10 2010-11 2011-12 2012-13 2013-14 2014-15 2015-16 2016-17 2017-18
Fiscal Year
Sources: Benton County, Corvallis Transit System, Albany Transit System, Linn-Benton Loop
Note: Ridership on Corvallis Transit is not included because its ridership is almost ten times larger than the Linn-Benton Loop and
does not compare well with the region’s other transit services. Corvallis Transit served approximately 710,000 trips in 2009–10,
900,000 in 2010–11, and has ranged between 1,110,000 and 1,190,000 between 2011–12 and 2016–17.
9. Most ridership on the Linn-Benton Loop is at LBCC, Downtown Corvallis, and
OSU.
The Loop’s busiest stops are at LBCC, Corvallis’ Downtown Transit Center, and OSU (Figure 10).
Other stops with relatively high ridership are Albany Station, Hewlett-Packard, and North Albany
Park-and-Ride. Service between LBCC and Downtown Corvallis via OR-34 has the highest
demand and this corridor is likely to continue to have strong ridership and have the highest
productivity in terms of riders per service hour.
Nelson\Nygaard Consulting Associates, Inc. | 2-9Attachment B
LINN-BENTON LOOP SERVICE DEVELOPMENT PLAN | DRAFT PLAN
Oregon Cascades West Council of Governments
Figure 10 Loop Weekday Ridership by Stop (Fall 2014)
Nelson\Nygaard Consulting Associates, Inc. | 2-10Attachment B
LINN-BENTON LOOP SERVICE DEVELOPMENT PLAN | DRAFT PLAN
Oregon Cascades West Council of Governments
10. The top priorities for Linn-Benton Loop service improvements are improved
frequency and later service in the evening.
The on-board survey of Linn-Benton Loop passengers asked respondents to select their top three
improvements that would encourage them to ride more often. Twelve options were provided and
respondents were given the option to provide their own improvement if it was not listed. The
results (Figure 11) indicate frequency, span of service, reduced travel time, and improved
information were the most supported improvements. More frequent service was selected much
more often – 19 percentage points higher than later evening service – indicating there is broad
support for Loop buses to run more often throughout the day.
Earlier morning service, additional Saturday service, new service to more areas, and improved
connections to other services were low on their list of priorities and suggests passengers prefer
improvements to the existing services over adding service at times, on days and in places where
none exist today (with the exception of later evening service). Faster travel time – selected by 31%
of respondents – may be provided in coordination with more frequent service because reduced
wait time at the start of a trip will reduce overall travel time, even without any increase in speed.
Figure 11 Top Service Improvement Requests
More frequent service 59%
Later service in evening 40%
Faster travel time 31%
Better "where's the bus" information 26%
More express service 26%
Wireless Internet 25%
Earlier service in morning 16%
More Saturday service 16%
Bicycle capacity 10%
Service to more areas/locations 9%
Improved connections to other services 8%
Improved on-time performance 2%
n = 232
Other 3%
0 50 100 150
Number of selections
Source: Linn-Benton Loop 2018 Passenger Survey
Nelson\Nygaard Consulting Associates, Inc. | 2-11Attachment B
LINN-BENTON LOOP SERVICE DEVELOPMENT PLAN | DRAFT PLAN
Oregon Cascades West Council of Governments
11. Many of the region’s transit agencies have unique brands and provide
information independently of each other.
Many agencies and transit services operate in the Linn-Benton region, including two urban
transit systems and six regional or intercity routes – each with their own unique name and
branding. Each agency provides their own maps, schedules, fare information, and contact
information on their independent websites. Some agencies provide additional information that
others do not, such as trip planners and service alerts. Additionally, each agency provides
different fare types and has different costs for riders.
Inconsistent information and branding can make connections to and from the Linn-Benton Loop
more confusing for transit riders, and particularly new or inexperienced ones. The transit rider
experience could be improved with consistent information and branding across the region. This
can be accomplished through a regional effort, which could range from small changes (e.g., each
organization reorganizes their webpages so they are consistent), to larger changes (e.g.,
developing a unified brand for services across the region).
Figure 12 Transit Brochures in the Linn-Benton Region
Nelson\Nygaard Consulting Associates, Inc. | 2-12Attachment B
LINN-BENTON LOOP SERVICE DEVELOPMENT PLAN | DRAFT PLAN
Oregon Cascades West Council of Governments
3 TRANSIT ENHANCEMENTS
OVERVIEW
This chapter describes the proposed 10-year operating plan to achieve the Loops service vision.
This includes proposed route alignments, frequency, span, and days of service. This plan was
established based on service requests from passengers, technical analysis, the workshop with
regional stakeholders, and refinements based on TAC guidance.
The specific service improvements were grouped into three phases. All phases are constrained
within the Loop’s expected operating budget ($1.1 million annually, or $600,000 above today’s
operating budget).
Figure 13 provides the operational and financial assumptions used to develop the Linn-Benton
Loop phasing plan.
Figure 13 Assumptions
Assumption Value Details
Weekday service days 252 5 days per week, 52 weeks per year, excluding eight holidays
52 Saturdays per year, plus service on the day after
Saturday service days 53
Thanksgiving
OSU/LBCC Fall-Spring session
165 Based on 2018–19 academic calendar
days
OSU/LBCC Summer semester days 53 Based on 2019 Summer academic calendar
Based on Loop data. Speeds range from 17 to 30 miles per
Average operating speed 25 mph
hour (mph), average 25.7 mph
Revenue hour cost $105 2018–18 annual budget divided by annual revenue hours
Annual budget (2017–18) $500,000 2017–18 Loop operating budget (rounded)
Annual revenue hours (2017–18) 4,700 2017–18 Loop data (rounded)
Additional revenue from Oregon Estimated combined commitment from Benton and Linn
$600,000
STIF Counties ($300,000 each per year)
Total scenario planning budget $1,100,000 Existing annual budget + Additional STIF revenue
Nelson\Nygaard Consulting Associates, Inc. | 3-1Attachment B
LINN-BENTON LOOP SERVICE DEVELOPMENT PLAN | DRAFT PLAN
Oregon Cascades West Council of Governments
VISION
The Linn-Benton Loop in 2030 will continue to be a robust regional service connecting the
Albany and Corvallis areas, providing reliable service for residents, commuters, university
students, and people making intercity connections at Albany Station.
The 10-year Linn-Benton Loop vision is a regional transit service designed around three
coordinated routes:
The Regional Route will operate bi-directionally between Albany Station and
Downtown Corvallis/OSU via OR-99E and OR-34, with a stop at LBCC. On weekdays it
will operate for 16 hours per day from 6 am to 10:15 pm, with service every 75 minutes,
using one vehicle. On Saturdays, it will operate for 10 hours, from 8 am to 6 pm with
service every 90 minutes using one vehicle.
The Campus Connector service will operate bi-directionally between LBCC and
Downtown Corvallis/OSU via OR-34 on weekdays during OSU/LBCC academic term (i.e.,
no service during summer term or semester breaks). It will operate for 12 hours between
7 am and 7 pm. Buses will run every 60 minutes in the morning and afternoon, and every
30 minutes during the rest of the day. The 60-minute frequency will require one vehicle
to operate, and the 30-minute frequency will require two vehicles. The second vehicle will
be shared with the US-20 Commuter route, which runs only in the morning and
afternoon.
The US-20 Commuter service will operate bi-directionally between Albany Station and
Downtown Corvallis/OSU via US-20, HP and OR-99W. Service will operate on weekdays
with three bi-directional trips in the morning (6 am to 9 am) and three in the evening
(4:30 pm to 7:30 pm). This route will require one vehicle.
Figure 14 summarizes the routes, and identifies key operational characteristics. Figure 15
presents a map of the future system on weekdays, and Figure 16 shows Saturday service.
Figure 14 Regional Transit Vision Routes
Time of Frequency
Route Service Days Year Hours of Service (min) Vehicles[A]
Monday-Friday All year 6 am – 10:15 pm 75
Regional Route 1
Saturday All year 8 am – 6 pm 90
6:00 – 9:00 am
US-20 Commuter Monday-Friday All year 60
4:30 – 7:30 pm 1[B]
OSU/LBCC Midday: 9:30 am – 4 pm 30
Campus Connector Monday-Friday academic
term 7 AM/PM: 7 – 9:30 am & 4 – 7 pm 60 1
Notes:
[A] Number of vehicles does not include spare vehicles necessary to support bus services.
[B] Preliminary analysis suggests one vehicle could serve both the morning and afternoon Commuter route, and the mid-day Campus Connector;
Campus Connector at 30 minute frequencies will require two vehicles.
7 Fall, Winter and Spring terms only
Nelson\Nygaard Consulting Associates, Inc. | 3-2Attachment B
LINN-BENTON LOOP SERVICE DEVELOPMENT PLAN | DRAFT PLAN
Oregon Cascades West Council of Governments
Notable changes from the existing Loop service include:
Transforming the loop-based system to three independent bi-directional
routes. This allows the headways and service hours for each route to be scaled
independently to accommodate demand within its service area. The bi-directional service
design also makes the service easier to understand, which makes it easier for people to
plan their trip and catch the bus.
Extended evening service on weekdays until 10:15 pm between Albany Station,
LBCC and Corvallis. Later service will accommodate student travel markets, and non-
traditional employment schedules.
Direct midday service between Corvallis and Albany Stations (via OR-34, LBCC
and OR-99E). Passengers will no longer need to transfer to ATS at LBCC to travel
between the region’s two major transit centers during the midday.
Realignment of service in Corvallis off of 9th Street onto OR-99W to reduce
travel times between Downtown Corvallis/OSU and North Albany. Service along 9th
Street will continue to be provided by CTS (all day Monday through Saturday).
Reduce Saturday service to North Albany (on US-20) and 9th Street in Corvallis.
Saturday service will operate bi-directionally along OR-34 and OR-99E to provide
consistency with weekday Regional Route service. To maintain service to Heritage Plaza
in Albany, Saturday service frequency will operate consistently every 90 minutes.
The Campus Connector will supplement the Regional Route with more trips
and increased capacity between OSU and LBCC during the Fall, Winter and Spring
academic terms. Service will operate at least hourly. In Phase 3 service will increase to
every 30 minutes during most of the day.
Nelson\Nygaard Consulting Associates, Inc. | 3-3Attachment B
LINN-BENTON LOOP SERVICE DEVELOPMENT PLAN | DRAFT PLAN
Oregon Cascades West Council of Governments
Figure 15 Regional Transit Vision Map (Weekdays)
Nelson\Nygaard Consulting Associates, Inc. | 3-4Attachment B
LINN-BENTON LOOP SERVICE DEVELOPMENT PLAN | DRAFT PLAN
Oregon Cascades West Council of Governments
Figure 16 Regional Transit Vision Map (Saturdays)
Nelson\Nygaard Consulting Associates, Inc. | 3-5Attachment B
LINN-BENTON LOOP SERVICE DEVELOPMENT PLAN | DRAFT PLAN
Oregon Cascades West Council of Governments
PHASING
The vision will be implemented over 10 years in three phases. Service data are summarized in
Figure 17 and described in more detail below.
Figure 17 Phasing Summary
Service Details Existing Phase 1 Phase 2 Phase 3
Nov 2019 – Dec 2020 Jan 2021 – Jun 2022 Jul 2022 - ongoing
Loops
Frequency (min) 75 no change - -
Days of service Monday-Friday - -
no change
and Saturday
Weekdays:
6:30 – 10 am /
Span 3 – 7 pm no change - -
Saturdays:
8 am – 6 pm
Vehicles 1 no change - -
Express and Midday
Frequency (min) 60-75 no change - -
Days of service Monday-Friday no change - -
Span 6:40 am – 5 pm 6:40 am – 9 pm - -
Vehicles 1 no change - -
Regional Route
Frequency (min) - - 75 (90 on Saturday) no change
Days of service - - Monday-Friday and Saturday no change
Weekdays: 6 am – 10:15 pm
Span - - no change
Saturdays: 8 am – 6 pm
Vehicles - - 1 no change
Campus Connector (during OSU/LBCC academic terms only)
Frequency (min) - - 60 30 during midday
Days of service - - Monday-Friday no change
Span - - 7 am – 7 pm no change
Vehicles - - 1 + 1 (shared with US-20 Commuter)
US-20 Commuter
Frequency (min) - - 60 no change
Days of service - - Monday-Friday no change
Span - - 6 – 9 am; 4:30 – 7:30 pm no change
Vehicles - - 1 Bus shared with Campus Connector
Nelson\Nygaard Consulting Associates, Inc. | 3-6Attachment B
LINN-BENTON LOOP SERVICE DEVELOPMENT PLAN | DRAFT PLAN
Oregon Cascades West Council of Governments
Phase 1 (November 2019 – December 2020)
The first phase of the Linn-Benton Loop service enhancement will continue the current operating
pattern of service with the AM/PM Loops, Midday and Express services. However, service will be
extended later in the day on the Afternoon Express to provide service for LBCC students who
attend evening and night classes. Service will begin directly after STIF funds are disbursed in
November 2019.
This change will not require any additional vehicles. However, the Loop will procure two vehicles
during Phase 1 to support Phase 2 service enhancements, given that transit vehicles can take up to
18 months to receive.
The following are the specific tasks within this phase:
Extend Afternoon Express by four hours to provide bi-directional service between LBCC
and Downtown Corvallis every hour (i.e., extend end of service from 5 pm to 9 pm).
Purchase two 40-foot buses to expand the Loop fleet to four vehicles. 8 The new vehicles
are expected to take 12-18 months to manufacture and deliver.
In coordination with ATS and CTS, identify potential bus stop improvements, including
new shelters, seating, lighting, and bus stop signage. Prioritize improvements at the
busiest stops and where service will continue to operate in Phase 2 and Phase 3.
Develop an outreach and marketing strategy to educate existing and potential riders on
service changes in future phases including improved frequency and the new route
structure.
A brand “refresh” in Phase 2 could highlight the service changes. For example, the “Loop”
name may not fit the new service design – although this should be tested with riders.
Consider allocating funds into a reserve to support later capital purchases, or to cover
unforeseen operations and maintenance expenses.
Phase 2 (January 2021 – June 2022)
Phase 2 will restructure the Linn-Benton Loop system into three coordinated routes in January
2021. The date may change based on vehicle delivery timelines and/or coordination with changes
to CTS and ATS services.
Phase 2 maintains service at most locations where the Loop operates today. The frequency, span,
and direction of service will change depending on location and time of day. This restructuring will
allow service levels to be more easily adjusted without disrupting the entire network. The three
routes are the Regional Route, Campus Connector and US-20 Commuter.
Like in Phase 1, Phase 2 includes funds for marketing, bus stops, and planning/coordination.
Phase 2 includes $110,000 annually in reserve funds to purchase a new vehicle every four years,
consistent with the Albany Transit (dba Linn-Benton Loop) vehicle useful life benchmark (12
years for heavy duty buses).
8 The Loop’s 2010 ElDorado vehicle will be retired in 2022 (the 2014 and 2017 Gillig buses will continue to operate).
The net result will be four total vehicles. Three vehicles will be needed to operate Phases 2 and 3. The fourth vehicle will
serve as a spare. In practice, in-service vehicles would be rotated to balance service across the Loop fleet.
Nelson\Nygaard Consulting Associates, Inc. | 3-7Attachment B
LINN-BENTON LOOP SERVICE DEVELOPMENT PLAN | DRAFT PLAN
Oregon Cascades West Council of Governments
Phase 3 (July 2022 – ongoing)
Phase 3 will enhance the service established in Phase 2, with the Regional Route and US-20
Commuter continuing to operate as in Phase 2. The Campus Connector will increase service
frequency from every 60 to 30 minutes between 9:30 am and 4 pm. This is when Loop vehicles
are most full today.
The Campus Connector hourly service will remain unchanged from 7 am to 9:30 am, and from 4
pm to 7 pm. The route will operate when OSU and LBCC classes are in session, but not during
semester breaks, including winter, spring and summer breaks. The vehicle for this 30-minute
service will also serve the US-20 Commuter route.
Phase 3 includes funds for ongoing planning/coordination and marketing. Although planned for
implementation in July 2022, Phase 3 may be implemented earlier or later based on agency
capacity.
FINANCIAL PLAN
Figure 18 provides the financial details of the Enhancement Plan, including the source of funds
for operations, vehicles, and bus stops and the expected available budget. The financial plan
includes $600,000 in new revenue annually from the STIF Formula Fund.
Each phase fits within this budget. The amount assumes $300,000 each from Linn and Benton
Counties, which are the STIF Qualified Entities receiving STIF funds and responsible for
developing and submitting the STIF Plans.
Regional stakeholders may consider other funding sources, such as:
Employer payroll tax
Gasoline tax
Transit district property tax
Local option sales tax
Motor vehicle registration fee
Utility fee
Public-private partnerships
Any new funding options will require further analysis to determine consistency with local and
state laws, effectiveness, and expected ongoing revenue potential. For more information on these
options, see Technical Memorandum #2.
Nelson\Nygaard Consulting Associates, Inc. | 3-8Attachment B
LINN-BENTON LOOP SERVICE DEVELOPMENT PLAN | DRAFT PLAN
Oregon Cascades West Council of Governments
Figure 18 Expenditure Details (Fiscal Year Ending)
Fund 2019 2020 2021 2022 2023 2024 2025 2026 2027 2028 2029
Existing Phase 1 Phase 1 / 2 Phase 2 Phase 3 Phase 3 Phase 3 Phase 3 Phase 3 Phase 3 Phase 3
Task 1: Operations
STIF Formula - $47,000 $212,000 $352,000 $465,000 $465,000 $465,000 $465,000 $465,000 $465,000 $465,000
Federal $241,000 $241,000 $241,000 $241,000 $241,000 $241,000 $241,000 $241,000 $241,000 $241,000 $241,000
Other State $25,000 $25,000 $25,000 $25,000 $25,000 $25,000 $25,000 $25,000 $25,000 $25,000 $25,000
Local $166,000 $166,000 $166,000 $166,000 $166,000 $166,000 $166,000 $166,000 $166,000 $166,000 $166,000
Other $68,000 $68,000 $68,000 $68,000 $68,000 $68,000 $68,000 $68,000 $68,000 $68,000 $68,000
Subtotal $500,000 $547,000 $712,000 $852,000 $965,000 $965,000 $965,000 $965,000 $965,000 $965,000 $965,000
Task 2: Vehicles
STIF Formula[3] - - $528,000 $110,000 $110,000 $110,000 $110,000 $110,000 $110,000 $110,000 $110,000
Discretionary[1] - - $352,000 - - - - - - - -
Subtotal $0 $0 $880,000 $110,000 $110,000 $110,000 $110,000 $110,000 $110,000 $110,000 $110,000
Task 3: Planning, Bus Stops and Marketing
STIF Formula - $40,000 $50,000 $120,000 $25,000 $25,000 $25,000 $25,000 $25,000 $25,000 $25,000
Subtotal - $40,000 $50,000 $120,000 $25,000 $25,000 $25,000 $25,000 $25,000 $25,000 $25,000
EXPENDITURES $500,000 $587,000 $1,642,000 $1,082,000 $1,100,000 $1,100,000 $1,100,000 $1,100,000 $1,100,000 $1,100,000 $1,100,000
Total Revenue $500,000 $587,000 $1,642,000 $1,082,000 $1,100,000 $1,100,000 $1,100,000 $1,100,000 $1,100,000 $1,100,000 $1,100,000
Existing $500,000 $500,000 $500,000 $500,000 $500,000 $500,000 $500,000 $500,000 $500,000 $500,000 $500,000
STIF[2] - $87,000 $1,142,000 $582,000 $600,000 $600,000 $600,000 $600,000 $600,000 $600,000 $600,000
Note: All figures in constant 2018 dollars; it is assumed that both costs and revenues will increase with inflation over time. Vehicle match is typically 20% in both federal and STIF Discretionary programs, but can be as low as
10% for qualifying projects.
[1] Discretionary funds represent any non-STIF Formula revenue sources, whether from state, federal or other agencies.
[2] Includes STIF Formula and STIF Discretionary funds.
[3] FY 2021 STIF Formula funds include $440,000 for one vehicle, plus $88,000 in matching funds for a potential STIF Discretionary grant award, to fund another vehicle.
Nelson\Nygaard Consulting Associates, Inc. | 3-9Attachment B
LINN-BENTON LOOP SERVICE DEVELOPMENT PLAN | DRAFT PLAN
Oregon Cascades West Council of Governments
FUTURE CONSIDERATIONS
The funding amounts assumed in the phasing plan are estimates that could change in the future,
based on increases or decreases in employment, wages, and taxpayer compliance rates in both
Linn and Benton Counties. The lists below present an array of potential options for how to adjust
service plans based on funding levels. The two counties and the Linn-Benton Loop Governing
Board will need to work collaboratively to identify the service changes that make sense based on
available funding, regional priorities, and how far along the region is to achieving the regional
transit vision.
Additional funds available
If there are additional funds available, the following are potential options that could be
considered to expand service:
Invest in AVL technology to provide bus tracking and real-time arrival information to
passengers. Purchase real-time displays for busiest stops.
Extend the Campus Connector and/or Regional Route to the Benton Center in Corvallis
on weekdays.
Extend the Regional Route to Albany Heritage Mall on weekdays.
Extend the Regional Route to Albany WinCo on Saturdays (or all week – Monday through
Saturday).
Add extra trips on the US-20 Commuter (new midday trips or more frequent peak hour
service).
During academic terms, expand the hours of the day when the Campus Connector
operates every 30-minutes, rather than only between 9:30 am and 4 pm.
Use three buses on the Regional Route to provide 30-minute frequencies between Albany
and Corvallis. Eliminate the Campus Connector.
Add Sunday service.
Insufficient funds available
If there are insufficient funds to proceed with the next phase of the enhancement plan, the
priority should be to maintain service and defer additional enhancements until funding is
available. However, if funding levels drop below the level needed to sustain service, the following
should be considered:
Use local funds to provide stopgap funding (either public funds, or contributions from
local/regional intuitions and businesses).
Reduce frequency on the Campus Connector to every 60 minutes.
Eliminate the Campus Connector and provide service on OR-34 and OR-99E with the
Regional Route only.
Terminate US-20 Commuter in Corvallis at HP or 9th & Circle and ensure timed transfers
with CTS.
Eliminate or reduce frequency on the US-20 Commuter.
Nelson\Nygaard Consulting Associates, Inc. | 3-10Attachment B
LINN-BENTON LOOP SERVICE DEVELOPMENT PLAN | DRAFT PLAN
Oregon Cascades West Council of Governments
Eliminate or reduce service on the Regional Route between LBCC and Albany Station.
Ensure timed transfers to/from ATS at LBCC for people traveling between Corvallis and
Albany Station.
Eliminate Saturday service to Heritage Plaza.
CAPITAL, MARKETING AND OTHER SUPPORTIVE ELEMENTS
Successfully implementing the service improvements depends upon investments in capital
elements (including vehicles, bus stops, and real-time bus arrival infrastructure) as well as
marketing and planning efforts. These elements serve important functions in the transit system
by improving passenger comfort and convenience and enhancing the overall operation of the
system.
Vehicles
The vision requires the purchase of one additional vehicle for service (for a total of three buses)
and a second additional vehicle as a spare. The current active fleet includes one 35-foot bus and
one 40-foot bus. Due to high passenger loads, future vehicles should all be 40 feet in length to
ensure sufficient capacity and reduce likelihood of pass-ups. The plan also includes funding for a
new replacement vehicle every four years to maintain a state of good repair and ensure the system
is able to provide effective service. Each vehicle costs approximately $440,000, although grants
should be pursued to leverage local funds.
Planning, Bus Stops, Marketing and Other Supportive Elements
The elements outlined below are provided with the funding listed under Task 3 in Figure 18.
Specific line items are not identified for each element ; the Linn-Benton Loop and its regional
partners should adjust funding levels between these elements as needs or priorities are
determined.
Planning and Coordination
Loop operators and regional stakeholders should continually keep an eye toward future service
changes and trends in regional travel needs and travel demand, while also ensuring existing
services continue to provide efficient and reliable service to passengers. An effective transit
operator continually evaluates and monitors service to identify needs and make changes or
adjustments as issues arise. Additionally, transit service needs to be well coordinated with other
regional services to ensure effective outcomes for the region and the people who depend on the
services.
Bus stops
Transit trips require at least some time spent waiting at a bus stop. Bus stop amenities should be
provided at stops with the highest number of passenger boardings, with consideration for stops
likely to serve more people with disabilities or older adults. Amenities may include new shelters,
seating, lighting, and bus stop signage. A high-end shelter with a bench costs approximately
$20,000 (including the cost of installation). Large passenger information boards with maps and
schedule information cost approximately $750 each.
Real-time arrival information and displays
Provide real-time arrival information and displays, and coordinate implementation with other
regional service providers. Real-time arrival information helps passengers know when to expect
Nelson\Nygaard Consulting Associates, Inc. | 3-11You can also read