2016 City of Peterborough Residential Monitoring Report
←
→
Page content transcription
If your browser does not render page correctly, please read the page content below
2016
City of Peterborough
Residential Monitoring
Report

                         1
Executive Summary
This Report presents and analyzes residential development trends within the City of
Peterborough for 2016. It assesses whether the City has been meeting the development
targets and requirements outlined in provincial planning legislation.

The 2016 Census reports the City of Peterborough’s population as 81,032. According to
provincial estimates in the Growth Plan for the Greater Golden Horseshoe, the City is
forecast to grow to 103,000 residents by 2031 and to 115,000 residents by 2041. This
represents an average annual growth rate of 1.8% or 1,465 people from 2016 to 2031,
and 1.7% or 1,359 people annually from 2016 to 2041. The Peterborough Census
Metropolitan Area (CMA) is characterized by a large and expanding senior population.
Seniors (persons aged 65 and over) account for 22.2% of the population of the
Peterborough CMA; this places the CMA first in Ontario and second nationally1. This
proportion of the population has increased from 19.5% in 2011 and is forecast to
increase to 26% by 20412. Residents of the City of Peterborough have an average age
of 44 – the second highest in Ontario and fourth nationally.

Households in the City of Peterborough tend to have less income than both the
provincial and national averages. According to the 2016 Census, the City had a median
household income of $58,127, substantially lower than the median of $74,287 for
Ontario and $70,336 for Canada. Furthermore, Peterborough’s median family income
(before taxes) was $76,064, which was also less than the Ontario ($91,089) and
Canadian ($88,306) amounts.

Information from Canada Mortgage and Housing Corporation (CMHC) reports for 2016
suggests the average price of a resale house in the Peterborough CMA as $323,250; an
8.5% increase from the 2015 average of $297,848. Meanwhile, the average price of a
new single-detached home in the CMA was determined to be $299,742, down 10.9%
from $336,417 in 2015. In 2016, an estimated 3,070 houses were sold in the
Peterborough CMA. According to CMHC, the average market rent for the CMA was
$691 for bachelor units, $834 for one bedroom units, $980 for 2 bedroom units and
$1,208 for 3 or more bedroom units in 2016. The rental apartment vacancy rate for the
Peterborough CMA was 1.0%, a sharp drop from the 2015 rate of 3.7%. In 2016,
building permits were issued for 339 residential units which is an increase from 2015.

The Growth Plan for the Greater Golden Horseshoe , 2017 (“Growth Plan”) requires the
City to direct 40% of all new residential units to areas within its Delineated Built

1
 Ministry of Finance. 2012. 2011 Census Highlights.
https://www.fin.gov.on.ca/en/economy/demographics/census/cenhi16-3.html .
2
 Hemson Consulting Ltd. 2013. Greater Golden Horseshoe Growth Forecasts to 2041, Table 20.
Technical Report (November 2012) Addendum.

                                                                                              2
Boundary until the completion of the next Municipal Comprehensive Review (currently in
progress, and at the end of which the City will adopt a New Official Plan). In 2016, the
City met this target, with 49% of new residential development taking place within the
Built Boundary. Overall since 2007 the City has exceeded this target with an average
intensification rate of 47%. Despite this success, it is anticipated that this target will
become much more difficult to achieve in the future as the target increases to 50%
following the adoption of a New Official Plan and as existing vacant land within the
Delineated Built Boundary is developed. A greater focus on the redevelopment of
under-utilized buildings and sites will be required going forward.

The Growth Plan also requires the Downtown Peterborough Urban Growth Centre to be
planned to accommodate a density of 150 residents and jobs per hectare by 2031.
Since its density was estimated to be 105 residents and jobs per hectare in 2011, an
additional 4,500 residents and/or jobs will be needed by the year 2031. Further
emphasis on residential intensification and redevelopment in the downtown core is
required and can be achieved through the implementation of the Central Area Master
Plan and the Central Area Community Improvement Plan.

A further requirement of the Growth Plan is for the City’s Designated Greenfield Area to
be planned to achieve an average density of 50 residents and jobs combined per
hectare until the adoption of the new Official Plan. Afterwards, the target will increase to
80 residents and jobs combined per hectare. This will require the City’s new subdivision
developments to have fewer single-detached homes and a greater variety of housing
types. It is the City’s practice to adopt new Secondary Plans to help ensure that the
required target is achieved and this practice is expected to continue.

The Provincial Policy Statement (PPS) requires the City to maintain a minimum 3-year
supply of zoned residential land and a minimum 10-year supply of designated
residential land to accommodate its forecast population growth. In 2016, the City
achieved both of these requirements by having an 8.6 year supply of zoned land as well
as 16-year and 98-year supplies of designated residential land in the Delineated Built
Boundary and Designated Greenfield Area, respectively.

The PPS also requires the City to establish an affordable housing target. In 2009, the
City established a target for 10% of its new housing to be constructed as affordable.
Based on the PPS definition and formula for calculating ‘affordable’, in Peterborough,
the 2016 maximum affordable house price was $291,500. Since 2010, approximately
22% of all new residential units constructed in the City have met the PPS definition for
affordable.

Overall, the City of Peterborough is planning in accordance with provincial planning
objectives that aim to curb urban sprawl and create more compact, transit-supportive
and complete communities. However, a major challenge will be achieving the
intensification and density targets once greater emphasis on the redevelopment of
existing under-utilized land and buildings is required, whilst maintaining housing
affordability.

                                                                                           3
Table of Contents
Executive Summary                                             2
Table of Contents                                             4
1.0     Introduction                                          5
2.0     Population, Household, and Economic Characteristics   5
  2.1     Population Growth                                   6
  2.2     Demographics                                        7
  2.3     Average Household Size                              9
  2.4     Post-Secondary Students                             11
  2.5     Median Household Income                             11
  2.6     Unemployment Rate                                   12
  2.7     Commuting Patterns                                  13
3.0     Growth Plan for the Greater Golden Horseshoe          14
  3.1     Overview                                            14
  3.2     Growth Plan Development Target Monitoring           15
      3.2.1   Built Boundary (BB)                             19
      3.2.2   Urban Growth Centre (UGC)                       20
      3.2.3   Designated Greenfield Area (DGA)                21
4.0     Residential Land Supply                               22
  4.1     Short-Term (3-Year) Residential Land Supply         22
  4.2     Long-Term (10-Year) Residential Land Supply         23
5.0     Residential Building Activity                         25
6.0     Housing Market Trends                                 26
  6.1     Housing Starts                                      26
  6.2     Residential Sales Activity                          27
  6.3     Apartment Vacancy Rates                             29
  6.4     Average Market Rents                                30
  6.5     Average New and Resale House Prices                 32
7.0     Affordable Housing And Social Housing                 32
  7.1     Affordable Housing                                  32
      7.1.1   Affordable Housing Target Monitoring            33
  7.2     Social Housing                                      36
8.0     Conclusion                                            37

                                                               4
1.0 Introduction
This report has been prepared in the context of the Growth Plan for the Greater Golden
Horseshoe 2017, a provincial planning strategy that manages growth in the Greater
Golden Horseshoe (“GGH”) region. The City of Peterborough is included in this region.
Through its overall vision and policy framework requiring growth to occur in a more
compact and complete way, the Growth Plan controls where and how new residential
development occurs. It does this by establishing mandatory development targets for
municipalities to implement while also requiring municipalities to establish affordable
housing targets as a way to help ensure that the housing needs of all residents are met.
The Growth Plan requires municipalities to monitor and report on the Plan’s
implementation to help ensure that growth occurs in accordance with its policy
directions. This requirement is further reflected in the City of Peterborough Official Plan,
which calls for the City to develop an annual Residential Monitoring Report.
The purpose of the Residential Monitoring Report is to present and analyze residential
development trends within the City of Peterborough during 2016 and to assess whether
the City has been meeting its targets and requirements outlined in provincial planning
legislation. The specific purpose and objectives of this report are to:
Provide an overview of the major population, household, and economic
characteristics that shape the local demand for housing;
Highlight trends in the local housing market; and,
Assess whether the City is achieving its Official Plan policies that pertain to:
o Meeting the Growth Plan’s mandated development targets;
o Maintaining an adequate supply of residential land as required by the
PPS; and
o Meeting affordable housing targets.
2.0 Population, Household, and Economic Characteristics
This section provides a brief overview of the major population, household, and
economic characteristics that shape the demand for housing in the City of
Peterborough. This information is based on data primarily from the 2016 Census which
is a survey of the Canadian population undertaken every 5 years by the Government of
Canada. This information has been supplemented with more recent data from Statistics
Canada or other sources wherever possible, such as reports from the Canada Mortgage
and Housing Corporation (CMHC).
5In 2011, the mandatory long-form Census was replaced with the voluntary ‘National
Household Survey’ (NHS). Sampling measures and response rates between the
Census and NHS vary. Consequently, data captured through the NHS may not provide
the most accurate representation of demographics in this community.
In years prior to 2011, and as of 2016, the City’s Residential Monitoring Report relied,
and will continue to rely, heavily on data from the long form Census. For this report,
however, demographic data from the 2011 NHS is still used. Readers of this report
should note that the demographic characteristics described herein may not be an
accurate snapshot of Peterborough’s demographic situation in 2011. Furthermore,
readers should exercise caution when drawing conclusions from data trends that are
derived Census and NHS data.
2.1 Population Growth
According to the 2016 Census, the City of Peterborough had a population of 81,032 in
2016. This represented an increase of about 12,650 people from 1991. Over the last
20 years, the City has grown at an increasingly higher rate during each census period
with the exception of the latest period between 2011 and 2016. Peterborough grew by
2.7 % from 1996 to 2001 compared to 5.1% from 2006 to 2011. Between 2011 and
2016, this growth rate was only 2.9% however.
The Growth Plan contains population forecasts that municipalities in the GGH must
adopt into their Official Plans and use when planning for future growth. In 2013,
Schedule 3 of the Growth Plan was amended to update and extend the employment
and population forecasts to 2041 and these numbers have been carried forward into the
current Growth Plan, in force and effect since July 1, 2017.
The updated forecast indicates that between 2031 and 2041, the City of Peterborough
is expected to grow from 103,000 to 115,000 residents, and that in 2031, the City will
have a population of 103,000, as opposed to 88,000 as forecast in the 2006 version of
the Growth Plan. The same population forecast has been incorporated into the 2017
Growth Plan which is in force and effect as of July 1, 2017. Figure 1 displays the
previous and amended forecast scenarios, along with the actual population.
The forecasted growth represents an 11.7% increase in population over a ten year
period, or approximately 1,200 people per year or 5213 new residential units per year.
To compare this with actual population change observed in the City, between 2006 and
2016, the City grew from 74,898 to 81,032 residents. This represents a growth rate of
8.2% increase over a ten-year period, an average additional 613 people per year or
approximately 2673 new residential units per year.
3
Based on 2.3 persons per household as per Table 4 of this report.
6140,000
120,000
100,000
80,000
60,000
40,000
20,000
0
1991 1996 2001 2006 2011 2016 2021* 2026* 2031* 2036* 2041*
Actual GGH Sched. 3, 2006 GGH Sched 3, 2013
Figure 1 - Population of the City of Peterborough: Actual from 1991 to 2016 and Forecast to 2041.
* Represents a growth forecast
(Source: 1991-2016 Censuses, Growth Plan for the GGH 2006 Schedule 3 and Growth Plan for the GGH
– 2013 Schedule 3)
The City of Peterborough is required to review its Official Plan to conform to the
projections in the amended Schedule 3 of the Growth Plan. The City is currently in the
process of developing a New Official Plan that will reflect the revised population and
employment figures from the current Growth Plan. Current trends show the City
generally matching the population forecasts in the original Growth Plan adopted in
2006, however.
2.2 Demographics
The City of Peterborough has a population that is older than the provincial average.
According to the 2016 Census, the City’s average age is 43.5, whereas the provincial
average is 41.0 (Table 1). Seniors comprise a larger proportion of the City’s population
(22%) than they do for the province as a whole (17%) (Figure 2).
7The Peterborough Census Metropolitan Area (CMA)4 – which includes the City of
Peterborough as well as the 4 neighbouring Townships of Cavan-Monaghan, Otonabee-
South Monaghan, Douro-Dummer, Selwyn, as well Hiawatha and Curve Lake First
Nations –previously had the highest median age amongst Ontario CMAs. As of the
2016 Census, it has dropped to the second highest average age amongst CMA’s in
Ontario and fourth in Canada. In 2016, it closely followed Trois-Rivieres in Quebec, St.
Catharines-Niagara in Ontario, and Victoria in British Columbia. Previously, the
Peterborough CMA had the largest proportion of seniors of all CMA’s in Canada but it
has been surpassed by Trois-Rivieres CMA, Quebec. Despite being surpassed, the
proportion of seniors in Peterborough has grown from 19.5% in 2011 to 22.2% in 2016.
With the forecasted growth of seniors aged 65 and older reaching 25% of the City’s
population by 2041 (Hemson Consulting Ltd., 2013) (Figure 3), the City needs to ensure
its housing production adequately meets the needs of seniors, which may include
smaller unit sizes and housing with support services that enable seniors to ‘age-in-
place’.
Table 1 – Average Age of Peterborough (City and CMA) and Ontario Residents
(Source: Statistics Canada, 2016 Census of Population, Statistics Canada Catalogue nos. 98-400-
X2016001 and 98-400-X2016002)
Average Age (2011) Average Age(2016)
Geographic Area
Ontario 39.9
41.0
City of Peterborough 42.6
43.5
Peterborough CMA 42.9 44.0
Table 2 -Top 5 CMA’s in Canada by Average Age
(Source: Statistics Canada, 2016 Census of Population, Statistics Canada Catalogue nos. 98-400-
X2016001)
CMA Average Age
Trois Rivieres 44.4
St. Catharines-Niagara 44.1
Victoria 44.1
Peterborough 44.0
Kelowna 44.0
Table 3 - Top 5 CMAs in Canada by Percentage of Population as Seniors, 2016
(Source: Statistics Canada, 2016 Census of Population, Statistics Canada Catalogue nos. 98-400-
X2016001)
CMA % Population as Seniors
Trois Rivieres 22.3%
Peterborough 22.2%
St. Catharines-Niagara 21.8%
Kelowna 21.4%
Victoria 21.2%
4
Note that the Peterborough CMA excludes four Peterborough County Municipalities: Trent Lakes,
Asphodel-Norwood, North Kawartha and Havelock-Belmont-Methuen.
8Ontario City of Peterborough
30%
25%
% of Population
20%
15%
10%
5%
0%
0-14 15-29 30-44 45-64 65+
Figure 2 - Percentage of 2016 Population by Age Group Ontario and City of Peterborough
Comparison
(Source: 2016 Census)
2011 2016 2041
35%
30%
25%
% of Population
20%
15%
10%
5%
0%
0-14 15-29 30-44 45-64 65+
Age Group
Figure 3 - Percentage of City of Peterborough Population by Age Group: 2011, 2016 Censuses and
2031 Forecast
(Source: 2011 Census, 2016 Census and Hemson Consulting Ltd., 2013)
2.3 Average Household Size
The City of Peterborough’s average household size (2.3) is smaller than the provincial
average (2.6) (Table 4). This characteristic is evidenced by the greater proportion of 1
9and 2-person households found in the City compared to the provincial average (Figure
4). Although the City’s average household size remains unchanged from the 2006
census, the multi-year trend shown in Figure 5 shows continued decrease in the City’s
average household size.
Table 4 – Average Private Household Size: City of Peterborough vs. Provincial Average
(Source: 2011 Census, 2016 Census)
CMA Average Household Size Average Household Size
2011 2016
Ontario 2.6 2.6
Peterborough 2.3 2.3
Ontario City of Peterborough
40%
% of Households
30%
20%
10%
0%
1-Person 2-Person 3-Person 4-Person 5+ Persons
Household Size
Figure 4 - Percentage of Private Households by Size: 2016
(Source: 2016 Census)
Ontario City of Peterborough
3.0
# of People Per Household
2.8
2.6
2.4
2.2
2.0
1981 1986 1991 1996 2001 2006 2011 2016
Year
Figure 5 - Average Private Household Size: 1981 to 2011
(Source: 2006 Census, 2011 Census, and 2016 Census)
102.4 Post-Secondary Students
The combined total full-time enrollment at the Peterborough campus Trent University
and Sir Sanford Fleming College is about 12,000 students. It has been estimated that
this enrollment creates an off-campus demand for approximately 4,000 rental housing
units5. This demand creates a highly competitive rental market in Peterborough that
attempts to meet the needs of both temporary post-secondary students as well as
permanent residents. Since 2011, 123 three and four-bedroom apartment units have
been constructed in a private student residence adjacent to Trent University. In 2013,
the Seneca College School of Aviation opened – introducing 140 additional students to
Peterborough’s housing market.
2.5 Median Household Income
Households in the City of Peterborough tend to have a lower income than the provincial
and national median. This trend is demonstrated in the 2006 Census, the 2011 NHS as
well as 2013 Taxfiler data. According to the 2016 Census, the City had a median
household income of $58,127 (Figure 6). Previous editions of this report used 2013
Taxfiler data which showed a Median Total Income per Family of $68,930. According to
the 2016 Census, the Median Total (before tax) Income for Economic Families rose to
$76,064 in 2015. Comparatively, in Ontario the Median Total Income for Economic
Families was $91,089 while in all of Canada it was $88,306.
Median Household Income in 2006, 2011,
and 2016
$80,000 $61,072 $70,336 $66,358 $74,287
$60,455 $58,127
$60,000 $53,634 $52,883
$48,213
$40,000
$20,000
$-
Canada Ontario City of Peterborough
2006 2011 2016
Figure 6 - Median Household Income 2006, 2011, and 2016.
(Source: 2006 and 2016 Census, 2011 NHS)
5
Tim Welch Consulting, Greg Suttor Consulting and Deb Ballak. 2013. Housing and Homelessness
Needs Assessment: Peterborough City and County. P. 45.
11In past census years, the Peterborough CMA has observed a high percentage of renter
households spending more than 30% of their income on rent, often ranking in the top
three CMAs in Canada. According to the 2011 NHS, 48.1% of renter households spent
30% or more on their shelter costs. Though the 2016 Census has concluded, data
products for housing have not been released when this report was being prepared.
Although Peterborough did not rank within the top 5 unaffordable CMAs as measured
for renter households, there was a high non-response rate to the voluntary NHS,
therefore it is possible that qualifying households were not properly represented in the
data. Regardless of the City’s placement nationally, Peterborough residents continue to
need affordable units, with almost half of renter households spending 30% or more of
their income on shelter costs.
In the past, CMHC has used 2013 Income Data and housing indicators to assess the
percentage of households in Core Housing Need. At the time of writing this report,
information for 2016 was not yet available. Until updated information is available this
existing information will need to be relied on. Households in Core Housing Need
include those households whose housing is not adequate, suitable or affordable, and
households that would need to spend 30% or more of their before tax income to pay the
median rent of alternative housing that is acceptable (is adequate, affordable and
suitable for the household). Based on that data, Peterborough had the highest
percentage of residents in Core Housing Need – at 20.7 % – among Canada’s 33
CMAs.
2.6 Unemployment Rate
The economic conditions of a community directly influence the demand for housing. In
2016, the City of Peterborough had an unemployment rate of 7.2%, a decrease from
7.7% in 2015. Figure 7 shows the trend in unemployment rates for the Peterborough
CMA as well as Ontario since 2001. Overall, the unemployment rate in both
Peterborough and Ontario as a whole is decreasing, though Peterborough has a higher
unemployment rate than Ontario.
12Peterborough CMA Ontario
12.0
10.0
8.0
6.0
4.0
2.0
0.0
2001 2002 2003 2004 2005 2006 2007 2008 2009 2010 2011 2012 2013 2014 2015 2016
Peterborough CMA 8.5 6.5 4.2 5.7 7.0 6.1 5.6 6.1 7.5 9.7 9.4 8.2 8.6 8.2 7.7 7.2
Ontario 6.3 7.1 6.9 6.8 6.6 6.3 6.4 6.5 9.0 8.7 7.8 7.8 7.5 7.3 6.8 6.5
Figure 7 - Unemployment Rate Trend Comparison for Peterborough CMA and Ontario 2001-2016
(Source: CMHC Housing Market Outlook Peterborough CMA Spring 2014, CMHC Housing Market
Outlook Canada Edition First Quarter 2015 and CANSIM Table 282-0122)
2.7 Commuting Patterns
In some communities there is a strong demand for housing from people who live in the
community but commute elsewhere for work. This does not appear to be the case in
Peterborough where according to the 2011 NHS, 83% of all City residents with a ‘usual
place of work’ worked in the City (Table 5). This means that about 4,995 residents
commuted out of the City for work. This indicates that the City generally does not
function as a ‘bedroom community’ to the extent that some other communities may. This
trend has been maintained from the 2006 Census. While the 2016 Census will provide
updated information on this topic the data has not been published at the time of this
report.
Table 5 - Place of Work Status of City of Peterborough Residents
(Source: 2011 NHS Statistics Canada Catalogue no. 99-012-X2011032, 2006 Census)
Place of Work 2011 2006
# % # %
Worked in City 24,090 83% 23,990 80%
Worked in County 2,400 8% 2,295 8%
Worked outside City/County 2,595 9% 3,505 12%
Table 6 further shows that more than twice as many people entered into the City of
Peterborough for work than left it in 2006 and 2011. Specifically, 4,995 people
13commuted out of the City for work whereas 13,050 people commuted to the City for
employment. These numbers suggest that although there will continue to be a demand
for housing for those commuting out of the City for work, this demand is not as strong as
some might think since the majority of the City’s residents actually work within the City.
Table 6 - Commuters Entering and Leaving City of Peterborough
(Source: 2011 NHS Statistics Canada Catalogue no. 99-012-X2011032, 2006 Census Commuting Flow
Data)
2011 2006
Commuters Leaving City 4,995 5,800
Commuters Entering City 13,050 14,775
3.0 Growth Plan for the Greater Golden Horseshoe, 2017
3.1 Overview
The Growth Plan for the Greater Golden Horseshoe is a provincial plan that originally
came into effect in 2006 to guide the growth of the GGH to the year 2031 and has been
amended to provide updated forecasts to 2041. As of July 1, 2017 an updated Growth
Plan is in force and effect. With a vision to building stronger, more prosperous and
complete communities, the Growth Plan guides municipal and provincial decisions on a
wide range of issues that include transportation, infrastructure planning, land use
planning, urban form, housing, natural heritage, and resource protection. The Growth
Plan intends to achieve this overall vision through specific policy directions that aim to:
Revitalize downtowns to become vibrant and convenient centres;
Create complete communities that offer more options for living, working,
shopping, and playing;
Provide greater choice in housing to meet the needs of people at all stages in
life;
Curb urban sprawl and protect farmlands and greenspaces; and
Reduce traffic gridlock by improving access to a greater range of transportation
choices.
The Growth Plan places considerable emphasis on creating a more ‘compact built form’
through the creation of more ‘complete communities’ and by having a significant amount
of growth occur through ‘intensification.’ These terms are defined as follows:
Compact urban form
A land-use pattern that encourages efficient use of land, walkable
neighbourhoods, mixed land uses (residential, retail, workplace and
institutional) all within one neighbourhood, proximity to transit and reduced
need for infrastructure. Compact built form can include detached and
semi-detached houses on small lots as well as townhouses and walk-up
14apartments, multi-storey commercial developments, and apartments or
offices above retail. Walkable neighbourhoods can be characterized by
roads laid out in a well-connected network, destination that are easily
accessible by transit and active transportation, sidewalks with minimal
interruptions for vehicle access, and a pedestrian-friendly environment
along roads to encourage active transportation.
Complete communities
Places such as mixed-use neighbourhoods or other areas within cities,
towns, and settlement areas that offer and support opportunities for
people of all ages and abilities to conveniently access most of the
necessities for daily living, including an appropriate mix of jobs, local
stores, and services, a full range of housing, transportation options and
public service facilities. Complete communities are age-friendly and may
take different shapes and forms appropriate to their contexts.
Intensification
The development of a property, site or area at a higher density than
currently exists through:
a) redevelopment, including the reuse of brownfield sites;
b) the development of vacant and/or underutilized lots within
previously developed areas;
c) infill development; and
d) the expansion or conversion of existing buildings.
(Source: Growth Plan for the Greater Golden Horseshoe, 2017)
3.2 Growth Plan Development Target Monitoring
The Growth Plan contains development targets that municipalities in the GGH must
adopt into their Official Plans and plan to achieve. These targets represent only a
portion of the Growth Plan’s requirements that municipalities are expected to
implement. However, these targets are central to the Plan’s strategy for creating a more
compact urban form that maximizes the use of new and existing infrastructure.
Specifically, the City of Peterborough is required to implement the following
development targets:
To direct at least 40% of all annual residential development to the Designated
Built-up Area, and to increase this target to 50% upon the approval of the next
Municipal Comprehensive Review;
To plan to achieve an average density of 150 residents and jobs per hectare in
the Downtown Peterborough Urban Growth Centre by 2031; and,
15 To plan to achieve an average density of 50 residents and jobs per hectare
across City’s entire Designated Greenfield Area until the next Municipal
Comprehensive Review, at which point the target will become 80 residents and
jobs per hectare.
Following the repeal of the previous Growth Plan (adopted in 2006) and the adoption of
a new Growth Plan in 2017 the City of Peterborough has begun the process of
conducting a Municipal Comprehensive Review to adopt a New Official Plan. This New
Official Plan will conform to the policies of the new Growth Plan and require new
development to meet the prescribed intensification targets. At this time, it is expected
that studies and planning strategies (e.g. secondary plans, intensification studies, a
housing strategy, community improvement plans, etc.) will continue to be utilized to
guide the New Official Plan and future development. In this report, references to
adoption of a “New Official Plan” should be read as the completion of a “Municipal
Comprehensive Review”.
16Figure 8 - Schedule A-1 City of Peterborough Structure
(Source: City of Peterborough Official Plan)
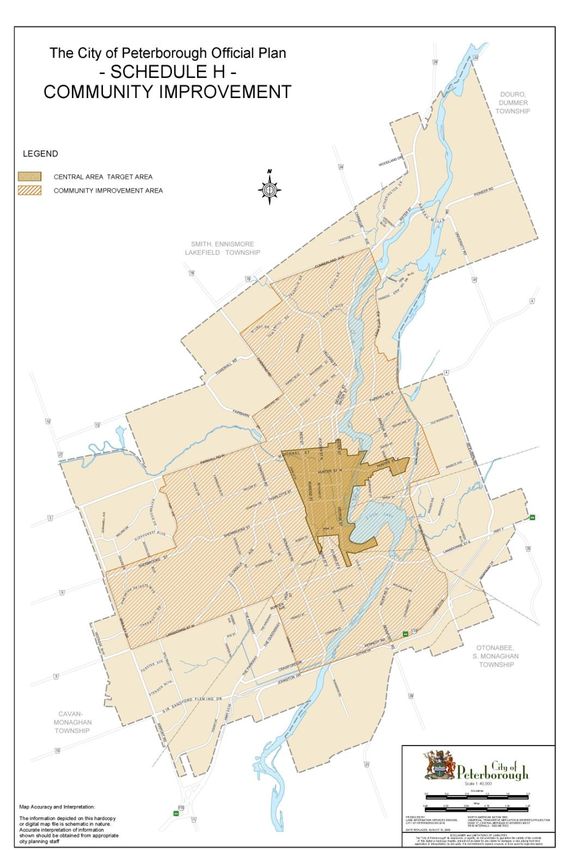
17Figure 9 – Schedule H of the City of Peterborough’s Official Plan – Community Improvement
Areas. (Source: City of Peterborough Official Plan)
183.2.1 Delineated Built Boundary (DBB)
The Delineated Built Boundary of the City of Peterborough includes the area of the City
that was either developed or approved for development prior to the Growth Plan taking
effect in June 2006. The Growth Plan requires 40 percent of all annual residential
development in the City to be located within the Delineated Built Boundary until the
adoption of the New Official Plan at which point the target will increase to 50 percent
(with a further increase to 60 percent in 2031 and thereafter). This residential
development is measured in terms of all residential units being created annually.
Therefore, should the City create 400 residential units in a year, at least 160 must be
built within the DBB (200 as of adoption of the New Official Plan and 240 from 2031
onwards). This policy applies to all upper and single-tier municipalities within the GGH
and is intended to reduce the outward growth of urban areas.
The City’s Official Plan describes the City’s intent to direct a large proportion of its
intensification to the downtown core as well as to designated intensification
corridors/areas (illustrated on Figure 8, OP Schedule A-1). The Official Plan further
directs the City to prepare secondary plans to guide the growth of each of its designated
intensification corridors and to utilize annual reports of residential development to
monitor and enforce the minimum 40% intensification target.
In 2015, the 40% intensification target became mandatory and the observed
intensification rate was just above the 40% target – sitting at 42%. The City has
achieved an overall intensification rate of 47% since 2007 (Table 7). This rate of
intensification has been largely achieved within the Built Boundary during this time
because of the construction of a large number of retirement home units, student
residence units on Water Street near Trent University, approximately 150 affordable
housing units through the Canada-Ontario Affordable Housing Program and a
substantial number of condominium units in several large developments.
Table 7 - Intensification Rate in the City of Peterborough: 2007-2016
(Source: City of Peterborough Planning Division, City’s building permit database)
Year of Building Units Units Inside Units Outside Intensification Rate (% of Units
Permit Issuance Built Boundary Built Boundary Created in Built Boundary)
2007 646 441 205 68%
2008 358 147 211 41%
2009 374 107 267 29%
2010 288 67 221 23%
2011 291 99 192 34%
2012 305 141 164 46%
2013 428 205 223 48%
2014 379 231 148 61%
2015 287 120 167 42%
2016 339 166 173 49%
Total 3695 1724 1971
Average 373 172 197
Percentage 47% 53%
1980%
60% 68%
61%
Intensification Target 40%
48% 49%
40% 46%
41% 42%
34%
20% 29%
23%
0%
2007 2008 2009 2010 2011 2012 2013 2014 2015 2016
Figure 10 - Percentage (%) of Residential Units Created Within Built Boundary: 2007-2016
compared with Intensification Target of 40%
(Source: City of Peterborough Planning Division, City’s building permit database)
3.2.2 Urban Growth Centre (UGC)
A portion of downtown Peterborough (the area generally bounded by McDonnel Street
to the north, Bethune Street to the west, Perry Street to the south, and the Otonabee
River to the east) is one of 25 designated Urban Growth Centres in the Greater Golden
Horseshoe. The Growth Plan requires these UGCs to be planned to accommodate a
significant share of the region’s population and employment growth to 2031.
Specifically, the Downtown Peterborough UGC must be planned to achieve an average
density of 150 residents and jobs combined per hectare by 2031 or earlier. The density
of the Downtown Peterborough UGC was estimated to be 116 residents and jobs per
hectare in 2006 and was recently updated to 105 residents and jobs per hectare in
20116. Achievement of this target will mean adding about 4,500 residents and jobs
within this area. This target is meant to achieve greater densities that make better use
of new and existing infrastructure.
In 2009, the City adopted the Central Area Master Plan (OPA #140) to guide the growth
of downtown. This Master Plan includes 22 strategies that are intended to focus growth
on the downtown at a scale that facilitates Growth Plan implementation.
Since 2000, building permits have been issued for the creation of 265 residential units in
the Downtown Peterborough UGC (Table 8). The majority of these units however were
6
Technical Report on Preliminary Performance Indicators for the Growth Plan for the Greater Golden
Horseshoe, 2006. Ministry of Municipal Affairs and Housing.
20created in two larger developments - the conversion of the former post office building on
Charlotte Street to 91 apartment units and the conversion of the former Central School
on Murray Street to 50 apartment units. Outside of these two developments, residential
units have been typically created through smaller-scale conversion projects. To achieve
the Growth Plan density target, more large-scale developments will need to occur
downtown in the coming decades. The re-zoning for the development of 61 apartment
units at Rink and Olive Streets and the proposed redevelopment of the former YMCA
building to include 147 residential units are two examples of the types of projects that
will be required in order to help the City achieve its 40% intensification requirement and
its downtown density target.
In 2011, the City adopted a Central Area Community Improvement Plan (CA CIP) that
provides financial incentives to help stimulate downtown development. This, along with
exemption policies contained in the Development Charges By-law, promote
development and redevelopment in the Central Area. In 2016, 12 apartment units were
created in the UGC across two properties. In both cases, CA CIP grants were granted
to facilitate the costs of converting vacant space into residential units.
Table 8 - Total Units Created in Downtown Peterborough Urban Growth Centre: 2000-2016
Measured by Building Permits Issued
(Source: City of Peterborough Planning Division, City’s building permit database)
Year # of Units Created
2000 0
2001 0
2002 2
2003 7
2004 7
2005 102
2006 50
2007 4
2008 5
2009 13
2010 9
2011 29
2012 12
2013 17
2014 8
2015 0
2016 12
Total 277
3.2.3 Designated Greenfield Area (DGA)
Peterborough’s DGA is the area of the City that is outside of the Delineated Built
Boundary. The Growth Plan requires this area of the City to be planned to achieve an
average density of 50 residents and jobs combined per hectare. Once the New Official
21Plan is adopted and in force and effect, the target will increase to 80 residents and jobs
per hectare unless the City is able to secure a lower target. This target intends to
create residential subdivisions that offer a greater range and mix of housing that at the
same time help reduce urban sprawl. According to the City’s Official Plan, the City will
utilize Secondary Plans as the primary tool for planning to achieve this density target.
Since 2006, the City has adopted secondary plans for the Lily Lake Planning Area, the
east half of the Chemong planning area, and the north portion of the Coldsprings
planning area. Additionally, the City is currently preparing secondary plans for the
Liftlock and Carnegie planning areas, for the west half of the Chemong area, and for the
remainder of the Coldsprings area. Each Plan will be designed to help the City achieve
the density target for residents and jobs per hectare across the DGA.
4.0 Residential Land Supply
Section 1.4.1 of the PPS directs planning authorities to provide for an appropriate range
of housing types and densities. This includes maintaining at all times the ability to
accommodate residential growth for a minimum of 10 years through residential
intensification and redevelopment and, if necessary, lands which are designated and
available for residential development. In the short term, the PPS requires that
municipalities maintain at all times land with servicing capacity sufficient to provide at
least a 3-year supply of residential units. This section measures the City’s ability to meet
these requirements.
4.1 Short-Term (3-Year) Residential Land Supply
The PPS requires municipalities to maintain at all times a minimum three-year supply of
residential land, appropriately zoned to accommodate residential intensification or
redevelopment and lands in draft approved and registered plans of subdivision. This
land is readily available to the market to meet new housing demand without any major
servicing constraints.
As of the end of 2016, approximately 3,200 residential units can be accommodated on
land that is currently zoned for residential purposes in the City (Table 9). Based on the
annual average of 373 residential units being constructed over the past 10 years, this
represents an approximate 8.6-year supply7 of units on zoned residential land.
Notwithstanding this supply, some draft approved plans of subdivision, representing
approximately 860 residential units (all located in the DGA), are subject to significant
servicing considerations that restrict their ability to develop in a timely manner.
Accordingly, if these units are excluded, the City has approximately a 6-year supply of
land that is zoned and available for residential development.
Table 9 - Residential Unit Potential on Zoned Residential Land in the City of Peterborough, 2016
7
Represents approximately 8.6 years supply of zoned land based on annual average of 373 residential
units (10-year running average)
22(Source: City of Peterborough Planning Division, City’s building permit database, MPAC Data, GIS
analysis)
Type Unbuilt Units Units in BB Units in DGA
Draft Approved Plans of Subdivision 916 0 916
Draft Approved Plans with Service 858 0 858
Constraints
Registered Plans of Subdivision 298 8 290
Condo Developments Under 2 2 0
Construction
8
Zoned Sites 1117 1117 0
Total 3191 1127 2064
Total Excluding Constrained Sites 2333 1127 1206
4.2 Long-Term (10-Year) Residential Land Supply
The PPS requires municipalities to maintain at all times the ability to accommodate
residential growth for a minimum of 10 years. Growth is to be accommodated through
residential intensification, redevelopment, and if necessary, lands that are designated
and available for residential development. The term designated and available is a
defined term in the PPS as:
“means lands designated in the official plan for urban residential use. For
municipalities where more detailed official plan policies (e.g. secondary
plans) are required before development applications can be considered for
approval, only lands that have commenced the more detailed planning
process are considered to be designated and available for the purposes of
this definition.”
The City of Peterborough requires secondary plans to be established prior to
consideration of subdivision approval. To support the development of secondary plans,
the City has completed functional planning studies for most of the City’s Designated
Greenfield Areas. When considering the PPS definition of designated and available, the
City considers the completion of functional planning studies as the commencement of
the ‘more detailed planning process’. Therefore, those Designated Greenfield Areas that
have completed functional planning studies are included in the calculation of residential
land supply. This is a different approach than what has been taken in previous editions
of this report – whereby a strict interpretation of ‘designated’ land was taken.
The long-term residential land supply is largely comprised of Designated Greenfield
Areas that have been annexed by the City and have undergone functional planning
studies. Additional land includes vacant and under-utilized sites that have the potential
8
Estimated potential based on current zoning provisions of vacant residential land as well as sites that
were recently rezoned but have not undergone construction
23to accommodate future residential development and new subdivision applications within
the built boundary.
As of December 31, 2016, it is estimated that the City has enough land to accommodate
approximately 15,667 residential units over the long-term (see Table 10). Furthermore,
of these units, it is estimated that approximately 2,830 units can be accommodated
within the City’s Built Boundary and 12,837 units can be accommodated in the City’s
Designated Greenfield Area. It is estimated that there is an approximate 16-year
supply9 of potential units in the Built Boundary and a 98-year supply10 of potential units
in the Designated Greenfield Area based on the following assumptions:.
1. That development is consistent with the 10 year average of 373 units per year.
2. The City will accommodate 40% of annual residential development within the
city’s Delineated Built Boundary until the adoption of the New Official Plan.
3. The MCR is underway and will end on December 31, 2018.
4. That after the MCR ends the city will accommodate 50% of annual residential
development within the City’s BB until 2031 and thereafter 60% of annual
residential growth.
Table 10 - Long Term Residential Unit Potential of Designated and Available Residential Land in
City of Peterborough, 2016
(Source: Hemson Consulting Planning Area-Specific Development Charges Background Study 2017, City
of Peterborough Planning Division, GIS analysis)
Type Unit Potential Units in BB Units in DGA
New Subdivision Applications 1926 130 1796
Carnegie East 577 - 577
Carnegie West 419 - 419
Chemong West 1,492 - 1,492
Coldsprings 4,687 - 4,687
Jackson 867 - 867
Liftlock 1,455 - 1,455
Lily Lake 1,312 - 1,312
Auburn North 232 - 232
Downtown UGC (estimate) 1,400 1,400 -
Medium/High Density Land (estimate) 1,300 1,300 -
Total 15,667 2,830 12,837
However, as noted in Section 2.1, the City of Peterborough is predicted to grow to
115,000 residents by 2041. Based on 34,710 existing households (per the 2016
Census) and assuming this growth is accommodated at the current average household
size of 2.3 persons per household, this growth will require approximately 15,290 new
dwellings to be built over the next 25 years. If this level of growth is achieved, annual
9
Represents 19 years of total supply in the BB based on 40% of 373 units (149 units).
10
Represents 57 years of total supply in DGA based on 60% of 373 units (224 units).
24residential construction rates will exceed current levels, requiring an average
construction rate of 612 dwellings per year, and will accelerate development of the
City’s long-term residential land supply.
For the time being, the City is required to direct at least 40% of residential units to inside
the built boundary. Currently, only 18% of the identified long term unit potential is within
the built boundary. This estimate is based on known redevelopment or intensification
opportunities. The City will need to continue to support efforts to direct development
towards underutilised and underdeveloped sites within the Built Boundary to help
ensure this target is met. Such efforts include working with property owners to
redevelop Central Area sites by offering financial incentives through the Central Area
Community Improvement Plan, facilitating the redevelopment and conversion of non-
residential sites, and identifying opportunities for intensification and infill development,
including the intensification of existing housing through the creation of secondary
suites/accessory apartments. As intensification targets increase in coming years, the
pressure to develop within the Built Boundary will increase.
5.0 Residential Building Activity
Since 2000, the City has issued building permits for the creation of 6,467 residential
units (Table 11, Figure 11). This represents an annual average of 404 units. In 2016,
permits were issued for 337 units compared to a peak of 663 units issued in 2005.
Table 11 - Units Created Through Issued Building Permits, by House Type, in City of
Peterborough: 2000-2016
(Source: City of Peterborough building permit database)
Year Single/Semi Row Apartments and Other TOTAL
Detached Dwellings
2000 138 15 266 419
2001 149 24 29 202
2002 194 50 33 277
2003 246 51 63 360
2004 300 23 44 367
2005 328 161 174 663
2006 160 152 149 461
2007 213 108 325 646
2008 194 61 103 358
2009 237 70 67 374
2010 186 83 19 288
2011 150 54 87 291
2012 119 41 145 305
2013 209 49 170 428
252014 138 40 201 379
2015 154 44 89 287
2016 152 54 133 339
Total 3,267 1080 2,097 6,444
700
600
Apartments &
500 Other
400
Row
300
200
Single/Semi
100 Detached
0
Figure 11 - Units Created Through Building Permits Issued, By House Type in City of
Peterborough: 2000-2016
(Source: City of Peterborough building permit database)
6.0 Housing Market Trends
This section provides an analysis of trends in the housing market for the Peterborough
CMA. The information presented relies on reports prepared by the Canadian Mortgage
and Housing Corporation (CMHC).
6.1 Housing Starts
Housing starts are used to reflect the level of population and economic growth in a
region. In times of economic growth, housing demand typically increases, while in times
of economic slowdown or recession, housing demand typically moderates or declines.
The CMHC defines a ‘housing start’ as the beginning of construction work on a building,
usually when the concrete has been poured for the whole of the footing around the
structure, or an equivalent stage when a basement is not part of the structure. Note that
the data contained in this section is different than the building permit issuance data
supplied by the City’s Building Division (Table 11). CMHC’s housing start data is helpful
because it distinguishes between rental and ownership construction. Although CMHC’s
data applies to the Peterborough CMA rather than just the City, it captures the trend in
construction by tenure over time.
From 2000 to 2016, there were a total of 7,009 housing starts in the Peterborough CMA
(Table 12). A low of 232 housing starts was recorded in 2014, while a high of 619 was
recorded in 2005. Single-detached units were the dominant housing type built – totaling
2675% of all units built since 2000. The proportion of single detached homes has
decreased since 2000, with the slight increases of other housing types, particularly
apartments and row houses.
Table 12 - Housing Starts by Type and Tenure in Peterborough CMA: 2000-2016
(Source: Housing Now Tables – Peterborough CMA – Second Quarter 2017)
Year Total Single- Semi- Row Apartment Ownership Rental
Detached Detached Houses
2000 292 264 8 20 0 292 0
2001 294 256 14 24 0 293 1
2002 423 369 0 36 18 405 18
2003 547 470 0 71 6 531 13
2004 514 471 4 18 21 491 23
2005 619 449 8 157 5 517 102
2006 437 283 4 89 61 378 59
2007 540 324 4 107 105 540 0
2008 428 300 0 82 46 378 50
2009 371 286 0 55 30 331 40
2010 404 306 16 78 4 400 4
2011 351 239 6 58 48 303 48
2012 343 197 2 50 94 273 70
2013 354 224 0 48 82 272 82
2014 232 203 8 21 0 232 0
2015 365 296 2 55 12 353 12
2016 495 324 0 40 129 410 85
Total 7009 5261 76 1009 661 6399 607
% - 75% 1% 14% 9% 91% 9%
Table 12 also indicates that of all the housing starts in the Peterborough CMA from
2000 to 2016, the majority were built for the ownership market and only 9% were built
for the rental market. The percentage of rental market housing starts has increased
since 2000. Since rental housing satisfies a number of important demands in the
community’s housing market, particularly for those who cannot afford to become
homeowners, a balanced emphasis on its construction is required.
6.2 Residential Sales Activity
Figures 12 and 13 reflect the total number of annual sales of residential units in the
Peterborough CMA from 2000 to 2016 as well as the annual sales-to-new-listings ratio
(sales as a percentage of new listings). It’s estimated that approximately 3,070
residential sales occurred in 2016, beating out the previous record set in 2015 of 3,006
homes sold. The sales-to-new-listings ratio is estimated to be 78%, which is a new
record. Previously, the sales-to-new listings ratio was highest in 2002, when sales were
achieved for 75% of all new listings.
273,500
3,000
Number of Sales (Units)
2,500
2,000
1,500
1,000
500
-
Figure 12 - Total House Sales in Peterborough CMA: 2000-2016*
(Source: CMHC) * Note: CMHC’s license has changed as of July 2016 and they no longer publish exact
counts of sales. The Number of Sales for 2016 is an estimate.
According to CMHC, a sales-to-new listings ratio of less than 45% is representative of a
‘Buyer’s Market’, a sales-to-new listings ratio greater that 65% is representative of a
‘Seller’s Market’, while ratios between 45% and 65% indicate a Balanced Market.
Based on this, the Peterborough CMA has been largely characterized by a Balanced
Housing Market, except for the years from 2001 to 2004 when it was characterized by a
‘Seller’s Market’. Based on estimates from CMHC data, the market in Peterborough has
once again become a ‘Seller’s Market’.
2890%
80%
70%
Sales as % of New Listings
60%
50%
40%
30%
20%
10%
0%
Figure 13 - Sales-To-New-Listings Ratio for Peterborough CMA: 2000-2016*
(Source: CMHC) * Note: CMHC’s license has changed as of July 2016 and they no longer publish exact
counts of sales as a % of new listings. The sales-to-new listings ratio for 2016 is an estimate.
6.3 Apartment Vacancy Rates
The apartment vacancy rate (the percentage of apartments that are for rent and are
vacant) helps measure the demand for rental housing in a particular area. Generally,
vacancy rates will decrease during periods of economic growth and will increase in
times of economic slowdown. According to CMHC, Peterborough’s overall apartment
vacancy rate was 1.0%. This is a sharp decrease from 3.7% in 2015 and according to
the CMHC, the lowest vacancy rate in Peterborough since 1988.
The CMHC suggests that Peterborough’s 2016 vacancy rate decrease was influenced
by an increased demand for rental housing; few if any new rental units being created;
and a lack of turnover as fewer tenants moved out of rental housing as they became
home owners.
297.0%
6.0%
5.0%
Vacancy Rate
4.0%
3.0%
2.0%
1.0%
0.0%
2001 2002 2003 2004 2005 2006 2007 2008 2009 2010 2011 2012 2013 2014 2015 2016
Year
Figure 14 - Rental Apartment Vacancy Rate in Peterborough CMA: 2001-2016
(Source: Peterborough CMA Rental Market Report: Fall 2016, CMHC)
6.4 Average Market Rents
Average market rent is also a measure of housing demand in an area. Generally, rent
prices will increase as the demand for housing, particularly rental housing, increases.
Figure 15 displays the average market rent for all apartments in the Peterborough CMA,
in actual dollars as recorded by CMHC at the time and adjusted to 2016 dollars.
30AMR AMR 2016 $
$1,000
$950
$900
$850
$800
$750
$700
$650
$600
$550
$500
2001 2002 2003 2004 2005 2006 2007 2008 2009 2010 2011 2012 2013 2014 2015 2016
AMR $665 $679 $688 $743 $764 $780 $787 $803 $833 $847 $861 $866 $873 $904 $920 $936
AMR 2016 $ $876 $878 $854 $915 $920 $918 $906 $912 $935 $937 $922 $910 $909 $926 $932 $936
Figure 15 - Average Market Rent in Peterborough CMA: 2001-2016 Actual Reported Dollar
Amounts and Dollar Amounts Adjusted to 2016.
(Source: Peterborough CMA Rental Market Report: Fall 2016, CMHC; Bank of Canada Inflation
Calculator based on monthly Consumer Price Index)
In 2016, the average rent in the Peterborough CMA was $691 for a bachelor apartment,
$834 for a 1-bedroom apartment, $980 for a 2-bedroom apartment, and $1,208 for an
apartment with 3 or more bedrooms (Figure 16).
$1,300
$1,200
$1,100
$1,000
$900
$800 Bachelor
$700
$600 1 Bedroom
$500 2 Bedroom
$400
$300 3 Bedroom +
$200
$100
$-
Figure 16 - Average Rent by Apartment Type in Peterborough CMA: 2001-2016
(Source: Peterborough CMA Rental Market Report: Fall 2016, CMHC)
316.5 Average New and Resale House Prices
Figure 17 shows the average price of a new single-detached and resale home in the
Peterborough CMA from 2000 to 2016. During this period, resale house prices rose
steadily until 2016 as the average resale house price has more than doubled, increasing
to $331,872 in 2016. The average price of a new single-detached home has dropped,
however, with a price decrease to $299,742 in 2016 compared to $336,417 in 2015. In
recent years, the average resale house price has continued to increase while the
average price of a new single-detached home has somewhat stabilized since 2010,
though 2016 shows a further price decreases. This switch is reflective of recent
pressures and surges in the housing market as well as the trend to smaller lots in new
subdivisions which create comparatively more lower-priced new homes.
Resale Home New Single Detached Home
$400,000
$350,000
$300,000
$250,000
$200,000
$150,000
$100,000
$50,000
$-
2002 2003 2004 2005 2006 2007 2008 2009 2010 2011 2012 2013 2014 2015 2016*
Figure 17 - Average New and Resale House Price in Peterborough CMA: 2000-2016* (in $1,000’s)
(Source: Peterborough Kawartha Realtors Association and Canadian Real Estate Association data)
* Note: Previous years’ data was obtained from CMHC Housing Market Outlook reports. In 2016, resale
prices were estimated from information published in the CMHC Housing Market Outlook Report.
7.0 Affordable Housing And Social Housing
The following section outlines ‘affordable housing’ and ‘social housing’ in the City of
Peterborough. The City’s ability to achieve its affordable housing target identified in the
Official Plan is also assessed.
7.1 Affordable Housing
‘Affordable’ housing is defined as housing in which the household should not pay more
than 30% of their income on rent. Households that are required to do so are classified
as being in ‘core housing need’ and it was earlier identified (in Section 2.5) that the
32Peterborough CMA has a high proportion of its renter households that fall into this
category – nearly half of all renter households.
‘Affordable’ housing is more specifically defined in both the Growth Plan and the PPS
as:
a) in the case of ownership housing, the least expensive of:
1. housing for which the purchase price results in annual accommodation
costs which do not exceed 30 percent of gross annual household income
for low and moderate income households; or
2. housing for which the purchase price is at least 10 per cent below the
average purchase price of a resale unit in the regional market area;
b) in the case of rental housing, the least expensive of:
1. a unit for which the rent does not exceed 30 percent of the gross annual
household income for low and moderate income households; or
2. a unit for which the rent is at or below the average market rent of a unit in
the regional market area.
Low and moderate income households means, “in the case of ownership housing,
households with incomes in the lowest 60 percent of the income distribution for the
regional market area; or in the case of rental housing, households with incomes in the
lowest 60 percent of the income distribution for renter households for the regional
market area.”
The regional market area is defined as an area “that has a high degree of social and
economic interaction. The upper or single-tier municipality, or planning area, will
normally serve as the regional market area. However, where a regional market area
extends significantly beyond these boundaries, then the regional market area maybe
based on the larger market area” Therefore, the regional market area in Peterborough
generally includes both the City and County.
Based on this provincial definition and formula for calculating ‘affordable’, in
Peterborough, the 2016 maximum affordable house price is estimated to have been
$291,500 based and the maximum affordable rent was $691 for bachelors, $834 for 1-
bedrooms, $980 for 2-bedrooms and $1,050 (low/moderate income households) for 3 or
more bedroom units. The affordable house price for 2016 is based on the income of the
60th percentile of households. The affordable rent for bachelors, 1-bedrooms, and 2-
bedrooms apartments was based on average market rent and on the price affordable to
low and medium income households (60th percentile) for 3-bedroom apartments
7.1.1 Affordable Housing Target Monitoring
The PPS requires that the City of Peterborough “establish and implement minimum
targets for the provision of housing which is affordable to low and moderate income
households.” Based on the following Official Plan policy (adopted through OPA #142),
the City of Peterborough currently targets for a minimum of 10% of its new housing to
be constructed as ‘affordable’:
33You can also read