Town of Oliver Smart Growth On the Ground - (SGOG) THE REAL ESTATE INSTITUTE OF BRITISH COLUMBIA - Real ...
←
→
Page content transcription
If your browser does not render page correctly, please read the page content below
Town of Oliver

                   Smart Growth
                  On the Ground
                         (SGOG)

                         Prepared for

                    THE REAL ESTATE
                           INSTITUTE
                                  OF
                    BRITISH COLUMBIA

Realty Advisors
TABLE OF CONTENTS
INTRODUCTION .........................................................1
AREA OVERVIEW .......................................................1
POPULATION ...........................................................2
HOUSING / DEVELOPMENT .............................................7
COMMERCIAL / RETAIL ............................................... 16
INDUSTRIAL ........................................................... 24
AGRICULTURAL ....................................................... 27
Realty Advisors1
INTRODUCTION
Colliers International Realty Advisors (CIRA) was commissioned by the Real Estate Institute of BC to
provide market data for the Smart Growth on the Ground process for the Town of Oliver. CIRA will be
providing market opinions on the financial feasibility of development proposals considered during the
charette process. These opinions will be based on the research overviews provided on forecasted
population growth rates as well as the residential, retail, industrial, agricultural, and office markets
in the Town of Oliver.
AREA OVERVIEW
The study area for this research brief includes the Town of Oliver and Electoral Area C, both located
in the Regional District of the Okanagan Similkameen.
Electoral Area C of the Regional District of Okanagan-Similkameen (RDOS) is an area of 633 square
kilometers or 244 square miles. The District extends to Vaseaux in the north, Osoyoos Lake in the
south, McKinney area in the east and Deadman’s Lake in the west.
The Town of Oliver has a land area of 4.88 km (according to Statistics Canada 2001 Census) and is
located 33 km south of Penticton and 19 km north of Osoyoos on Highway 97 in the Okanagan Valley.
The lands of the Osoyoos First Nations were not considered in this research brief.
Smart Growth on the Ground – Town of Oliver
Realty Advisors2
POPULATION
The Smart Growth on the Ground process required population projections for the Town of Oliver and
Electoral Area C to 2041. Due to the small size of Oliver, under 5,000, there were no forecasts for
the Town specifically to 2041 so one had to be created.
Other forecasts for the Oliver area include:
• Urban Futures ‘Growth Strategy Report for the Okanagan Similkameen Region 2004 – 2031’
o This report does not mention any forecasted growth rates for the Town of Oliver, and
focuses on the larger urban centres and the regional district as a whole.
The report estimates roughly 1% growth per year until 2031 for the overall
region, with the majority of the growth expected in the larger urban areas,
not including Oliver.
• BC Stats P.E.O.P.L.E. (Population Extrapolation for Organization Planning with Less Error)
population projection for the Regional District, and for the Southern Okanagan Local Health
Area.
o The PEOPLE projections do not specifically forecast Oliver’s population growth.
Population growth estimates peak at 1% annually for three years after 2010
and decline until 2031.
In creating the population estimates for the Town of Oliver and Okanagan Similkameen Electoral Area
C there are a few key points to consider:
• Historically, growth in the Okanagan, as well as Oliver, has occurred in cycles of peaks and
troughs:
o From 1988 until 1996 Oliver experienced annual growth rates of over 2.5%.
o From 1996 until 2005 Oliver experienced negative annual growth, or growth under 1%
per year.
• Given the size of Oliver, any new development may have an impact on the overall population.
Smart Growth on the Ground – Town of Oliver
Realty Advisors3
The historical population growth of the Town of Oliver is presented in the following table:
Oliver Historical Population Growth
Year Population 1 Growth Rate
1986 2,028
1987 2,063 1.7%
1988 2,117 2.6%
1989 2,170 2.5%
1990 2,359 8.7%
2
1991 3,825 62.1%
1992 3,966 3.7%
1993 4,172 5.2%
1994 4,307 3.2%
1995 4,427 2.8%
1996 4,434 0.2%
1997 4,470 0.8%
1998 4,431 -0.9%
1999 4,426 -0.1%
2000 4,385 -0.9%
2001 3 4,409 0.5%
2002 4,441 0.7%
2003 4,426 -0.3%
2004 4,378 -1.1%
2005 4,379 0.0%
2006 4,450 1.6%
Notes
1
Source: BC Stats
2
Town of Oliver Boundary Expansion
3
Includes estimate of Census undercount
There is no reason to assume the pattern of relative high periods of growth, followed by periods of
little to no growth should not continue. With the strong economy that has existed in B.C. for the past
few years, and high levels of growth that have occurred in neighbouring areas of the Okanagan
Valley, it would appear as though Oliver is likely to enter into a period of relative high growth for the
short to medium term.
Smart Growth on the Ground – Town of Oliver
Realty Advisors4
Factors Effecting Oliver’s Population Forecast
• Regional Hospital located in Oliver
o Town of Oliver hosts the Southern Okanagan General Hospital for the Southern
Okanagan Local Health Area. The facility is classified as a Level 1 Community
Hospital and is the only acute care facility within the Southern Okanagan Local Health
Area. With 18 acute care beds, it provides basic emergency and inpatient services as
observation and assessment. It does not provide specialty services.
o Given the Provinces, and Canada’s, aging population Oliver’s hospital will likely have
a significant impact on the population growth rate of Oliver
• Solid job possibilities
o Hospital
o School Board
o Wineries / agriculture
o Industrial lands
• Relative low property value in Oliver compared to the rest of the Okanagan
o A rough survey of single-family lots in the Okanogan Valley yielded the following
estimates
Oliver $85,000
Penticton $140,000
Summerland $125,000
Osoyoos $120,000
• Overall popularity of the Okanagan Valley
• Possibility that potential developments are purchased as secondary homes
o Secondary home owners do not count towards population, though they would add to
the local economy
In a recent development in Osoyoos, of roughly 80 units sold, only 1 was to
someone planning to permanently reside in Osoyoos. All other sales were for
secondary homes.
Electoral Area C
There are different factors effecting growth for Electoral Area C, due to differing zoning and
subdivision regulations. These regulations are determined by the Regional District of the Okanagan
Similkameen and not from the Town of Oliver.
• Potential for residential growth in Electoral area ‘C’
o New by-laws have recently been passed that will limit the future growth in Electoral
Area ‘C’ as compared with the past. The new by-laws include:
Development permits for environmentally sensitive areas
Regulations regarding development in riparian areas
Potential for creation of an urban boundary
Smart Growth on the Ground – Town of Oliver
Realty Advisors5
Study Area Population Forecast
As mentioned previously, the study area for this population forecast included only the Town of Oliver and Electoral Area C.
OLIVER RESIDENTIAL MARKET STUDY
STUDY AREA POPULATION GROWTH
HISTORICAL
1991 1996 2001 2006 2007 2008 2009 2010 2011 2016 2021 2026 2031 2036 2041
OLIVER AREA
Town of Oliver 3,743 4,285 4,409 4,450 4,550 4,690 4,830 4,970 5,100 5,490 5,830 6,130 6,440 6,770 7,120
Avg. Annual Growth Rate (%) 2.7% 0.6% 0.2% 2.2% 3.0% 3.0% 2.8% 2.6% 1.5% 1.2% 1.0% 1.0% 1.0% 1.0%
% of Study Area n/a 51% 52% 52% 52% 52% 53% 53% 54% 55% 55% 55% 56% 57% 57%
Electoral Area C 2 n/a 4,077 4,150 4,190 4,220 4,250 4,290 4,340 4,390 4,570 4,730 4,920 5,070 5,200 5,330
Avg. Annual Growth Rate (%) n/a 0.4% 0.2% 0.6% 0.8% 1.0% 1.1% 1.2% 0.8% 0.7% 0.8% 0.6% 0.5% 0.5%
Total Oliver Study Area n/a 8,362 8,559 8,640 8,770 8,940 9,120 9,310 9,490 10,060 10,560 11,050 11,510 11,970 12,450
Avg. Annual Growth Rate (%) n/a 0.5% 0.2% 1.5% 1.9% 2.0% 2.1% 2.0% 1.2% 1.0% 0.9% 0.8% 0.8% 0.8%
Sources: Statistics Canada
Notes:
1
Census data to 2001, Projections formed by Colliers International Realty Advisors using available data and information
2
Population data for Electoral Area C in 1991 was not available
Smart Growth on the Ground – Town of Oliver
Realty Advisors6
The population forecast was created in recognition that the ultimate user was the Smart Growth on
the Ground process. The forecast created is not considered to be overly aggressive, and would be
considered the ‘medium growth’ scenario if three growth scenarios were created. Only one scenario
was created to simplify the deliverable, as the retail and housing forecasts are based on the
population projection.
Oliver is currently experiencing strong real estate development activity by relative standards. After a
few years of zero or negative growth there are currently approximately 173 residential units either
completed or under construction. Absorption rates so far have been strong, which implies the
population of Oliver may see relatively strong growth in the near to medium term.
It should be recognized, however, that many of the new units are multi-family dwellings, which
increase the probability that the unit will only be used as a secondary home, or that the number of
occupants will be lower than 2.2, the current average household size in Oliver.
Smart Growth on the Ground – Town of Oliver
Realty Advisors7
HOUSING / DEVELOPMENT
Colliers International Realty Advisors (CIRA) reviewed the current housing market for the Town of
Oliver and Electoral Area C to provide a base of information and data for the Smart Growth on the
Ground process. The following information includes an overview of the information collected
including a review of current and forecasted residential land use, comments on the current housing
market including current developments, and the implications that future demand will have on the
planning process.
Current Housing Stock
The age of the housing stock in the Town of Oliver and Electoral Area C is presented below:
Town of Oliver - Dwelling Age
# of Units %
Before 1946 250 13%
1946 - 1960 315 17%
1961 - 1970 165 9%
1971 - 1980 420 22%
1981 - 1990 325 17%
1991 - 1995 280 15%
1996 - 2001 125 7%
Source: Statistics Canada
Electoral Area C - Dwelling Age
# of Units %
Before 1946 145 9%
1946 - 1960 280 17%
1961 - 1970 285 18%
1971 - 1980 335 21%
1981 - 1990 245 15%
1991 - 1995 205 13%
1996 - 2001 110 7%
Source: Statistics Canada
These tables indicate the level of redevelopment that may be required as the housing stock continues
to age.
Smart Growth on the Ground – Town of Oliver
Realty Advisors8
The housing unit-type breakdown for the Town of Oliver and Electoral Area C as of the 2001 Census is
as follows:
Town of Oliver Dwelling Types - 2001
# of Units %
Single Detached Houses 1,240 66%
Semi Detached / Row / Duplex 315 17%
Apartments 245 13%
Movable Dwellings 80 4%
Average Household size 2.2
Source: Statistics Canada
Electoral Area C Dwelling Types - 2001
# of Units %
Single Detached Houses 1,270 78%
Semi Detached / Row / Duplex 80 5%
Apartments 20 1%
Movable Dwellings 250 15%
Average Household size 2.6
Source: Statistics Canada
The above tables clearly show that both the Town of Oliver and Electoral Area C have a clear
majority of single detached homes, while the Town of Oliver has a much higher proportion of multi-
family homes, either in apartments or semi-detached.
Number of Households by Household size
Town of Oliver Electoral Area C
# % # %
1 person 630 33% 360 22%
2 persons 760 40% 725 45%
3 persons 190 10% 175 11%
4 - 5 persons 260 14% 275 17%
6 or more persons 45 2% 85 5%
Source: Statistics Canada
The above table displays the breakdown of household sizes for the Town of Oliver and Electoral Area
C.
Smart Growth on the Ground – Town of Oliver
Realty Advisors9
The previous tables were based on the 2001 Census of Statistics Canada. More detailed information
of the current housing is displayed below for the Town of Oliver supplied by BC Assessment, which
collected the following data in July 2005.
Total
Type Description Number Area/Acres
Single Family Dwelling 1253 283
Single Family/Basement Suite 7 1.3
Duplex/Strata Lot 127
Row Housing/Strata Lot 244
Duplex 20 13.7
Triplex 2 0.71
Fourplex 3 0.87
Apartment Block 6 2.3
Garden Apt/Row Housing 8 7.3
Manufactured Homes In Manufactured Home 84
/Single Wide & Double Wide Park
Manufactured Homes Not in Manuf Home Park 5
Manufactured Home Park Commercial 2 12
Residential Farms SF Dwelling 30 169
Source: BC Assessment 2006
The above statistical information is different than the information provided by Statistics Canada since
Statistics Canada deals with the total number of units, while BC Assessment would only count
individual building titles.
The BC Assessment data is useful as it provides the land area used for each of the housing types, and
highlights the land requirements for single-family dwellings.
Future Housing Demand
Based on the population forecast created for the Town of Oliver and Electoral Area C, the required
future demand for various housing types can be projected. These housing type projections assume
that both jurisdictions will continue to maintain proportionately same housing type breakdown, based
on the Statistics Canada information.
Smart Growth on the Ground – Town of Oliver
Realty Advisors10
New Houses Required - Town of Oliver
Forecasted New Population to 2041 2,711
New Households 1,232
New Single Detached 813
New Semi Detached / Row / Duplex 206
New Apartments 161
New Movable Dwellings 52
New Houses Required - Electoral Area C
Forecasted New Population to 2041 1,180
New Households 454
New Single Detached 356
New Semi Detached / Row / Duplex 22
New Apartments 6
New Movable Dwellings 70
Source Statistics Canada 2001 Census
It should be recognized that these projections are based on the status quo of the current dwelling
types found in the Town of Oliver and Electoral Area C. Due to the lack of available land, especially
in the Town of Oliver, the dwelling types of future housing development will need to change related
to the current housing supply. The amount of vacant residential land is presented below for the
Town of Oliver.
Vacant Residential Use Properties
Land Use Description # of Properties Total Area (Acres)
Single Family Residential Lots less than 2 acres 108 30.69
Multi-Family 8 10.74
Acreage Lots over than 2 40.19
acres
According the projected demand for various types of housing the Town of Oliver will require over 800
new single-family homes by 2041; however, the Town only has roughly 30 acres of vacant land zoned
for single family usage, plus 40 acres of additional vacant residential land.
Based on a yield of 6 units per acre, and the requirement of 813 new single-family homes by 2041,
the Town of Oliver would require over 135 acres for single-family homes to maintain the current mix
of housing types that exits currently.
Smart Growth on the Ground – Town of Oliver
Realty Advisors11
Historical Housing Demand / Market
In 2004 and 2005 the residential resale market in Oliver has proven to be quite stable.
In 2004 there were roughly 140 single-family home sales that averaged approximately $155,000. In
2005 there was roughly the same number of single-family home sales, 140, but the average price had
increased to approximately $189,000, an increase of approximately 22%.
The market for multi-family sales in Oliver recorded approximately 40 sales in 2004, with an average
value of $96,000 or $90 per square foot. In 2005 the number of multi-family sales in Oliver increased
to 50 with an average value of $109,000 or $96 per square foot, an increase of roughly 6% from 2004.
General Residential Market Demand
Interviews with market participants indicate that the general market demand for housing in Oliver
appears to be generated from Saskatchewan and Alberta residents. These individuals are either
retired or on the verge of retiring and wanting to enter the Okanagan market. They expect to
hold/rent the property for two to four years before relocating to the area.
Of the current developments either completed, under construction or developments with approval,
approximately 65% of the units are multi-family. The multi-family townhouse and condominium type
of development is expected continue with out-of-province purchasers driving the demand for housing
in the area.
It is expected that a large proportion of residential purchasers will continue to be new residents to
Oliver looking for retirement property. As mentioned earlier the existence of a hospital, combined
with the small-town feel of Oliver is expected to continue to attract this demographic.
Relative to other urban centres in the Okanagan Valley, especially Osoyoos, it is expected that new
housing purchasers will be less likely buying a secondary home.
Current Planned Residential Developments
After a few years of inactivity of development, Oliver would appear to once again be poised to enter
into a period of growth. Currently there are a large number of units that have recently been built or
are currently under construction, including:
• 112 multi-family units
• 61 single-family units
• Totaling 173 units
There are a number of developments in the planning stage as well that are awaiting a building
permit. Reportedly, these proposed developments total another 182 units, including 75 multi-family
and 107 single-family units.
Smart Growth on the Ground – Town of Oliver
Realty Advisors12
Apartment Development
A multi-phase apartment development is currently under construction in immediate proximity to
hospital.
Phase I of the development is expected to be completed by the end of June 2006. After the first 11
months of being on the market, reportedly 31 of 36 units were sold for an average price of $155 -
$160 per square foot.
Reportedly, a small minority of the units sold to local residents upgrading from older condos worried
about reserve funds and maintenance. The majority of the buyers are generally retirees from
Saskatchewan and Alberta, and no buyers have come from Vancouver.
Phase II of this development is intended to be developed by April 2007. It was mentioned that prices
would increase by 30% for the 2nd Phase.
While this apartment development has been very successful so far it is unclear whether the
development is solely satisfying a pent up demand for an apartment type development in Oliver, or
whether there is truly a new market for this type of product. There are a number of examples of
similar developments in smaller towns that were very successful; however, this led to a rapid
oversupply of apartment units because the pent up demand had already been met.
Single-Family Development
Concerning new single-family developments, a new sub-division near, but not adjacent to the lake in
Oliver, is reportedly selling serviced single-family lots for upwards of $85,000.
Residential Growth in the Okanagan
Compared to Oliver, the rest of the urban centres in the Okanagan Valley have seen significant
growth and development in recent years. In terms of size, Oliver closely resembles the Town of
Osoyoos, located 19 km to the south.
In recent years, BC Statistics estimated that Osoyoos grew by over 2.7% in 2003, -0.3% in 2004, and
4.1% in 2005. Overall, these levels of growth are much higher than that of Oliver which was
estimated to have growth rates of –0.3%, -1.1%, and 0% over the same period.
Recently Osoyoos has seen a relative boom in housing development, much of which is being bought
for secondary homes. One example is the Solé Vita, which has been achieving values of $500 per
square foot. The development includes semi-detached single-family homes with one or two levels on
the waterfront of Lake Osoyoos.
As of mid-February 78 of 86 units had been sold after roughly 18 months on the market. Of the
purchasers, only one was a local resident – all other purchasers bought the unit as a secondary home.
Smart Growth on the Ground – Town of Oliver
Realty Advisors13
First Nations Developments
While the Osoyoos First Nations lands are not included in the study area for this analysis, it will be
important for the Town of Oliver and the Osoyoos First Nation to work together to ensure the
successful and coordinated development of the Oliver area.
Currently, the Osoyoos First Nation has two phases of residential developments planned for its lands
adjacent to Oliver, on long-term pre-paid land leases. Phase I includes the development of 35
townhomes. The values at build-out are expected to reach $300 per square foot and construction is
slated to start in 2006. However, this is a pricing level that is substantially higher than the current
market. Phase II is expected to include an additional 300 unit of residential detached, semi-
detached, townhouse and condominiums, pending agreement of service availability.
Potential Innovative Types of Housing
Given the shortage of vacant residentially zoned land, the Town of
Oliver will have to look towards densification and new types of
residential developments in order to meet demand without
sacrificing agricultural or environmentally sensitive lands.
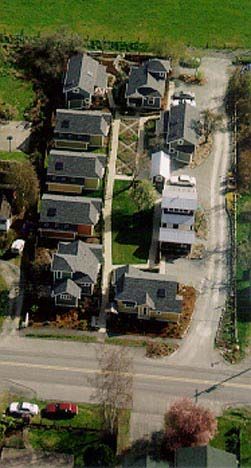
Cottage Housing Developments
There are few options in innovative housing development options
to satisfy smaller single-family housing needs. However, in some
of the smaller towns in the Puget Sound area, cottage housing
developments have taken hold. These developments are not in a
multi-family zoning but represent an innovative way to
incorporate medium density within a single -family
neighbourhood.
The four to ten
detached unit
developments have
common open
space with each
unit facing out onto a community courtyard. More than
one cottage may occupy a single lot and the cottages
are usually required to be less than 1,000 square feet
in living area, limited in height, and around a common
landscaped space. Parking is clustered and separated
from the common area. Architectural design elements are incorporated to ensure privacy from
neighbours in this type of a closely nested development, and having more active rooms look out to
the courtyard increases security.
Smart Growth on the Ground – Town of Oliver
Realty Advisors14
The purpose of this type of housing is:
• To respond to changing household sizes and ages
• Encourage creation of more usable open space for residents of the development through
flexibility in density and lot standards
• Provide opportunities for ownership of small, detached dwelling units within a single-family
neighbourhood
• Support the growth management goal of more efficient use of urban residential land, and
provide guidelines to ensure compatibility with surrounding land uses.
This type of innovative single-family housing is one way in which the Town of Oliver could increase
density while still retaining neighbourhoods and employing smart growth management strategies.
Residential Opportunities in Greater Oliver
• Future development in the short term will likely follow the current trend of occurring near
the lake, golf course, and hospital.
o In the long run, it is believed that densification will occur near the commercial core
of the city. It is possible that the proposed Wine Village development will in all
likelihood generate additional residential development activity nearby.
• As mentioned earlier, Oliver has a natural advantage over other similarly sized towns in the
B.C. interior due to the hospital. As a result, it is expected that Oliver will continue to
attract retirees who are attracted to the lifestyle available of living in a small rural town,
without the water sport recreational amenities of Osoyoos or Penticton.
• There will be an opportunity to redevelop and potentially consolidate some of the aging
housing stock in Oliver. Many of the older homes are near the commercial core, but are off
the highway, which would be a good area for moderate densification.
• As Oliver will, in general, be looking to increase density in the long run, it is expected that
there will be a movement among single-family homeowners to create secondary suites.
Secondary suites will also be a good source of affordable housing.
o It is not expected that Oliver will warrant the construction of a rental apartment
complex; therefore, affordable housing may be an issue in the future. Secondary
suites in single-family homes will go a long way to satisfy the demand for affordable
homes.
o Mobile or manufactured homes may also provide affordable housing; however, these
developments tend to reduce adjacent land values.
o BC Assessment indicates there are only 7 single-family homes with basement suites,
which indicates a significant opportunity for density.
o As residential values increase, secondary suites will make home ownership more
affordable.
Smart Growth on the Ground – Town of Oliver
Realty Advisors15
• Oliver will not warrant concrete apartment construction in the foreseeable future. In order
to be warranted, it is considered that built apartment values in Oliver would need to
approach $370 to $400 per square foot, and currently the highest values being attained in
Oliver are in the $160 per square foot range.
• It is unlikely that Oliver will see the redevelopment of 97th Avenue, the area considered the
commercial core, into mixed-use developments with residential units above commercial
space due to the negative influence of the highway. Densification will likely occur near the
lake, hospital, and adjacent to the commercial core before occurring directly on 97th Avenue.
• In general, the densification that is recommended in Oliver in the short term should likely
focus on ground-oriented clusters such as duplex to fourplex and even sixplex developments.
o Given that the market for housing in Oliver is primarily coming from retirees from
Alberta and the Prairies as well as smaller towns in B.C., market demand may be
negatively impacted if the high densification occurs too aggressively.
Implications for Planning Process
It is forecasted that Oliver will go through a somewhat similar period of growth as is currently
affecting the rest of the Okanagan Valley. This growth will cause pressure on the agricultural lands,
especially those lands that have been zoned for agricultural use but are not in the ALR. Lands that
are suitable for most agricultural uses are often attractive lands for development, since they often
are attractive topographically and have access to irrigation waters.
It is generally accepted that the residents of Oliver want to maintain the agricultural ambiance of the
town, and therefore, the Town of Oliver will have the responsibility of encouraging creative options
by the developers on existing residential land stocks while remaining a steward of the agricultural
lands.
• To promote densification of developed areas the Town of Oliver will have to revisit the zoning
by-laws. Recommended strategies could include:
o Allowing for secondary suites in all single-family zoned areas.
o Promoting the assembly of single-family homes to allow for the development of multi-
family units.
o Promoting ground oriented multi-family developments such as duplex’s and sixplex’s
in the short term before promoting low-rise apartment type developments.
o Promoting densification in the popular areas for development in Oliver, including near
the lake, hospital and commercial core.
Smart Growth on the Ground – Town of Oliver
Realty Advisors16
COMMERCIAL / RETAIL
Colliers International Realty Advisors (CIRA) reviewed the current retail and office market for the
Town of Oliver and Electoral Area C to provide a base of information and data for the Smart Growth
on the Ground process. The following information includes an overview of the information collected
including a review of current retail inventory, lease rates, and forecasts regarding future warranted
retail space, as well as the implications that future demand will have on the planning process.
Comments on the hospitality sector are also included in this section.
In this section retail, service and office space are considered simultaneously as lease rates for retail
space tend to be low enough that it can also feasibly be considered for office space as well.
Retail Overview
Due to its size, under 5,000 residents, and the proximity of other urban centres with larger retail
selection, a great deal of the retail expenditure from Oliver residents leaves the community.
Residents of Oliver have the option of going to Penticton, which is only 33 km away and has
significant retail options; the U.S. border, roughly 20 km to the south, where Oliver residents can
shop when the exchange rate is favourable; and Kelowna, the largest retail centre in the Okanagan
Valley, roughly 110 km to the north.
Retail Inventory
The retail inventory of the Town of Oliver was determined using data collected by BC Assessment. It
was determined that the Town of Oliver currently has 600,000 square feet of retail / office space (of
which 175,000 sq. ft. is currently being used as office space). The wide majority of this space is
located on 97th Avenue or just off 97th on a side street.
The Oliver Place Mall accounts for roughly 10% of the commercial space in Oliver. Major tenants of
the mall include Super Valu, Saan, and A & W. Other major tenants in Oliver include Buy-Low Foods,
Fields, and Home Hardware.
Current Market
Within the last 24 months, the commercial vacancy rate exceeded 5%; however, current commercial
vacancy rates are hovering around 5% or slightly less and going down. Typically, vacancy rates for a
town the size of Oliver would be hover around the 5% mark.
Smart Growth on the Ground – Town of Oliver
Realty Advisors17
Lease rates in Oliver in older buildings can be as low as $4 per sq. ft., while highly productive fast-
food space can cost up to $30 per square foot. However, the majority of retail space in Oliver tends
to have lease rates ranging from $5 to $8 per square foot. This rate is valid for both commercial
space in the Mall as well as for space in commercial centre of 97 th Avenue.
Future Expenditure Potential
It is possible to forecast the future expenditure potential of Oliver using the population forecasts
created for the Smart Growth on the Ground process. The population forecasts are used to project
the relative increase of demand for retail space that will occur as the population grows.
The projected retail expenditure for Oliver is based on the provincial average expenditure in various
retail categories. Since the average income in Oliver is lower than the average income in B.C., it is
expected that Oliver residents will spend less on retail categories considered in this study than the
average B.C. resident.
Oliver Expenditure Potential
Avg. Household % of B.C.
Income Average
B.C. Average Household Income $57,593 -
Oliver Average Household Income $39,930 69%
Electoral Area C $42,045 73%
As the average household income in the Town of Oliver and Electoral Area C are lower than the
provincial average, forecasted expenditure for Oliver was decreased by 12%. The level of the
decrease of projected expenditure does not match the difference in incomes because spending does
not decrease at the same rate as income, and Oliver has a high proportion of retirees whose spending
habits are not reliant on income.
Using provincial levels of expenditure, reduced by 12% for various categories, a projection of demand
for retail space can be created. Other assumptions that are necessary for each retail category
include the percentage of the study areas expenditure that will be spent in Oliver for each category,
as well as the percentage of expenditure that visitors and tourists will spend in Oliver for each
category. Expenditure from visitors, or non-Oliver residents, is called inflow.
The forecast for increased demand for supermarkets, convenience stores, drug stores, hardware
stores, and garden centres including building supply stores were created. The estimates of provincial
expenditure per category were created by Statistics Canada.
Some other significant retail categories were not considered for Oliver because it is assumed that
almost all expenditures would take place outside of Oliver. An example of these categories would
include electronics and appliances, furniture, clothing, and new cars.
Smart Growth on the Ground – Town of Oliver
Realty Advisors18
The table for each category considered ends with an estimate of the square footage warranted given
the predicted level of expenditure. A range of warranted floor space is given based upon the range
of expected annual productivity per square foot for each retail category.
PROJECTED SUPERMARKET / GROCERY STORE FLOOR AREA
2006 2011 2016 2021 2026 2031 2036 2041
Oliver Study Area Population 8,640 9,490 10,060 10,560 11,050 11,510 11,970 12,450
Per Capita Expenditure $1,914 $1,938 $1,964 $1,989 $2,015 $2,042 $2,068 $2,095
Total Area Expenditure $16,532,912 $18,396,253 $19,755,531 $21,007,879 $22,269,380 $23,498,964 $24,756,834 $26,085,422
Proportion to Stay in Oliver 60% 60% 60% 60% 60% 60% 60% 60%
Total Projected Resident Sales: $9,919,747 $11,037,752 $11,853,318 $12,604,727 $13,361,628 $14,099,379 $14,854,100 $15,651,253
Inflow at 5% of Sales Volume: $495,987 $551,888 $592,666 $630,236 $668,081 $704,969 $742,705 $782,563
Total Projected Sales Volume: $10,415,734 $11,589,639 $12,445,984 $13,234,963 $14,029,709 $14,804,347 $15,596,805 $16,433,816
Total Warranted Floor Space:
$425 per sq. ft. productivity 24,500 27,300 29,300 31,100 33,000 34,800 36,700 38,700
$475 per sq. ft. productivity 21,900 24,400 26,200 27,900 29,500 31,200 32,800 34,600
$525 per sq. ft. productivity 19,800 22,100 23,700 25,200 26,700 28,200 29,700 31,300
It was assumed that residents of the study area (including Oliver and Electoral Area C) would spend
60% of their total expenditures on supermarkets in Oliver. The majority of expenditure was
estimated to occur in Oliver, as convenience is important, however, a significant portion of
supermarket expenditure is likely lost through bulk purchases outside of Oliver in outlets such as
Costco and Real Canadian Superstore in Kelowna, and Overwaitea in Penticton. Inflow for the
supermarket retail category was expected to be 5% of the total expenditure from study area
residents.
The forecasted levels of expenditure allow a prediction of increased demand for retail space given
productivity levels per square foot that are common in the supermarket sector. It is forecasted that
over 14,000 sq. ft. of additional supermarket retail space will be warranted by 2041.
PROJECTED CONVENIENCE / SPECIALTY FOOD STORE FLOOR AREA
2006 2011 2016 2021 2026 2031 2036 2041
Oliver Study Area Population 8,640 9,490 10,060 10,560 11,050 11,510 11,970 12,450
Per Capita Expenditure $210 $213 $216 $219 $221 $224 $227 $230
Total Area Expenditure $1,816,010 $2,020,683 $2,169,989 $2,307,549 $2,446,115 $2,581,175 $2,719,343 $2,865,277
Proportion to Stay in Oliver 70% 70% 70% 70% 70% 70% 70% 70%
Total Projected Resident Sales: $1,271,207 $1,414,478 $1,518,992 $1,615,285 $1,712,281 $1,806,823 $1,903,540 $2,005,694
Inflow at 10% of Sales Volume: $127,121 $141,448 $151,899 $161,528 $171,228 $180,682 $190,354 $200,569
Total Projected Sales Volume: $1,398,327 $1,555,926 $1,670,891 $1,776,813 $1,883,509 $1,987,505 $2,093,894 $2,206,264
Total Warranted Floor Space:
$425 per sq. ft. productivity 3,300 3,700 3,900 4,200 4,400 4,700 4,900 5,200
$475 per sq. ft. productivity 2,900 3,300 3,500 3,700 4,000 4,200 4,400 4,600
$525 per sq. ft. productivity 2,700 3,000 3,200 3,400 3,600 3,800 4,000 4,200
Smart Growth on the Ground – Town of Oliver
Realty Advisors19
It was assumed that study area residents would spend 70% of their total expenditures at convenience
and specialty food stores in Oliver. Convenience purchases would mostly occur in Oliver, but a
portion of specialty food expenditures, such as ethnic foods, cheeses, and specialty meats, likely
occurs outside of the study area. An inflow estimate of 10% was assumed.
It is projected that demand for retail space from convenience or specialty food stores will increase by
almost 2,000 square feet by 2041.
PROJECTED DRUG / PERSONAL CARE STORE FLOOR AREA
2006 2011 2016 2021 2026 2031 2036 2041
Oliver Study Area Population 8,640 9,490 10,060 10,560 11,050 11,510 11,970 12,450
Per Capita Expenditure $576 $583 $591 $599 $606 $614 $622 $630
Total Area Expenditure $4,974,165 $5,534,779 $5,943,737 $6,320,524 $6,700,065 $7,070,003 $7,448,451 $7,848,176
Proportion to Stay in Oliver 60% 60% 60% 60% 60% 60% 60% 60%
Total Projected Resident Sales: $2,984,499 $3,320,867 $3,566,242 $3,792,314 $4,020,039 $4,242,002 $4,469,071 $4,708,906
Inflow at 10% of Sales Volume: $298,450 $332,087 $356,624 $379,231 $402,004 $424,200 $446,907 $470,891
Total Projected Sales Volume: $3,282,949 $3,652,954 $3,922,866 $4,171,546 $4,422,043 $4,666,202 $4,915,978 $5,179,796
Total Warranted Floor Space:
$325 per sq. ft. productivity 10,100 11,200 12,100 12,800 13,600 14,400 15,100 15,900
$375 per sq. ft. productivity 8,800 9,700 10,500 11,100 11,800 12,400 13,100 13,800
$425 per sq. ft. productivity 7,700 8,600 9,200 9,800 10,400 11,000 11,600 12,200
It was assumed that 60% of study area resident’s expenditures at drug stores would occur in Oliver.
Similar to supermarkets, the majority of study area resident’s drug and personal care expenditures
are expected to stay in Oliver. The main sources of outflow would come from bulk purchases, likely
during trips to large supermarkets outside of Oliver, and also potentially from prescriptions derived
from specialist doctors not located in Oliver. The level of inflow for this retail category was assumed
to be 10%.
It is projected that Oliver will warrant an additional 5,800 square feet of retail space by the year
2041.
PROJECTED HOME CENTRE / HARDWARE STORE FLOOR AREA
2006 2011 2016 2021 2026 2031 2036 2041
Oliver Study Area Population 8,640 9,490 10,060 10,560 11,050 11,510 11,970 12,450
Per Capita Expenditure $459 $465 $472 $478 $484 $490 $497 $503
Total Area Expenditure $3,970,062 $4,417,508 $4,743,912 $5,044,640 $5,347,565 $5,642,826 $5,944,879 $6,263,914
Proportion to Stay in Oliver 35% 35% 35% 35% 35% 35% 35% 35%
Total Projected Resident Sales: $1,389,522 $1,546,128 $1,660,369 $1,765,624 $1,871,648 $1,974,989 $2,080,708 $2,192,370
Inflow at 10% of Sales Volume: $138,952 $154,613 $166,037 $176,562 $187,165 $197,499 $208,071 $219,237
Total Projected Sales Volume: $1,528,474 $1,700,740 $1,826,406 $1,942,186 $2,058,812 $2,172,488 $2,288,779 $2,411,607
Total Warranted Floor Space:
$220 per sq. ft. productivity 6,900 7,700 8,300 8,800 9,400 9,900 10,400 11,000
$250 per sq. ft. productivity 6,100 6,800 7,300 7,800 8,200 8,700 9,200 9,600
$280 per sq. ft. productivity 5,500 6,100 6,500 6,900 7,400 7,800 8,200 8,600
Smart Growth on the Ground – Town of Oliver
Realty Advisors20
It was assumed that study area residents spend 35% of their total expenditures at home centres or
hardware stores in Oliver. It is expected that the majority of bulk purchases and large ticket items
such as lumber, electrical fixtures, are purchased outside of Oliver, while the hardware expenditures
that stay in Oliver are likely more convenience type purchases. Inflow, or expenditures from non-
study area residents was assumed to be 10% of the level of expenditure from study area residents.
It is projected that the demand for home centre / hardware store retail space in Oliver will warrant
an additional 4,100 square feet of space by 2041.
PROJECTED GARDEN CENTRE / SPECIALIZED BUILDING SUPPLIES STORE FLOOR AREA
2006 2011 2016 2021 2026 2031 2036 2041
Oliver Study Area Population 8,640 9,490 10,060 10,560 11,050 11,510 11,970 12,450
Per Capita Expenditure $146 $148 $150 $152 $154 $156 $158 $160
Total Area Expenditure $1,260,205 $1,402,237 $1,505,846 $1,601,305 $1,697,462 $1,791,186 $1,887,066 $1,988,336
Proportion to Stay in Oliver 45% 45% 45% 45% 45% 45% 45% 45%
Total Projected Resident Sales: $567,092 $631,007 $677,631 $720,587 $763,858 $806,034 $849,180 $894,751
Inflow at 10% of Sales Volume: $56,709 $63,101 $67,763 $72,059 $76,386 $80,603 $84,918 $89,475
Total Projected Sales Volume: $623,802 $694,107 $745,394 $792,646 $840,244 $886,637 $934,098 $984,226
Total Warranted Floor Space:
$220 per sq. ft. productivity 2,800 3,200 3,400 3,600 3,800 4,000 4,200 4,500
$250 per sq. ft. productivity 2,500 2,800 3,000 3,200 3,400 3,500 3,700 3,900
$280 per sq. ft. productivity 2,200 2,500 2,700 2,800 3,000 3,200 3,300 3,500
It was assumed that study area residents would spend 45% of their total expenditures in garden
centres and building supply stores in Oliver. Similar to hardware stores, it is expected that many of
the large ticket and bulk purchases take place outside of Oliver. However, it is expected that a
significant portion of garden centre expenditure stays in Oliver, as well as some specialized building
supplies such as pre-built fences, and grout. Inflow from non-study area residents was assumed to be
10%.
It is projected that the demand for garden centre and building supply store retail space in Oliver will
warrant an additional 1,700 square feet by 2041.
It should be recognized that these projections of demand for retail space are based on a number of
assumptions, including population projections, as well as estimates of inflow and the percentage of
resident expenditures to stay in Oliver. The projections created should be viewed as a preliminary
overview of demand for retail space fore various retail categories going forward.
Smart Growth on the Ground – Town of Oliver
Realty Advisors21
Potential Developments
There are a number of retail developments currently being proposed for the study area. Some of the
proposed developments will require rezoning, but Oliver does currently have almost 3.5 acres of
vacant land zoned for commercial use.
Land Use # of Properties Total Area/Acres
Vacant Commercial Properties 21 3.42
One of the proposed developments includes a 65,000 square foot commercial retail development at
north end of town with national and multi-national tenants. The project may include two big box
retailers taking up 50,000 square feet with 4 - 6 (15,000 sq ft) smaller retail tenants. To achieve this
development the Town of Oliver would have to annex land and extend the Town boundary.
As a comparison to the commercial rates currently being achieved in Oliver, new retail developments
like the one described above generally have lease rates of $12 - $14 per sq ft for the big box stores,
while the smaller Commercial Retail Units (CRU’s) have rates of $18 - $25 per square foot.
Another proposed retail development in the study area is the Wine Village. One of the primary
strategies for economic development for the Oliver area is capitalizing on the growth and success of
the wine sector, which was the motivation for branding Oliver the Wine Capital of Canada. The Wine
Village concept looks to capitalize on Oliver as an agricultural resort area, where tourists will be
attracted to the rural and agricultural atmosphere of Oliver and its surrounding lands.
The proposed Wine Village will be a mixed-use development including commercial / retail space,
multi-family residential units, and a hotel. The Wine Village will be located on 4.3 acres of land just
east of Highway 97. Current discussions project an aggressive 5-year build out with 350,000 square
feet. Reportedly the land use allocation will be 1/3 residential, 1/3 retail and 1/3 hotel.
Vancouver’s Co-operators Development Corporation has been selected as a development partner to
design the $75 million Wine Village for the Town of Oliver.
Smart Growth on the Ground – Town of Oliver
Realty Advisors22
Hospitality Sector
While it is not within the scope of our work to review the market and trends of the hospitality
industry, there are some notable challenges, which should be mentioned especially in light of the
Wine Village Concept Plan.
• Current accommodation in Oliver is rated in the 2 to 2.5 star categories. Room rates average
$59 - $79/night.
• 4 and 5 star full service hotel room rates in Vancouver range from $180 to $250/ night.
• In relative terms, the Vancouver market is not big enough to support room rates of $300
night. One of the most expensive hotels in Vancouver charges in the range of $260 a night.
Specialty properties, such a the Wickinnish Inn on the West Coast of Vancouver Island, are
marketed and operated as a 4 to 5 star full service destination hotel and caters to a world
wide market. Costs associated with these types of properties range $250,000 to $300,000 a
room to build out, and are allocated substantial marketing funds on an annual basis to attract
the worldwide market.
• For an investor to consider constructing and operating a high-end boutique hotel with a
reasonable return, it would require an 80 – 100 room facility and average annual occupancy
rates of 60 %. However, an owner-operator investor could conceivably be enticed to
construct a much smaller facility but it would have to fill a specialty niche and require
substantial equity investment. A high-end wine tour/spa destination could possibly be
considered due to the arid climate and agricultural component of the area.
• Currently, the hospitality industry in Oliver typically accommodates one or two night
weekend overnight visits. Lengthy stays are uncommon.
• Even with the attraction of the Wine Village development, the typical visitor would probably
not be the type of client who will pay $180 - $250 a night.
Smart Growth on the Ground – Town of Oliver
Realty Advisors23
Implications for Planning
• Similar to other smaller communities, the dominant feature is the highway, and it is unlikely
that even increased demand within Oliver will alter that trend and warrant retail
development away from the highway.
• The Wine Village must create a destination retailer to attract consumers since its location
would limit most retailers.
• Market will likely be more attracted towards renovating existing retail space rather than new
development due to the economic consideration of return on investment.
• Potential for development of an educational institution that focuses on the agricultural
specialties of the area may exist.
• It is expected that the retail market in Oliver will continue to be dominated by owner-
occupiers. There will continue to be limited demand from national retailers for space in
Oliver due to the smaller population of Oliver and its surrounding area and the significant
level of retail options available in nearby population centres, such as Penticton and Osoyoos.
o It is expected that if new large format (big box) retail were developed in Oliver the
expenditure outflow for those categories would decrease; however, existing retailers
carrying similar merchandise would have difficulties competing with the large format
retailer, and therefore failures will be experienced resulting in higher vacancies.
o Due to the small population of Oliver relative to Penticton, and a lesser degree
Kelowna, there will always be a significant level of retail expenditure outflow due to
the larger variety of product selection. It is unlikely the population of Oliver can
sustain a level of retail that would prevent significant outflow to other much denser
nearby population centres. It is a given that study area residents will leave Oliver for
certain products. Beyond the retail categories carried in a new large format store, it
is questionable whether outflow will be reduced on a broad array of retail categories
not offered in the new large format store.
• Given the low cost for retail space, it is expected that there will be little or no market for
developing second floor office space.
Smart Growth on the Ground – Town of Oliver
Realty Advisors24
INDUSTRIAL
Colliers International Realty Advisors (CIRA) reviewed the current industrial market for the Town of
Oliver and Electoral Area C to provide a base of information and data for the Smart Growth on the
Ground process. The following information includes an overview of the information collected
including a review of current industrial land inventory, lease rates, and comments on the potential
for growth from Oliver’s employment generating lands, as well as the implications that future
demand will have on the planning process.
Industrial Overview
The Town of Oliver currently has an inventory of industrial building area of 600,000 square feet.
Almost 14 acres of industrially zoned land is vacant.
Land Use # of Properties Total Area/Acres
Vacant Major Industry Properties 8 13.79 Acres
Much of the vacant industrially zoned land is in close proximity to the Oliver airport, which is the
neighbourhood considered as the industrial sector.
Reportedly, by far the majority of industrial properties are owner occupied. It is estimated that
upwards of 45% of the industrial lands in Oliver are being used by the agricultural sector including
fruit packing, fruit storage, or equipment storage and repair. The balance of industrial land is being
occupied by a variety of uses, including warehousing, storage, airport hangers, etc.
Current Industrial Market
In general, rental rates for industrial land in Oliver range from $3 to $5.50 square foot with the
predominant market ranging between $4 and $5 per square foot. However, recently a 6,000 square
foot industrial site was leased at a rate of $6 per square foot, which might be an indication of the
upward pressure on the market. At the low end of the market, a 10,000 sq. ft. packinghouse with
poor services was leased for $3 per square foot, which is considered average in the Okanagan Valley.
Vacancy levels for industrial land in Oliver are approximately 5% on developed sites.
Smart Growth on the Ground – Town of Oliver
Realty Advisors25
Potential for growth
Given the current economic development strategy for Oliver of focusing on agriculture and
agricultural tourism, potential future uses of Oliver’s industrial lands could be derived from the
growth of those sectors. Future growth of industrial demand from the agricultural sector might come
for example, from the need for storage facilities from the various local wineries, or perhaps from a
distillery of spirits such as brandy. It is also possible that smaller local wineries may want to form a
local co-operative that would likely require space for shared equipment.
The Oliver airport may be a catalyst for demand in Oliver’s industrial lands, but it is questionable
whether or not the airport is large enough for efficient transportation of goods. Regardless, the
airport would make it easier for company principals to visit their operations in Oliver, which is
nonetheless an attractive benefit.
Other potential sources for expansion in industrial demand might come from:
• Regional shortage of industrial lands in the higher priced areas of the Okanagan Valley.
• As suggested in the commercial retail sector, potential may exist for an educational
institution that focuses on the agricultural specialties of the region, primarily the wine
sector.
• Small entrepreneurial clean manufacturers
o Mill work, such as:
Wine barrel manufacturing
Custom furniture
o Local crafts production
o Technology based industries
• Electrical engine rewind shops
• Others
Implications for Planning
• While a great deal of population growth expected in Oliver will derive from retirees, the
Town of Oliver must not neglect the potential of its employment generating lands. Solid jobs
for Oliver residents will help maintain a strong local economy, and make it easier for families
to live and stay in Oliver. An issue for all communities in the Okanagan Valley is providing
opportunities for youths so that they are not forced to move away from home.
• Opportunities to capitalize on the Oliver airport, and the adjacent vacant industrial lands
should be analyzed.
Smart Growth on the Ground – Town of Oliver
Realty Advisors26
• As Oliver is attempting to create an agricultural tourist resort, industrial uses that may
conflict with the predominant agri-business of the Oliver area, or produce other negative
factors, such as smog, odours, or loud noises should be avoided.
o The Town of Oliver’s current OCP reflects the idea that future industrial uses should
focus on light industrial activities, such as light manufacturing, wholesaling,
warehousing, storage, processing, etc.
• If the Town of Oliver wants to attract technology companies it should ensure that high-speed
connectivity is not an issue.
Smart Growth on the Ground – Town of Oliver
Realty Advisors27
AGRICULTURAL
Current Agricultural Land Base
Electoral Area C
Electoral Area “C” – Total Area = 63,300 ha (156,417 acres)
ALR in Electoral Area C (including First Nations lands) = 9,295 ha (22,968 acres)
ALR in Electoral Area C (excluding First Nations lands) = 6,550 ha (16,185 acres)
Non-ALR Agricultural Lands (First Nations excluded) = 4,843 ha (11,967 acres)
Town of Oliver
Total Land Base of Oliver = 1,235 acres (4.88 sq km)
ALR in Town of Oliver = 112 ha (276 acres)
Non-ALR Agriculturally zoned land in Town of Oliver = 12 ha (30 acres)
Balance of land base in Oliver = 929 acres approximately
The above data highlights that much of agricultural zoned land in the study area is inside of the ALR
and only zoned for agricultural uses. The 30 acres of agriculturally zoned land outside of the ALR and
in the Town of Oliver will be more susceptible to development pressures than ALR land.
Risks Facing Agricultural Lands
Oliver is primarily an agricultural area with productive valley soils, semi-arid climate, and with over
200 days of sunshine per year. Citizens of Oliver have publicly stated that they support preserving
the ALR lands and the retention of the region’s rural lifestyle supported by an active agricultural
economic base. It is our understanding that the Official Community Plan (OCP) must recognize the
existence of the ALR and its limitations on development by order of the Municipal Act.
Notwithstanding that, support of agricultural endeavours is assumed for agricultural activities that
are compatible with residential land use. However, industrial agricultural land uses that create
noise, odour or dust may diminish the public support for the preservation of agricultural lands.
Historically, the Okanagan Valley experiences peaks and troughs in population and development
growth. If the area does not seriously consider increasing density to accommodate future growth, the
agricultural lands will experience ever-increasing pressure for development due to the following:
• The flat topography of agricultural land is conducive to economic development
• Agricultural land tends to be easier to develop due to lack of bedrock
• Agricultural lands tend to be priced at the low end of the value ranges for land
• Good agricultural soils are typically well located in the valley bottom
• Agricultural lands are often in close proximity to water sources or serviced with irrigation
• Water licenses for irrigation is capable of servicing large numbers of residential properties
Smart Growth on the Ground – Town of Oliver
Realty Advisors28
The Town of Oliver and its residents must recognize that development pressures on agricultural lands
will be a continual issue.
Types of Agricultural Opportunities
It is not within scope of our report to recommend possibilities for increased efficiencies on
agricultural lands; however, conducting research on potential value-added services on agricultural
lands such as B&Bs, direct sale of product to the public, or allowing educational facilities use of the
land for agricultural programs could assist agricultural operators and owners diversify income stream
and operations.
Smart Growth on the Ground – Town of Oliver
Realty AdvisorsYou can also read