Habitat assessment in a tropical montane cloud forest - Benjamin Anthony Emile Petch May 2021 Honours Project Bangor University Honours Degree in ...
←
→
Page content transcription
If your browser does not render page correctly, please read the page content below
Habitat assessment in a tropical montane
              cloud forest

                       500483500

         Benjamin Anthony Emile Petch
                     May 2021

                        being an

               Honours Project

                      submitted to

              Bangor University

                in partial fulfilment of an

          Honours Degree in Forestry

                             I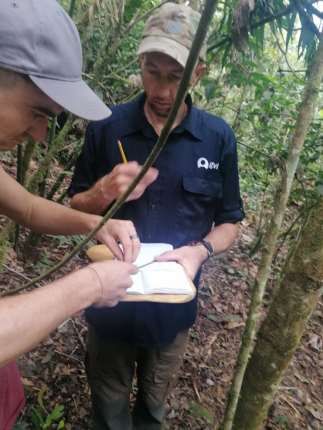
Declaration

I declare that this is the result of my own investigation and that it has not been submitted or accepted
in whole or part for any degree, nor is it being submitted for any other degree.

Candidate: Benjamin A. E. Petch

Signature: ……………………………………………………….

                                                   II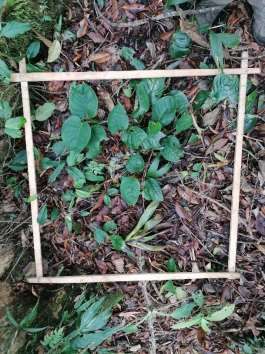
Acknowledgements

I would like to thank the following people for their guidance, support, and assistance throughout the
composition of this project:

Dr Andy Smith for being my personal tutor throughout university, he gave me guidance on potential
projects. Then when I chose my project, he supported me and helped with any query I had.

Volunteers at Cloudbridge nature reserve for helping me collect my data in the field as I would not
have been able to take a lot of the measurements without an extra pair of hands.

Greg Oakley and Antoine Jeunet for their knowledge in the field and training, as well as helping me
collect my data.

Jennifer Powell for her training in the field and lab skills which she helped me get to grips with.

Clara Moreno for helping me sort my project out and going over my data with me.

Casey McDonnell for helping with any problems I had.

Cloudbridge nature reserve as a collective for giving me the best experience that I will treasure for a
lifetime.

Max Battison and Jacob Bouma for their constant support and help throughout my time in
Cloudbridge.

                                                   III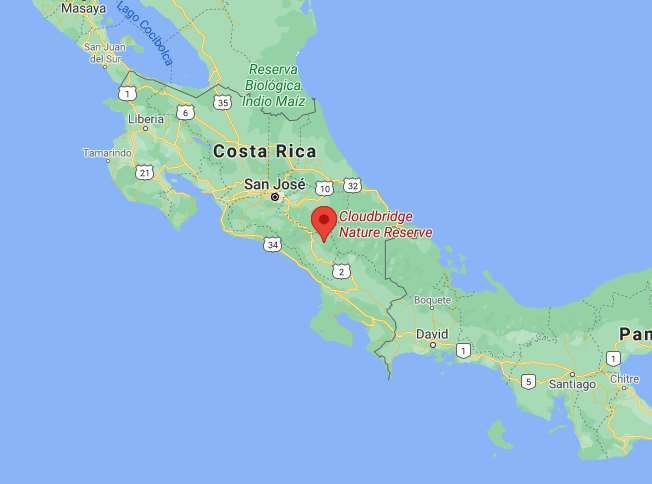
Abstract

With climate change being increasingly felt around the world, it is important to understand the ways
that are best in counteracting it. Tropical forests play an important role in the global carbon cycle, Ca
25% of terrestrial carbon is stored within biomass and soils within tropical forests (Schlesinger, 2000)
(Jobbagy, 2000) (Tarnocai, 2009). One of the main goals of this project was to analyse how much
carbon dioxide is stored within a tropical montane cloud forest in Costa Rica. The project compared
the carbon sequestration capacity within 3 different forest types; natural regeneration, planted and
old growth forest. This will show whether there is a difference in potential depending on how a tree
has regenerated. Vegetation cover was also assessed as well as canopy cover to understand the
relationship between vegetation and light availability. Again, the 3 forest types were compared with
each measurement taken to find out whether there are significant differences between forest types.
Core samples were taken, then analysed in a lab and using the water displacement method (Chave,
2005). The samples were then dried in an oven to attain their dry weight. The wood specific gravity
was calculated and used to calculate the above ground biomass. With this the carbon storage was
then calculated. The old growth forest had the highest carbon content out of the 3 forest types. This
was to be expected, multiple literature sources had already stated the importance of larger trees in
old growth forests (Mildrexler, 2020). There was also a clear relationship between the canopy cover
and percentage of ground vegetation cover. The more light coming through the canopy led to denser
vegetation coverage. This project contains a range of results from the 3 forest types previously
mentioned, all the results are compared between the other forest types to try and attain any
significant differences.

                                                   IV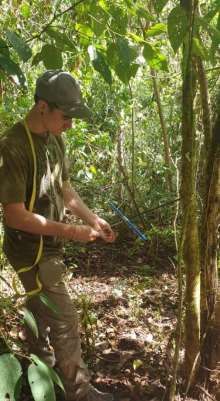
Contents

Declaration .............................................................................................................................................. II
Acknowledgements................................................................................................................................ III
Abstract .................................................................................................................................................. IV
1 - Introduction ....................................................................................................................................... 1
   1.1 - Forest cover in Costa Rica ........................................................................................................... 1
   1.2 - Environmental goals for Costa Rica ............................................................................................ 1
   1.3 - Project aims ................................................................................................................................ 2
   1.4 - Project objectives........................................................................................................................ 2
   1.5 - Hypotheses ................................................................................................................................. 3
2 - Literature review................................................................................................................................ 4
   2.1 - Carbon sinks ................................................................................................................................ 4
   2.2 - Old growth .................................................................................................................................. 4
   2.3 - Vegetation cover vs canopy cover .............................................................................................. 5
   2.4 - Tropical forests reacting to climate change................................................................................ 5
   2.5 - Planted vs natural regeneration ................................................................................................. 6
3 - Materials and methods ...................................................................................................................... 6
   3.1 - Study area ................................................................................................................................... 6
   3.2 - Tree numbering .......................................................................................................................... 7
   3.2 – DBH ............................................................................................................................................ 8
   3.3 - Crown class ................................................................................................................................. 8
   3.4 - Living status ................................................................................................................................ 9
   3.5 - Tree heights ................................................................................................................................ 9
   3.6 - Canopy cover and ground vegetation cover ............................................................................... 9
   3.6 - Tree coring ................................................................................................................................ 10
   3.7 - Lab work.................................................................................................................................... 11
4 - Results .............................................................................................................................................. 12
   4.1 - Tree density .............................................................................................................................. 12
   4.2 - Ground vegetation cover .......................................................................................................... 14
   4.3 - Canopy cover ............................................................................................................................ 16
   4.4 - Above ground biomass (AGB) ................................................................................................... 18
   4.5 - Carbon dioxide .......................................................................................................................... 20
   4.6 - Crown class ............................................................................................................................... 22
   4.7 - Correlation and Regression....................................................................................................... 22

                                                                             V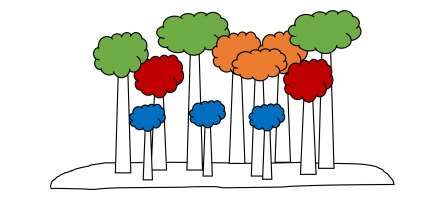
5 - Discussion ........................................................................................................................................ 23
   5.1 - Tree density .............................................................................................................................. 24
   5.2 - Ground vegetation cover .......................................................................................................... 24
   5.3 - Canopy cover ............................................................................................................................ 24
   5.4 - Above ground biomass ............................................................................................................. 25
   5.5 - Carbon dioxide .......................................................................................................................... 25
   5.6 - Crown class ............................................................................................................................... 25
   5.7 - Correlation and regression ....................................................................................................... 26
6 – Conclusions ..................................................................................................................................... 27
   6.1 - Future recommendations ......................................................................................................... 28
7 - Reference list ................................................................................................................................... 29

                                                                           VI
List of figures
Figure 1. Map of Costa Rica showing the location of Cloudbridge nature reserve. (Google Maps, 2020) – 7
Figure 2. Crown class diagram. (Cloudbridge habitat assessment protocol, 2018) – 8
Figure 3. Quadrat displaying the ground vegetation coverage. (2021) – 9
Figure 4. Using an increment borer to remove a core sample. (2021) – 10
Figure 5. Putting the core sample into a straw. (2021) – 10
Figure 6. Water displacement method (Chave, 2005). – 11
Figure 7. Comparison of mean tree density between planted, natural regeneration and old growth forest. The
standard error bars show a 95% confidence interval. (2021) – 13
Figure 8. Comparison of mean percentage of ground vegetation cover between planted, natural regeneration
and old growth forest. The standard error bars show a 95% confidence interval. (2021) – 15
Figure 9. Comparison of mean percentage of canopy cover between planted, natural regeneration and old
growth forest. The standard error bars show a 95% confidence interval. (2021) – 17
Figure 10. Comparison of mean above ground biomass (cm3) between planted, natural regeneration and old
growth forest. The standard error bars show a 95% confidence interval. (2021) – 19
Figure 11. Comparison of mean carbon content stored in above ground biomass between planted, natural
regeneration and old growth forest. The standard error bars show a 95% confidence interval. (2021) – 21
Figure 12. Comparison of crown class ratings between planted (left), natural regenerated (middle) and old
growth (right) forest. The standard error bars show a 95% confidence interval level. (2021) – 22
Figure 13. Scatter diagram with linear regression line showing the relationship between percentage of
vegetation cover and canopy cover. (2021) - 23
Figure 14. The old growth forest in Cloudbridge Nature Reserve. (2021) – 27
List of tables
Table 1. Summary of the mean, standard deviation, standard error, and the significant difference (p value) for
tree density between planted, natural regeneration and old growth forest. (2021) – 12
Table 2. Summary of the mean, standard deviation, standard error and the significant difference (p value) for
percentage of ground vegetation cover between planted, natural regeneration and old growth forest. (2021) –
14
Table 3. Summary of the mean, standard deviation, standard error and the significant difference (p value) for
percentage of canopy cover between planted, natural regeneration and old growth forest. (2021) – 16
Table 4. Summary of the mean, standard deviation, standard error and the significant difference (p value) for
above ground biomass (cm3) between planted, natural regeneration and old growth forest. (2021) – 18
Table 5. Summary of the mean, standard deviation, standard error and the significant difference (p value) for
carbon stored in above ground biomass between planted, natural regeneration and old growth forest. (2021) –
20
Table 6. Summary of standard deviation and means for percentage of vegetation and canopy cover. (2021) –
22
VII1 - Introduction
1.1 - Forest cover in Costa Rica
Costa Rica is one of the most species rich countries that is home to 5% of the world’s biodiversity
(Costa Rica Embassy Washington DC, 2021). It is a small country in central America that acts as a bridge
for a variety of animals and plants from North to South America. The country borders the Pacific Ocean
along the West side, and to the East is the Caribbean ocean. The country is not big in size (0.03 percent
land coverage on Earth) (Costa Rica Embassy Washington DC, 2021) however the species variation
across the country is massive due to the many ecosystems present. The country is split into 2 by the
help of the central valley mountain range that keeps the Pacific and Caribbean side separate.
Costa Rica has an extremely extensive list of trees that grow there. The natural forest cover was high
until around the 50s. At this time, the government encouraged people to move out of the cities into
more rural areas. They encourage people to clear forested land to make space for cattle farming (FAO,
2015). The incentive back then for people was that all the land they could clear and use for farming
would belong to them by default. This continued for about 30 years until they reached a mere 21%
forest cover. This was 30 years ago, since then they have really pushed to plant more trees. They have
had just over a 30% increase in forest cover within the last 30 years and currently have 52% of there
land forested (FAO, 2015). The meat market in the 80s was not as lucrative as it once was, the focus
of the country went to other things. This included more of a focus on exportation of crops and the rise
of job opportunities for work, not in the agricultural industry (FAO, 2015). The trees reclaimed the
abandoned farmland naturally, as well as a mass artificial reforestation effort.
1.2 - Environmental goals for Costa Rica
Costa Rica is now one of the most environmentally competent countries in the world. 98% of the
country’s energy is renewable and they have greatly increased their tree cover. Forests act as carbon
sinks and are used to offset carbon emissions that are being produced (Phillips, 2014). Costa Rica
stated in 2015 that they were aiming to be carbon neutral by 2021 (Darrah, 2020) as well as bringing
in a ban on all single use plastics. In 2019 the president unveiled the new sustainable development
strategy (IDB, 2020) that plans on completely removing carbon from its economy to achieve net zero
emissions by 2050 (UN, 2019). This would be attained by “electrification of transport, smart and
resilient cities, sound waste management, sustainable agriculture and improved logistics” (President
1Carlos Alvarado Quesada, 2019). To achieve this goal, it is essential for the continued management
and expansion of forests in the country. As previously mentioned, forests are great carbon sinks and
are crucial to reducing the county’s carbon footprint. Carbon sinks offset carbon that is produced, and
the idea is for there to be an equilibrium between the amount of carbon produced and the amount of
carbon sequestered.
1.3 - Project aims
This project assessed the different forest types found within a tropical montane cloud forest.
Measurements were taken in areas of forest that were planted, natural regenerated and old growth.
Within the assessment measurements will be used to compare the different forest types to see
whether there are significant differences depending on the way the tree forest regeneration method.
Within the country there is such a drive to plant more trees. This project will assess the carbon
sequestration within each forest type, comparing the carbon sequestration capacity within each type.
This will give valuable information as to whether it is more important to invest more resources into
preserving old growth areas instead.
The project will compare tree density between sites, as well as vegetation cover and canopy cover.
Statistical analysis will be used to compare between sites to see whether the differences in the results
are significantly different and will reject the null hypotheses created.
1.4 - Project objectives
To see whether there is a difference between carbon storage within planted, naturally regenerated,
and old growth forest. Is there are a difference as to how much carbon a tree can sequester in each
of these habitats.
To compare the amount of light penetrating the canopy in each plot and see whether there is a
correlation with the amount of ground vegetation cover.
To assess the 3 chosen forest types and to understand where they differ.
21.5 - Hypotheses
1) H0: Tree density will not differ significantly across the 3 forest types
H1: Tree density will be significantly different across the 3 forest types
2) H0: Ground vegetation cover will not differ significantly across the 3 forest types
H1: Ground vegetation cover will be significantly different across the 3 forest types
3) H0: Canopy cover will not differ significantly across the 3 forest types
H1: Canopy cover will be significantly different across the 3 forest types
4) H0: Above ground biomass will not differ significantly across the 3 forest types
H1: Trees in the old growth forest will have significantly more above ground biomass than the
other forest types
5) H0: Carbon sequestration will not differ significantly across the 3 forest types
H1: Trees in the old growth forest will store significantly more carbon than the other forest
types
36) H0: The amount of light penetrating the canopy and the percentage of ground vegetation
cover will not be significantly different
H1: Ground vegetation cover will be significantly higher with more light penetrating the
canopy
2 - Literature review
2.1 - Carbon sinks
Carbon sequestration in forests is key to combatting the ever more apparent threat that climate
change poses. Forests store approximately 862 Gt of carbon globally. It is stored in dead and alive
trees, as well as below ground in the roots and soil. Roughly 42% of it is stored in live biomass (Pan,
2011). The biomass within tropical forests plays an extremely important role when it comes to
regulating the carbon content in the earth’s atmosphere (Malhi, 2006). The potential carbon
sequestration in older, closed canopy forests with taller trees is much larger than that within an open
forest with smaller trees (Wright, 2012). It is evident from research that old growth forests and the
larger trees within them are vital components in the carbon cycle. It is expected to see the old growth
forests in this project having a higher carbon content too. This will back up Wright’s findings and will
give extra evidence to support the results in this project.
2.2 - Old growth
A report by Muller-Landau in 2006 stated that the old growth forests today have a lower density of
larger trees. This statement dates back 15 years now so the figures may have improved since then.
The importance of larger trees when sequestering carbon is well researched. There potential carbon
content is significantly higher than forests that have smaller trees (Mildrexler, 2020). Mildrexler’s
results are comparable to that of Wrights too, they both show that the larger trees are much more
efficient in carbon sequestration. The paper by Mildrexler investigates larger trees and assesses the
benefits they provide, the study area of this project was in North America therefore it is not tropical
forestry, however the premise remains the same. Another paper by Sist, written in 2014, looked at
the other impacts of large trees apart from the carbon they sequester. These old growth forests have
4microclimates (Vanwalleghem, 2009) and they play an integral role in the functioning of the
ecosystem. The larger trees in the old growth provide habitat for animals too as well as curbing an
influx of weedy invasive species from colonising the understory (Sist, 2014).
2.3 - Vegetation cover vs canopy cover
In a paper by Wright, he states that experimental manipulations of Ca will often cause a short-term
increase in plant function. This is to be expected when there is an increase of carbon content,
vegetation cover will flourish. The increase of vegetation cover can lead to a reduction in species
richness and diversity as well as lessening local tree populations (Smith 1994; Mullet 1995; Holmes
1997). This can lead to a more open forest which, as Wright mentioned earlier, has much lower carbon
sequestration potential. These papers are fairly dated however the findings presented are still
relevant. Wright also mentions the importance of closed canopy forests, saying they are generally
much more effective in carbon storage. This may not be a direct result of canopy cover however the
way a forest is built up to create a dense canopy can often be a sign of a natural, undisturbed
environment.
2.4 - Tropical forests reacting to climate change
Trees are vital in locking up carbon dioxide, but is it also affecting the trees? In a paper by Phillips
2014, he says that an Asian (Slik, 2010) and an African (Lewis, 2013) forest in general stores roughly
30% more biomass per hectare in comparison to a ‘common’ forest found in the Amazon. Not to
mention the variation of forests within the Amazon is massive (Laurance, 2009). However, Asian and
Amazon forests have approximately 40% greater density of trees with a DBH higher than 10cm in
comparison to African forests. This shows that across the globe, countries that have drastically
different environments create forests that are so different in structure. Therefore, the possibility that
biomass in the tropics has increased on a tree-to-tree basis because of carbon content increasing, is
not so absurd. What can be deduced from this is that forests have drastically different structures
across the planet, there are hundreds of variables influencing this, atmospheric carbon content is most
definitely a factor. Is it directly increasing biomass in the tropics? Phillips has implied that there is a
possible positive correlation. As atmospheric carbon content has increased worldwide, it appears that
trees in the tropics have seen an increase in biomass too (Phillips, 2014).
52.5 - Planted vs natural regeneration
It is important to compare the planted areas and natural regenerated areas of forest. A paper by
Ackzell written in 1993, shows the differences between planting and natural regenerated Pinus
sylvestris in Sweden. His results showed the differences between survival rates and assessed the form
the trees took, he seemed to be assessing the best method with the intention of felling the trees for
timber. It is interesting to compare his results with this project however the aims of this project are
different to his, this project is assessing with environmental goals at the forefront as a pose to his
timber orientated aims. Ackzell found that in the natural regeneration areas there was a lot of
competition, often there is a continuous establishment of seedlings trying to grow (Hagner, 1965)
(Saarenmaa,1990). This would lead to only a few trees gaining maturity, however these trees
appeared to have a great form (for timber) due to the density of the forest around them (Ackzell,
1993).
Planted trees can sometimes have root problems (root deformation) due to being stored in plant pots
(Amoroso, 2010). However, Ackzell saw that with he planted trees they had a low mortality rate in the
forest in comparison to the natural regeneration (Ackzell, 1993). This could be due to the natural
regeneration areas having so much competition. It will be interesting to see the difference between
tree density in the natural regenerated and planted areas of forest and to compare the above ground
biomass within each. To confirm Ackzell’s results, it would be assumed that the natural regenerated
areas will have a higher tree density than the planted.
3 - Materials and methods
3.1 - Study area
The study area for this project is Cloudbridge nature reserve in Costa Rica. As shown in figure 1, the
reserve is situated in the Talamanca mountain range in the province of San Jose. It is a private nature
reserve ranging from altitudes of 1500 to 2200 metres. The reserve was established in 2002 with the
intention of conserving the old growth forest already there as well as reforesting the areas that were
felled for farming. The reserve has 70 acres of old growth forest which is situated in the highest points
of the reserve, the parts lower down are all reforested areas either by natural regeneration or planted.
The reserve has always been focused on education and research, it has had many researchers come
6through studying mammals, birds, trees, reptiles etc. They promote sustainable tourism, information
on climate change, habitat for wildlife and ensure that visitors are educated on cloud forests and
understand their importance.
Figure 1. Map of Costa Rica showing the location of Cloudbridge nature reserve.
9 plots were chosen throughout the reserve within 3 different forest types. 3 plots were situated in
each forest type. The forest types are as follows; natural regenerated, planted, and old growth. Each
plot has a wooden stake marking the centre with a 12.5 metre circular radius.
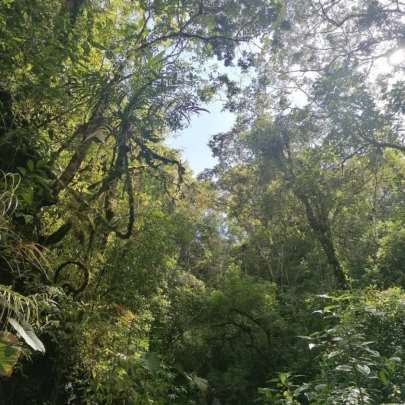
3.2 - Tree numbering
The DBH of each tree was measured in all plots. All trees with a DBH greater than 5cm were included.
All included trees were assigned a tree tag with an individual number for reference. The tree tag was
attached using a hammer and nails at the same height where the DBH was recorded.
73.2 – DBH
A bamboo cane was used to determine the height at which the DBH was measured. 1.37 metres from
ground level is the generic place to measure a trees DBH, therefore this is the height used in this study.
1.37 metres was marked on the bamboo to allow for fast acquisition of DBH. The bamboo was placed
parallel to the main stem of the tree. The DBH is then measured using a DBH tape. If the tree is on a
slope, the bamboo stick is placed on the upslope. For multi-stem trees, the main stem is recorded first,
then the stem immediately to the left, continuing in an anti-clockwise direction making sure all stems
are measured. If there is an abnormal growth at 1.37 metres, the DBH was measured just below the
growth. All measurements are recorded and written down in a notebook.
3.3 - Crown class
All trees were ranked and put into a crown class from 1 – 4. Figure 2 gives a visual guide as to how the
trees were allocated a class.
• 1 (green) – Dominant trees, the highest in the canopy, their crowns receive 80% or more of
full sunlight
• 2 (orange) – Codominant trees, the second highest, their crowns are intertwined with other
neighbouring trees, they receive 50 – 80% sunlight
• 3 (red) – Intermediate trees, these are below other trees, they receive 20 – 50% sunlight
• 4 (blue) – Suppressed trees, they are ground story trees that receive very little sunlight, 20%
and below
Figure 2. Crown class diagram.
83.4 - Living status
The living status of all trees was noted, each tree was given a 0 if dead or a 1 if alive.
3.5 - Tree heights
To measure the tree heights the help of someone is needed. A bamboo stick with a marking at the eye
height of the person using the clinometer is placed against the tree. The same as when measuring the
DBH. One person holds the tape measure up to the bamboo stick where the eye height marking is.
The other person goes at least 10 metres back from the tree, ensuring they are above the eye height,
but below the top of the canopy of the tree. Once in a suitable position that fits the criteria, the person
with the clinometer reads off 2 angles. Angle A is the angle from the persons eye height with the
clinometer looking at the eye height marking on the bamboo stick. Angle B is the angle from the user’s
eyes to the upper most part of the canopy of the tree. If the tree is exceptionally tall it is necessary to
go back as far as possible to gain a more accurate reading, however at least 10 metres applies for all
trees. The measurements needed to calculate tree height are the distance from user to the tree, angle
A, angle B and the eye height of the user of the clinometer.
3.6 - Canopy cover and ground vegetation cover
A densitometer was used to gather canopy closure
readings at 5 points in each plot. Once in the centre,
then 8 metres from the centre in each cardinal
direction. At each point 4 readings are taken with the
densitometer facing each of the four cardinal
directions. As shown in figure 3, a 1m squared quadrat
is placed at each point in the plot where the
densiometer is used (5 per plot in total). A picture of
the quadrat is taken for analysis later to estimate the
percentage of ground vegetation cover. By doing this it
shows whether there is a relationship between the
amount of light penetrating the canopy and the
amount of vegetation on the floor.
Figure 3. Quadrat displaying the ground vegetation coverage.
93.6 - Tree coring
Core samples were taken from all trees. First the DBH of the
tree is measured, this is then halved to get the radius. As
shown in figure 4, an increment borer was used to drill into the
tree to collect a radius size core sample from the tree. Once
the sample has been removed from the tree it is placed into a
straw to protect it, shown in figure 5. The increment borer is
cleaned with a light oil after every sample is taken to prevent
passing disease from tree to tree.
Figure 4. Using an increment borer to remove a
core sample.
Figure 5. Putting the core sample into a straw.
103.7 - Lab work
Each core sample is separated into at least 2 pieces. The sample is broken at all points where the
sample changes colour or looks different to the rest of the sample as this could indicate a change in
density. The innermost section of the sample is section A, then all proceeding sections are labelled in
alphabetical order. All sections are measured, and the lengths are noted down. All subsections from
the sample are put into their own labelled oven proof container. Each container is then filled up with
water and left for 24 hours. After 24 hours, each subsection is weighed using the water displacement
method (Chave 2005) to find the wet weight of each sample, this is shown in figure 6.
Figure 6. Water displacement method (Chave, 2005).
Next the samples are put back into their labelled containers without the water and are left to air dry
for at least 2 days. Then they are weighed again before going in the oven at a low temperature. They
are removed and weighed after 2 hours, then after every hour in the oven they are weighed again.
This process continues until the weight of the sample matches one of the samples previously recorded
weights. This final number is the oven dry weight which will be used with the wet weight to find out
the wood specific gravity. Next, the above ground biomass (AGB) is calculated for each tree. Finally,
the amount of carbon dioxide stored in the AGB of each tree is calculated.
114 - Results
The results in this section are for each variable. The results show the means and whether there are
any significant differences between forest types. Post hoc tests were used when trying to determine
specifically where the significant result came from. Correlation was used when necessary, to
determine the relationship between 2 variables. Regression was then used to see how one of these
variables could affect the other.
Below are some of the graphs created, they provide a visual aid for comparing the forest types
between each other. The tables show figures such as the standard deviation and all figures in bold are
results that are significantly different. These graphs and tables have been created to analyse the
statistics to see any relationships and patterns between the forest types.
4.1 - Tree density
Table 1. Summary of the mean, standard deviation, standard error, and the significant difference (p value) for
tree density between planted, natural regeneration and old growth forest.
Independent Standard Standard
variable deviation error Mean
(forest type)
Planted 4.041 2.333 47.667
Natural 4.041 2.333 62.333
Regeneration
Significant
difference
Old growth 10.017 5.783 65.667 (p value)
.035
A one-way ANOVA test was used to gather these results. The test showed that there is a statistically
significant difference between the means of tree density within each forest type.
12Figure 7. Comparison of mean tree density between planted, natural regeneration and old growth forest. The
standard error bars show a 95% confidence interval.
Figure 7 shows that the old growth forest has the highest mean tree density of 65.667. Then the
natural regeneration area was close second with a mean of 62.333. The planted forest has a mean of
47.667 which is the lowest.
Due to the one-way ANOVA test showing a significant difference, a post hoc Tukey test was then used
to determine where the differences occurred between the forest types. The test showed that the
planted forest and old growth forest had a p value of .037 which is significantly different. There were
no other statistically significant differences between forest types for tree density.
134.2 - Ground vegetation cover
Table 2. Summary of the mean, standard deviation, standard error and the significant difference (p value) for
percentage of ground vegetation cover between planted, natural regeneration and old growth forest.
Independent Standard Standard
variable deviation error Mean
(forest type) (%)
Planted 37.395 9.655 33.733
Natural
Regeneration 8.239 2.127 9.800
Significant
difference
Old growth 22.037 5.690 26.067 (p value)
.041
A one-way ANOVA test was used to gather these results. The test showed that there is a statistically
significant difference between the means of ground vegetation cover within each forest type.
14Figure 8. Comparison of mean percentage of ground vegetation cover between planted, natural regeneration
and old growth forest. The standard error bars show a 95% confidence interval.
Figure 8 shows that the planted forest has the highest amount of ground vegetation cover with a mean
of 33.733. Next the old growth forest has a mean of 26.067. Finally, the natural regenerated areas of
forest have the lowest ground vegetation cover with a mean of 9.800.
A post hoc Tukey test was then carried out to determine what forest types had significantly different
results from one another. The planted and natural regenerated forest showed statistically significant
results with a p value of .036. There were no other statistically significant differences found for ground
vegetation cover between forest types.
154.3 - Canopy cover
Table 3. Summary of the mean, standard deviation, standard error and the significant difference (p value) for
percentage of canopy cover between planted, natural regeneration and old growth forest.
Independent Standard Standard
variable deviation error Mean
(forest type) (%)
Planted 6.478 1.673 11.475
Natural 3.723 .961 7.716
Regeneration
Significant
difference
Old growth 6.933 1.790 9.829 (p value)
.227
A one-way ANOVA test was used to gather these results. The test showed that there is not a
statistically significant difference between the means of canopy cover in each forest type.
16Figure 9. Comparison of mean percentage of canopy cover between planted, natural regeneration and old
growth forest. The standard error bars show a 95% confidence interval.
Figure 9 shows that the planted forest has the highest mean percentage canopy cover of 11.475%.
The old growth had the second highest mean that was 9.829%. Finally, the Natural regenerated forest
areas had the lowest mean canopy cover, it was 7.716%.
The one-way ANOVA test showed no significant differences between any of the forest types, this
negated the need to perform a post hoc tukey test.
174.4 - Above ground biomass (AGB)
Table 4. Summary of the mean, standard deviation, standard error and the significant difference (p value) for
above ground biomass (cm3) between planted, natural regeneration and old growth forest.
Independent Standard Standard
variable deviation error Mean
(forest type)
Planted 17.237 2.438 38.418
Natural 18.476 2.613 39.769
Regeneration
Significant
difference
Old growth 11.402 1.613 50.692 (p value)
.000
A one-way ANOVA test was used to gather these results. The test showed that there is a statistically
significant difference between the means of Above ground biomass in each forest type.
18Figure 10. Comparison of mean above ground biomass (cm3) between planted, natural regeneration and old
growth forest. The standard error bars show a 95% confidence interval.
Figure 10 shows that the old growth forest has the highest mean above ground biomass of 38.418.
Then the natural regenerated areas have a mean of 39.769. Finally, the planted forest has the lowest
mean above ground biomass of 38.418.
A post-hoc tukey test was used to find what forest types had statistically significant differences. It
showed that the planted and old growth areas had a p value of .001. The natural regenerated and the
old growth areas had a p value of .002. The old growth has significantly different above ground
biomass than both the planted and natural regenerated areas.
194.5 - Carbon dioxide
Table 5. Summary of the mean, standard deviation, standard error and the significant difference (p value) for
carbon stored in above ground biomass between planted, natural regeneration and old growth forest.
Independent Standard Standard
variable deviation error Mean
(forest type)
Planted 8.102 1.146 18.057
Natural 8.684 1.228 18.691
Regeneration
Significant
difference
Old growth 8.359 .758 23.825 (p value)
.000
A one-way ANOVA test was used to gather these results. The test showed that there is a statistically
significant difference between the means of AGB carbon content in each forest type.
20Figure 11. Comparison of mean carbon content stored in above ground biomass between planted, natural
regeneration and old growth forest. The standard error bars show a 95% confidence interval.
Figure 11 shows that the old growth forest has the highest mean carbon content stored in AGB being
23.25. The natural regenerated areas only just have the second highest mean carbon content of
18.691. The planted areas have the least, with a mean content of 18.057.
A post hoc tukey test was used to see specifically what forest types had significant differences. It
showed that the planted and old growth forest had a p value of .001. The natural regenerated and old
growth forest had a p value of .002. There was no significant difference between planted and natural
regeneration.
214.6 - Crown class
Figure 12. Comparison of crown class ratings between planted (left), natural regenerated (middle) and old
growth (right) forest. The standard error bars show a 95% confidence interval level.
Figure 12 shows that the old growth had the most trees in class 4 (less than 20% sunlight). The old
growth also had only a few trees in class 1 (Over 80% sunlight). The planted and natural regeneration
areas had more sporadic results.
4.7 - Correlation and Regression
Table 6. Summary of standard deviation and means for percentage of vegetation and canopy cover.
N Standard deviation Mean
Vegetation cover 45 26.887 23.200
Canopy cover 45 5.956 9.673
A bivariate Pearson correlation test was used to see whether there was a statistically significant linear
relationship between the percentage of canopy cover and the percentage of ground vegetation cover.
A 2-tailed test was used to test for the possibility of positive or negative differences. The test gave a
value of .055 which is not significant.
22Figure 13. Scatter diagram with linear regression line showing the relationship between percentage of vegetation
cover and canopy cover.
The linear regression line in Figure 13 shows that an increase of canopy cover (more light coming
through the canopy) leads to an increase of ground vegetation cover. However, the difference
between this is not statistically significant as shown in the previous correlation test.
5 - Discussion
It is important to gather a variation of measurements within each forest type. The results were
collated and the differences between the forest types are now shown in graphs so that anyone can
see and understand the results. Post hoc tests were used to test whether there were significant
differences between the sites. The following section will look more into the possibilities as to why the
results showed what they did and to discuss the potential reasons that influenced the results. This
section will also reject the null, or accept the alternative hypotheses created.
235.1 - Tree density
When the mean tree density within each forest type was compared it was evident that the old growth
and natural regenerated areas had higher densities. These results show that the 2 forest types that
grew of their own accord (not planted) had more trees within them. Figure 7 shows there is a higher
density of trees in these areas however the overall size of them which can make a big difference to
the overall forest structure is not displayed. These were the first results calculated before looking in
depth into the individual trees and how they influence the surrounding forest type. The results found
can confirm what was stated in Ackzell’s paper that the natural regenerated areas have a higher
density. This is only likely for when the forest is young, in this case the natural regenerated areas and
the planted areas are both 20 years of age. There is more competition in the natural regenerated areas
so when the trees start to get more mature, they will eventually start to outcompete each other, and
the more favourable trees will succeed (Ackzell, 1993). With this data, the 1st alternative hypotheses
can be accepted due to there being a significant difference between the planted and old growth forest.
5.2 - Ground vegetation cover
Figure 8 showed the planted forest had the highest percentage of vegetation cover. This could be due
to there being the lowest tree density within the planted areas. This confirms what was mentioned in
the literature review, we can see there is the lowest number of trees within the planted forest, and it
also has the highest percentage of vegetation cover (Sist, 2014). As there are not as many trees there
is more space on the ground where vegetation can grow, there will not be as much competition from
the tree’s roots when competing for water and nutrients. The results show that the 2nd alternative
hypotheses can be accepted due to planted being significantly different to natural regeneration.
5.3 - Canopy cover
Canopy cover would imply that the measurements are showing the percentage of tree / branch in the
canopy. However, canopy cover is the term used to show the percentage of overhead area that is not
occupied by the canopy e.g., how much light is penetrating the canopy. Figure 9 showed that the
planted area had the highest canopy cover (the most light penetrating the canopy). This contradicts
the statement previously made that closed canopy forests store the most carbon (Wright, 2012) as
the planted area stored the least amount of carbon but had the highest canopy cover. This will be due
to the old growth having much larger trees (Mildrexler, 2020). The graph, when put next to the ground
24vegetation cover graph, showed that there was an obvious relationship. The more light that
penetrated the canopy showed a higher percentage of vegetation cover. This was to be expected
however the graphs can confirm that this is the case. The results show that the 3 rd null hypotheses
cannot be rejected due to their being no significant differences between the forest types.
5.4 - Above ground biomass
Figure 10 showed the above ground biomass was highest within the old growth forest as expected
when analysing literature (Mildrexler, 2020) (Wright, 2012) (Sist, 2014). The old growth was the
densest forest type, it also had the largest trees. Some of the large trees within the old growth grew
to 60 metres tall and had diameters of up to 15 metres. In some plots there would only be one or 2
trees of this form due to the small size of the plots, however, it would still have a massive influence
on the total above ground biomass per plot. The plots were the same size within each forest type, it
is interesting to see the influence of the larger trees on the results within the same size area. Due to
the presence of these massive trees in the old growth, this forest type is significantly different from
the planted and the natural regenerated areas. Therefore the 4th alternative hypotheses can be
accepted.
5.5 - Carbon dioxide
Similarly, to the above ground biomass, figure 11 showed the old growth forest stored the most
amount of carbon dioxide. For the same reasons previously mentioned, the large trees in the old
growth play a massive role in carbon sequestration. They drastically change the forest structure by
increasing the amount of carbon stored (Mildrexler, 2020). The old growth showed results that were
significantly different to the other two forest types therefore the 5th alternative hypotheses was
accepted.
5.6 - Crown class
When analysing figure 12, the old growth forest type has the most varied results. It has a massive
number of trees that have a crown class of 4 (less than 20% sunlight), and a very small number of trees
that have over 80% sunlight. As previously mentioned, some of the trees in this forest type are
25significantly large than the others and therefore prohibit much of the sunlight from reaching the other
trees’ canopies.
5.7 - Correlation and regression
Correlation and regression were only used to compare the vegetation and canopy cover. 5 places in
each plot were used to take both these measurements therefore the results would be good to
compare as they were taken from the exact same locations each time. They were tested for correlation
however there was no significant difference between these 2 variables. This meant that the null
hypotheses cannot be rejected. Figure 13 shows a scatter plot with a linear regression line that was
created. It shows a weak positive correlation between the variables. However, in this instance it is not
significant. This could be due to multiple variables that were not taken into consideration. Firstly,
animal presence may be higher in some areas leading to more animals consuming the ground
vegetation. Also, soil variation in the tropics is massive, it changes drastically from valley to valley
(Richter, 1991). This soil variation will vary from plot to ploy which could have influenced the amount
and species of vegetation able to grow. Neither of these variables were measured therefore this could
have influenced these results and led to there being an insignificant difference between these two
variables.
266 – Conclusions
In conclusion, the old growth forest appeared to be in the best condition. It had a mix of small and
large trees, providing habitats for
different animals. It also stored the
most carbon by a long way due to the
amount of above ground biomass in
the larger trees. The old growth
forest is arguably the most
aesthetically pleasing part of the
reserve too. It is the most diverse
area, full of epiphytes and mosses
that cover the trees. However, this is
just an opinion, as aesthetical value
is personal and cannot be measured.
A picture of the old growth is shown
in figure 14.
Figure 14. The old growth forest in Cloudbridge Nature Reserve.
This project has really made clear and displayed the importance of preserving old growth forests. The
literature that was studied before undertaking this project all stated how important old growth forest
is in the battle against climate change (Slik, 2014) (Mildrexler, 2020) (Vanwalleghem, 2009) (Sist, 2014)
(Pan, 2011) to name a few. It seemed overwhelmingly obvious before starting that more focus should
be put into preserving our old growth forest and not allowing them to be overexploited of their assets
for financial gain. The environmental benefits they provide are essential for human’s survival on earth.
Not to mention for the animals that live in forests that rely on these ecosystems to survive (Godoy,
1993).
This project set out to assess the differences between planting and natural regenerating. This was one
of the aims stated at the beginning. They were assessed however the differences between them were
not significant enough in most cases to draw any substantial conclusions.
This project met the aims and objectives that were stated at the beginning and tested all the
hypotheses that were created. The results show the differences between each forest type, and then
27the results were analysed using the correct statistical analyses to understand whether the null
hypotheses created earlier could be rejected.
6.1 - Future recommendations
For the future, it would be interesting to study the soil within the sites. To try and understand the
importance of soils in a tropical montane cloud forest and their carbon dioxide storage. A comparison
of old growth and natural regenerated / planted would show interesting results. The old growth has
more carbon stored in the above ground biomass; it would be interesting to see whether this would
influence the amount of carbon stored underground too?
Soils are just as important to study as above ground biomass. Drought within the tropics can increase
the amount of carbon dioxide lost to the atmosphere (Cleveland, 2010). Costa Rica is already feeling
the effects of climate change, with less rainfall every year being projected (Castillo, 2018).
Different sites should be analysed to and compared to this data. For example, sites that are lower
down e.g., altitude less than 500m to see whether the altitude has an impact on carbon storage? With
this data, the differences between low land and montane cloud forests can be compared to see which
area is more efficient at sequestering carbon dioxide.
287 - Reference list
Ackzell, L., 1993. A comparison of planting, sowing and natural regeneration for Pinus sylvestris (L.)
in boreal Sweden. Forest Ecology and Management, 61(3-4), pp.229-245.
Amoroso, G., Frangi, P., Piatti, R., Ferrini, F., Fini, A. and Faoro, M., 2010. Effect of container design
on plant growth and root deformation of littleleaf linden and field elm. HortScience, 45(12), pp.1824-
1829.
Castillo, R., Amador, J. and Durán, A.M., 2017. Costa Rica rainfall in future climate change scenarios.
Cleveland, C.C., Wieder, W.R., Reed, S.C. and Townsend, A.R., 2010. Experimental drought in a
tropical rain forest increases soil carbon dioxide losses to the atmosphere. Ecology, 91(8), pp.2313-
2323.
Chave, J., Andalo, C., Brown, S., Cairns, M.A., Chambers, J.Q., Eamus, D., Fölster, H., Fromard, F.,
Higuchi, N., Kira, T. and Lescure, J.P., 2005. Tree allometry and improved estimation of carbon stocks
and balance in tropical forests. Oecologia, 145(1), pp.87-99.
Embajada de Costa Rica 2021, Costa Rica Embassy, Viewed 18 March 2021, http://www.costarica-
embassy.org/index.php?q=node/12
FAO 2015, Costa Rica Case Study, viewed 22 March 2021, http://www.fao.org/3/c0180e/c0180e.pdf
Godoy, R.A. and Bawa, K.S., 1993. The economic value and sustainable harvest of plants and animals
from the tropical forest: assumptions, hypotheses, and methods. Economic botany, 47(3), pp.215-
219.
GVI 2020, Cost Rica is going carbon neutral and plastic free, and you can help, viewed 26 March
2021, https://www.gvi.co.uk/blog/costa-rica-is-going-carbon-neutral-and-plastic-free-and-you-can-
help/
Hagner, S., 1965. Yield of seed, choice of seed trees and seedling establishment in experiments with
natural regeneration, Studia For. Suec. 27: 43 pp. Swedish with English summary.
Holmes, P.M. and Cowling, R.M., 1997. The effects of invasion by Acacia saligna on the guild
structure and regeneration capabilities of South African fynbos shrublands. Journal of Applied
Ecology, pp.317-332.
29IDB 2020, Costa Rica advances with its National Decarbonization Plan with IDB support, viewed 28
March 2021, https://www.iadb.org/en/news/costa-rica-advances-its-national-decarbonization-plan-
idb-support
Jobbágy, E.G. and Jackson, R.B., 2000. The vertical distribution of soil organic carbon and its relation
to climate and vegetation. Ecological applications, 10(2), pp.423-436.
Joseph Wright, S., 2013. The carbon sink in intact tropical forests. Global Change Biology, 19(2),
pp.337-339.
Laurance, S.G., Laurance, W.F., Nascimento, H.E., Andrade, A., Fearnside, P.M., Rebello, E.R. and
Condit, R., 2009. Long‐term variation in Amazon forest dynamics. Journal of Vegetation
Science, 20(2), pp.323-333.
Lewis, S.L., Sonké, B., Sunderland, T., Begne, S.K., Lopez-Gonzalez, G., Van Der Heijden, G.M., Phillips,
O.L., Affum-Baffoe, K., Baker, T.R., Banin, L. and Bastin, J.F., 2013. Above-ground biomass and
structure of 260 African tropical forests. Philosophical Transactions of the Royal Society B: Biological
Sciences, 368(1625), p.20120295.
Malhi, Y., Wood, D., Baker, T.R., Wright, J., Phillips, O.L., Cochrane, T., Meir, P., Chave, J., Almeida, S.,
Arroyo, L. and Higuchi, N., 2006. The regional variation of aboveground live biomass in old‐growth
Amazonian forests. Global Change Biology, 12(7), pp.1107-1138.
Mildrexler, D.J., Berner, L.T., Law, B.E., Birdsey, R.A. and Moomaw, W.R., 2020. Large Trees
Dominate Carbon Storage in Forests East of the Cascade Crest in the United States Pacific
Northwest. Frontiers in Forests and Global Change, 3, p.127.
Muller-Landau, H.C., Detto, M., Chisholm, R.A., Hubbell, S.P. and Condit, R.I.C.H.A.R.D., 2014.
Detecting and projecting changes in forest biomass from plot data. Forests and global change, 17,
pp.381-416.
Mullett, T. and Simmons, D., 1995. Ecological impacts of the environmental weed sweet pittosporum
(Pittosporum undulatum Vent.) in dry sclerophyll forest communities, Victoria. Plant Protection
Quarterly, 10, pp.131-138.
Pan, Y., Birdsey, R.A., Fang, J., Houghton, R., Kauppi, P.E., Kurz, W.A., Phillips, O.L., Shvidenko, A.,
Lewis, S.L., Canadell, J.G. and Ciais, P., 2011. A large and persistent carbon sink in the world’s
forests. Science, 333(6045), pp.988-993.
Phillips, O.L. and Lewis, S.L., 2014. Evaluating the tropical forest carbon sink. Global change
biology, 20(7), pp.2039-2041.
30Richter, D.D. and Babbar, L.I., 1991. Soil diversity in the tropics. Advances in ecological research, 21,
pp.315-389.
Saarenmaa, L., 1990. Choice of reforestation method in Finnish Lapland based on an expert
system. Folia Forestalia, (762).
Schlesinger, W.H. and Andrews, J.A., 2000. Soil respiration and the global carbon
cycle. Biogeochemistry, 48(1), pp.7-20.
Sist, P., Mazzei, L., Blanc, L. and Rutishauser, E., 2014. Large trees as key elements of carbon storage
and dynamics after selective logging in the Eastern Amazon. Forest Ecology and Management, 318,
pp.103-109.
Slik, J.W.F., Aiba, S.I., Brearley, F.Q., Cannon, C.H., Forshed, O., Kitayama, K., Nagamasu, H., Nilus, R.,
Payne, J., Paoli, G. and Poulsen, A.D., 2010. Environmental correlates of tree biomass, basal area,
wood specific gravity and stem density gradients in Borneo's tropical forests. Global ecology and
biogeography, 19(1), pp.50-60.
Standish, R.J., Robertson, A.W. and Williams, P.A., 2001. The impact of an invasive weed
Tradescantia fluminensis on native forest regeneration. Journal of Applied Ecology, 38(6), pp.1253-
1263.
Tarnocai, C., Canadell, J.G., Schuur, E.A., Kuhry, P., Mazhitova, G. and Zimov, S., 2009. Soil organic
carbon pools in the northern circumpolar permafrost region. Global biogeochemical cycles, 23(2).
The Guardian 2019, Costa Rica unveils plan to achieve zero emissions by 2050 in climate change
fight, viewed 24 March, https://www.theguardian.com/world/2019/feb/25/costa-rica-plan-
decarbonize-2050-climate-change-fight
Vanwalleghem, T. and Meentemeyer, R.K., 2009. Predicting forest microclimate in heterogeneous
landscapes. Ecosystems, 12(7), pp.1158-1172.
31You can also read