DEEP LEARNING MEETS PROJECTIVE CLUSTERING
←
→
Page content transcription
If your browser does not render page correctly, please read the page content below
Published as a conference paper at ICLR 2021

D EEP L EARNING M EETS P ROJECTIVE C LUSTERING
 Alaa Maalouf ∗ 1 , Harry Lang∗ 2 , Daniela Rus2 & Dan Feldman1
 1
   Robotics & Big Data Labs, Department of Computer Science, University of Haifa
 2
   CSAIL, MIT
 alaamalouf12@gmail.com, harry1@mit.edu,
 rus@csail.mit.edu, dannyf.post@gmail.com

                                                A BSTRACT
              A common approach for compressing Natural Language Processing (NLP) net-
              works is to encode the embedding layer as a matrix A ∈ Rn×d , compute its
              rank-j approximation Aj via SVD (Singular Value Decomposition), and then fac-
              tor Aj into a pair of matrices that correspond to smaller fully-connected layers
              to replace the original embedding layer. Geometrically, the rows of A represent
              points in Rd , and the rows of Aj represent their projections onto the j-dimensional
              subspace that minimizes the sum of squared distances (“errors”) to the points. In
              practice, these rows of A may be spread around k > 1 subspaces, so factoring A
              based on a single subspace may lead to large errors that turn into large drops in
              accuracy.
              Inspired by projective clustering from computational geometry, we suggest re-
              placing this subspace by a set of k subspaces, each of dimension j, that minimizes
              the sum of squared distances over every point (row in A) to its closest subspace.
              Based on this approach, we provide a novel architecture that replaces the original
              embedding layer by a set of k small layers that operate in parallel and are then
              recombined with a single fully-connected layer.
              Extensive experimental results on the GLUE benchmark yield networks that are
              both more accurate and smaller compared to the standard matrix factorization
              (SVD). For example, we further compress DistilBERT by reducing the size of the
              embedding layer by 40% while incurring only a 0.5% average drop in accuracy
              over all nine GLUE tasks, compared to a 2.8% drop using the existing SVD ap-
              proach. On RoBERTa we achieve 43% compression of the embedding layer with
              less than a 0.8% average drop in accuracy as compared to a 3% drop previously.

1        I NTRODUCTION AND M OTIVATION
Deep Learning revolutionized Machine Learning by improving the accuracy by dozens of percents
for fundamental tasks in Natural Language Processing (NLP) through learning representations of
a natural language via a deep neural network (Mikolov et al., 2013; Radford et al., 2018; Le and
Mikolov, 2014; Peters et al., 2018; Radford et al., 2019). Lately, it was shown that there is no need
to train those networks from scratch each time we receive a new task/data, but to fine-tune a full
pre-trained model on the specific task (Dai and Le, 2015; Radford et al., 2018; Devlin et al., 2019).
However, in many cases, those networks are extremely large compared to classical machine learning
models. For example, both BERT (Devlin et al., 2019) and XLNet (Yang et al., 2019) have more
than 110 million parameters, and RoBERTa (Liu et al., 2019b) consists of more than 125 million
parameters. Such large networks have two main drawbacks: (i) they use too much storage, e.g.
memory or disk space, which may be infeasible for small IoT devices, smartphones, or when a
personalized network is needed for each user/object/task, and (ii) classification may take too much
time, especially for real-time applications such as NLP tasks: speech recognition, translation or
speech-to-text.

Compressed Networks.       To this end, many papers suggested different techniques to compress
large NLP networks, e.g., by low-rank factorization (Wang et al., 2019; Lan et al., 2019), prun-
     ∗
         equal contribution

                                                       1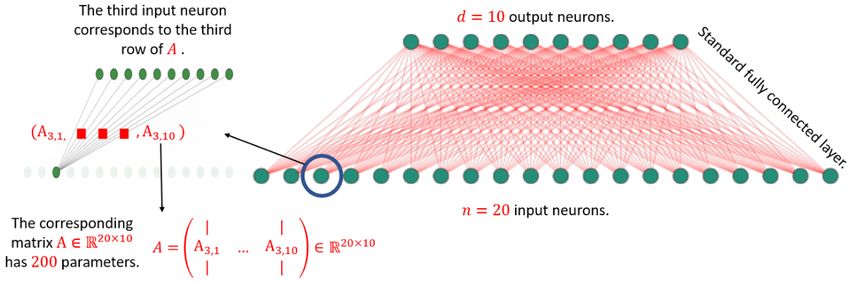
Published as a conference paper at ICLR 2021

Figure 1: A standard embedding (or fully-connected) layer of 20 input neurons and 10 output neu-
rons. Its corresponding matrix A ∈ R20×10 has 200 parameters, where the ith row in A is the vector
of weights of the i neuron in the input layer.

ing (McCarley, 2019; Michel et al., 2019; Fan et al., 2019; Guo et al., 2019; Gordon et al., 2020),
quantization (Zafrir et al., 2019; Shen et al., 2020), weight sharing (Lan et al., 2019), and knowl-
edge distillation (Sanh et al., 2019; Tang et al., 2019; Mukherjee and Awadallah, 2019; Liu et al.,
2019a; Sun et al., 2019; Jiao et al., 2019); see more example papers and a comparison table in Gor-
don (2019) for compressing the BERT model. There is no consensus on which approach should
be used in what contexts. However, in the context of compressing the embedding layer, the most
common approach is low-rank factorization as in Lan et al. (2019), and it may be combined with
other techniques such as quantization and pruning.
In this work, we suggest a novel low-rank factorization technique for compressing the embedding
layer of a given model. This is motivated by the fact that in many networks, the embedding layer
accounts for 20% − 40% of the network size. Our approach - MESSI: Multiple (parallel) Estimated
SVDs for Smaller Intralayers - achieves a better accuracy for the same compression rate compared
to the known standard matrix factorization. To present it, we first describe an embedding layer,
the known technique for compressing it, and the geometric assumptions underlying this technique.
Then, we give our approach followed by geometric intuition, and detailed explanation about the
motivation and the architecture changes. Finally, we report our experimental results that demonstrate
the strong performance of our technique.

Embedding Layer.         The embedding layer aims to represent each word from a vocabulary by a
real-valued vector that reflects the word’s semantic and syntactic information that can be extracted
from the language. One can think of the embedding layer as a simple matrix multiplication as
follows. The layer receives a standard vector x ∈ Rn (a row of the identity matrix, exactly one non-
zero entry, usually called one-hot vector) that represents a word in the vocabulary, it multiplies x by
a matrix AT ∈ Rd×n to obtain the corresponding d-dimensional word embedding vector y = AT x,
which is the row in A that corresponds to the non-zero entry of x. The embedding layer has n input
neurons, and the output has d neurons. The nd edges between the input and output neurons define
the matrix A ∈ Rn×d . Here, the entry in the ith row and jth column of A is the weight of the edge
between the ith input neuron to the jth output neuron; see Figure. 1.

Compressing by Matrix Factorization.          A common approach for compressing an embedding
layer is to compute the j-rank approximation Aj ∈ Rn×d of the corresponding matrix A via SVD
(Singular Value Decomposition; see e.g., Lan et al. (2019); Yu et al. (2017) and Acharya et al.
(2019)), factor Aj into two smaller matrices U ∈ Rn×j and V ∈ Rj×d (i.e. Aj = U V ), and replace
the original embedding layer that corresponds to A by a pair of layers that correspond to U and
V . The number of parameters is then reduced to j(n + d). Moreover, computing the output takes
O(j(n + d)) time, compared to the O(nd) time for computing AT x. As above, we continue to use
Aj to refer to a rank-j approximation of a matrix A.

Fine tuning. The layers that correspond to the matrices U and V above are sometimes used only
as initial seeds for a training process that is called fine tuning. Here, the training data is fed into the

                                                    2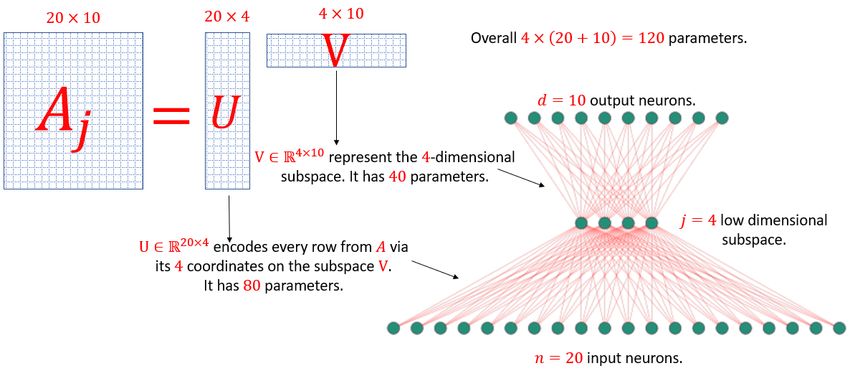
Published as a conference paper at ICLR 2021

Figure 2: Factorization of the embedding layer (matrix) A ∈ R20×10 from Figure 1 via standard
matrix factorization (SVD) to obtain two smaller layers (matrices) U ∈ R20×4 and V ∈ R4×10 .
In this example, the factorization was done based on a 4-dimensional subspace. The result is a
compressed layer that consists of 120 parameters. The original matrix had 200 parameters. See
more details in the figure.

network, and the error is measured with respect to the final classification. Hence, the structure of the
data remains the same but the edges are updated in each iteration to give a better accuracy.
Observe that typically, the SVD takes the form Aj = U DṼ , where the columns of U ∈ Rn×j are
orthogonal, the rows of Ṽ ∈ Rj×d are orthogonal, and D ∈ Rj×j is a diagonal matrix. In this paper
and in others, we say that Aj = U V where V = DṼ . Furthermore, the orthogonalization is used
only to obtain a low rank approximation Aj = U V using SVD. After that, this property is not kept
in the network during the training process (when applying the fine-tuning).

Geometric intuition. The embedding layer can be encoded into a matrix A ∈ Rn×d as explained
above. Hence, each of the n rows of A corresponds to a point (vector) in Rd , and the j-rank
approximation Aj ∈ Rn×d represents the projection on the j-dimensional subspace that minimizes
the sum of squared distances (“errors”) to the points. Projecting these points onto any j-dimensional
subspace of Rd would allow us to encode every point only via its j-coordinates on this subspace,
and store only nj entries instead of the original nd entries of A. This is the matrix U ∈ Rn×j , where
each row encodes the corresponding row in A by its j-coordinates on this subspace. The subspace
itself can be represented by its basis of j d-dimensional vectors (jd entries), which is the column
space of a matrix V T ∈ Rd×j . Figure 2 illustrates the small pair of layers that corresponds to U and
V , those layers are a compression for the original big layer that corresponds to A.
However, our goal is not only to compress the network or matrix, but also to approximate the original
matrix operator A. To this end, among all the possible j-subspaces of Rd , we may be interested in
the j-subspace that minimizes the sum of squared distances to the points, i.e., the sum of squared
projected errors. This subspace can be computed easily via SVD. The corresponding projections of
the rows of A on this subspace are the rows of the j-rank matrix Aj .
The hidden or statistical assumption in this model is that the rows of the matrix A (that represents the
embedding layer) were actually generated by adding i.i.d. Gaussian noise to each point in a set of
n points on a j-dimensional subspace, that is spanned by what are called latent variables or factors.
Given only the resulting matrix A, the j-subspace that maximizes the likelihood (probability) of
generating the original points is spanned by the j largest singular vectors of A.

Why a single distribution?      Even if we accept the assumption of Gaussian noise, e.g. due to
simplicity of computations or the law of large numbers, it is not intuitively clear why we should
assume that the rows of A were sampled from a single distribution. Natural questions that arise are:

                                                   3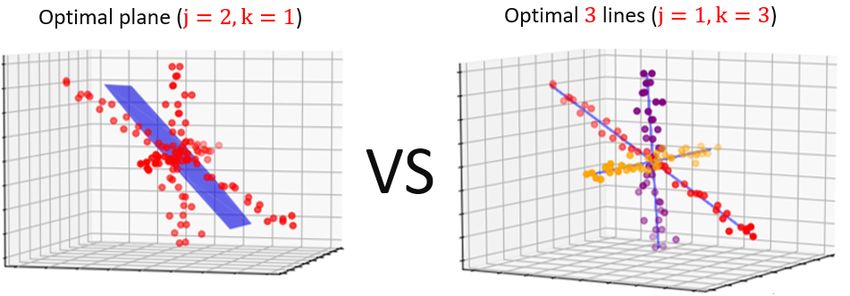
Published as a conference paper at ICLR 2021
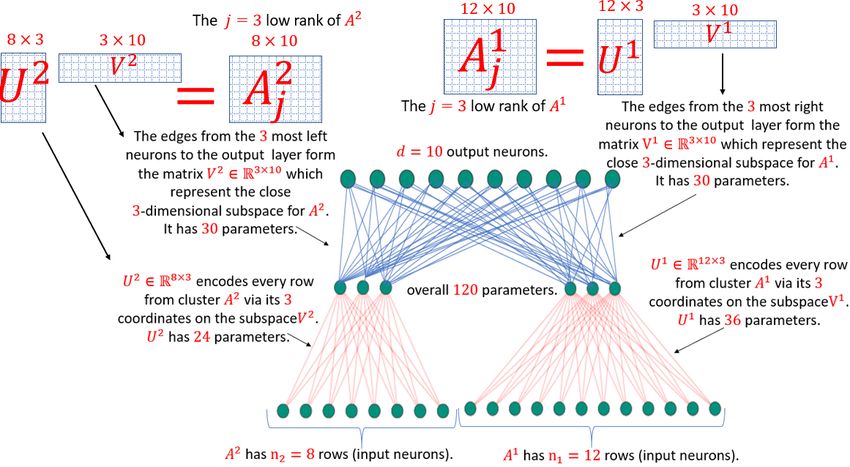
Figure 3: Example of our compression scheme (MESSI) from A to Z. Here j = 3 and k = 2,
and we compress the embedding layer from figure 1: (i) find the set of k = 2 subspaces, each of
dimension j = 3, that minimizes the sum of squared distances from each point (row in A) to its
closest subspace. (ii) Partition the rows of A into k = 2 different subsets A1 and A2 , where two
rows are in the same subset if there closest subspace is the same, (iii) for each subset, factor its
corresponding matrix into two smaller matrices based on its closest subspace to obtain the 2k = 4
matrices U 1 , V 1 , U 2 and V 2 (where for every i ∈ {1, · · · , k}, the matrix U i V i is a low (j = 3)
rank approximation for Ai ), (iii) replace the original fully-connected (embedding) layer by 2 layers,
where in the first (red color) we have k = 2 parallel fully-connected layers for (initialized by) U 1
and U 2 as in the figure, and the second (blue color) is a fully-connected layer with all the previews
k = 2, and its weights corresponds to V 1 and V 2 as follow. For every i ∈ {1, · · · , k}, the weights
form the j = 3 neurons (nodes) that are connected in the previous layer with U i are initialized by
V i . The result is a compressed layer that consists of nj + kjd = 20 × 3 + 2 × 3 × 10 = 120
parameters. See more details in the figure.
(i) Can we get smaller and/or more accurate models in real-world networks by assuming mul-
tiple instead of a single generating distribution (i.e. multiple subspaces)?
(ii) Can we efficiently compute the corresponding factorizations and represent them as part of
a network ?
2 O UR CONTRIBUTION
We answer the above open questions by suggesting the following contributions. In short, the answers
are:
(i) In all the real-world networks that we tested, it is almost always better to assume k ≥ 2
distributions rather than a single one that generated the data. It is better in the sense that
the resulting accuracy of the network is better compared to k = 1 (SVD) for the same
compression rate.
(ii) While approximating the global minimum is Max-SNP-Hard, our experiments show that
we can efficiently compute many local minima and take the smallest one. We then explain
how to encode the result back into the network. This is by suggesting a new embedding
layer architecture that we call MESSI (Multiple (parallel) Estimated SVDs for Smaller
Intralayers); see Figure 3. Extensive experimental results show significant improvement.
4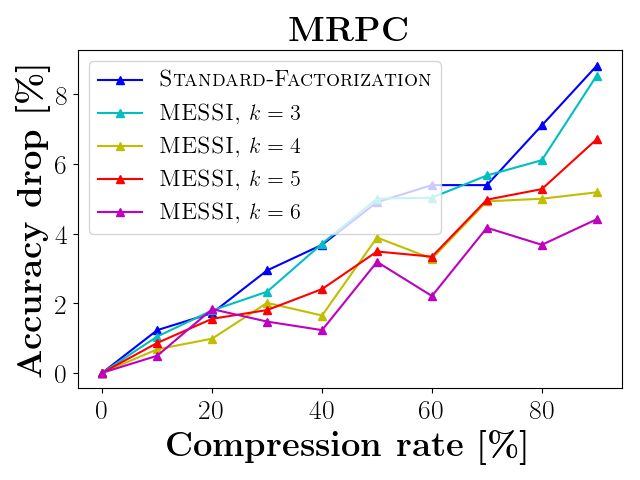
Published as a conference paper at ICLR 2021

Computational Geometry meets Deep Learning.                 Our technique also constructs the matrix
A ∈ Rn×d from a given embedding layer. However, inspired by the geometric intuition from
the previous section, we suggest to approximate the n rows of A by clustering them to k ≥ 2
subspaces instead of one. More precisely, given an integer k ≥ 1 we aim to compute a set of k
subspaces in Rd , each of dimension j, that will minimize the sum over every squared distance of
every point (row in A) to its nearest subspace. This can be considered as a combination of j-rank
or j-subspace approximation, as defined above, and k-means clustering. In the k-means clustering
problem we wish to approximate n points by k center points that minimizes the sum over squared
distance between every point to its nearest center. In our case, the k centers points are replaced by k
subspaces, each of dimension j. In computational geometry, this type of problem is called projective
clustering (see Figure 4), and its used in many tasks in the fields of Machine Learning and Computer
Vision (Feng et al., 2011; Xu et al., 2005; Liu et al., 2012; Trittenbach and Böhm, 2019),

From Embedding layer to Embedding layers. The result of the above technique is a set of k
matrices A1j , · · · , Akj , each of rank j and dimension ni × d where the ith matrix corresponds to the
cluster of ni points that were projected on the ith j-dimensional subspace. Each of those matrices
can be factored into two smaller matrices (due to its low rank), i.e., for every i ∈ {1, · · · , k}, we
have Aij = U i V i , where U i ∈ Rni ×j , and V i ∈ Rj×d . To plug these matrices as part of the final
network instead of the embedded layer, we suggest to encode these matrices via k parallel sub-layers
as described in what follows and illustrated in Figure 3.

Our pipeline: MESSI. We construct our new architecture as follows. We use A to refer to the
n × d matrix from the embedding layer we seek to compress. The input to our pipeline is the matrix
A, positive integers j and k, and (for the final step) parameters for the fine-tuning.

      1. Treating the n rows of A as n points in Rd , compute an approximate (k, j)-projective
         clustering. The result is k subspaces in Rd , each of dimension j, that minimize the sum of
         squared distances from each point (row in A) to its closest subspace. For the approximation,
         we compute a local minimum for this problem using the Expectation-Maximization (EM)
         method (Dempster et al., 1977).
      2. Partition the rows of A into k different subsets according to their nearest subspace from
         the previous step. The result is submatrices A1 , . . . , Ak where Ai is a ni × d matrix and
         n1 + . . . + nk = n.
      3. For each matrix Ai where 1 ≤ i ≤ k, factor it to two smaller matrices U i (of dimensions
         ni × j) and V i (of dimensions j × d) such that U i V i is the rank-j approximation of Ai .
      4. In the full network, replace the original fully-connected embedding layer by 2 layers. The
         first layer is a parallelization of k separate fully-connected layers, where for every i ∈
         {1, · · · , k} the ith parallel layer consists of the matrix U i , i.e., it has ni input neurons and
         j output neurons. Here, each row of A is mapped appropriately. The second layer is by
         combining the matrices V 1 , · · · V k . Each of the k output vectors from the previous layer
         u1 , . . . , uk are combined as V 1 u1 + . . . + V k uk ; see Figure 3 for an illustration.
      5. Fine-tune the network.

The result is a compressed embedding layer. Every matrix U i has ni j parameters, and the matrix
V i has jd parameters. Therefore the compressed embedding layer consists of nj + kjd parameters,
in comparison to the uncompressed layer of nd parameters.

Practical Solution.       The projective clustering problem is known to be Max-SNP-hard even for
d = 2 and j = 2, for any approximation factor that is independent of n. Instead, we suggest to use
an algorithm that provably converges to a local minimum via the Expectation-Maximization (EM)
method (Dempster et al., 1977), which is a generalization of the well known Lloyd algorithm (Lloyd,
1982). The resulting clusters and factorizations are used to determine the new architecture and its
initial weights; see Figure 3 for more details. We run on instances of AWS Amazon EC2 cloud, and
detail our results in the next section.

Open code and networks. Complete open code to reproduce the resulting networks is provided.
We expect it to be useful for future research, and give the following few examples.

                                                     5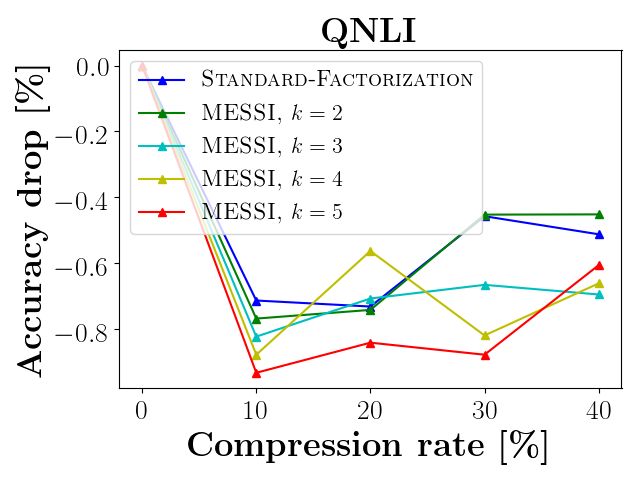
Published as a conference paper at ICLR 2021

2.1   G ENERALIZATIONS AND E XTENSIONS .

Our suggested architecture can be generalized and extended to support many other optimization
functions that may be relevant for different types of datasets, tasks or applications besides NLP.

`q -error. For simplicity, our suggested approach aims to minimize sum of squared distances to k
subspaces. However, it can be easily applied also to sum of distances from the points to the subspace,
which is a more robust approach toward outliers (“far away points”).
Even for k = 1 recent results of Tukan et al. (2020b) show improvement over SVD.
Distance functions. Similarly, we can replace the Euclidean `2 -distance by e.g. the Manhattan dis-
tance which is the `1 -norm between a point x and its projection, i.e., kx − x0 k1 or sum of differences
between the corresponding entries, instead of sum of squared entries, as in the Euclidean distance
kx − x0 k2 in this paper.
Non-uniform dimensions. In this paper we assume that k subspaces approximate the input points,
and each subspace has dimension exactly j, where j, k ≥ 1 are given integers. A better strategy
is to allow each subspace to have a different dimension, ji for every i ∈ {1, · · · , k}, or add a
constraint only on the sum j1 + · · · + jk of dimensions. Similarly, the number k may be tuned as
in our experimental results. Using this approach we can improve the accuracy and enjoy the same
compression rate.
For more details about those generalizations and others, we refer the interested reader to section E.1
at the appendix.

Figure 4: Why k subspaces? Here, we have n = 120 data points in R3 that are spread around k = 3
lines (j = 1). Factoring this data based on the optimal plane P results with large errors, since some
points are far from this plane as can be seen in the left hand side of the figure. On the right hand
side, factoring the data based the 3 optimal lines `1 , `2 , and `3 gives a much smaller errors. Also,
storing the factorization based on the plane P requires 2(120 + 3) = 246 parameters, compared to
120 × 1 + 3 × 3 = 129 parameters based on `1 , `2 , and `3 . I.e., less memory and a better result.

3     E XPERIMENTAL R ESULTS

GLUE benchmark. We run our experiments on the General Language Understanding Evaluation
(GLUE) benchmark (Wang et al., 2018). It is widely-used collection of 9 datasets for evaluating
natural language understanding systems.
Networks. We use the following networks: (i) RoBERTa (Liu et al., 2019b), it consists of 120 mil-
lions parameters, and its embedding layer has 38.9 million parameters (32.5% of the entire network
size), (ii) DistilBERT (Sanh et al., 2019) consists of 66 million parameters, and its embedding layer
has 23.5 million parameters (35.5% of the entire network size), and (iii) ALBERT (base-v2) (Lan
et al., 2019), which consists of 11.7 million parameters, and its embedding layer has 3.8 million
parameters (33% of the entire network).

                                                   6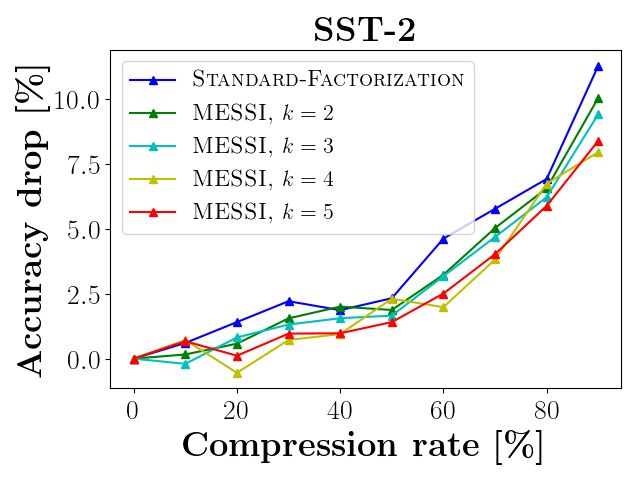
Published as a conference paper at ICLR 2021

               Embedding layer
   Model                          MRPC      COLA       MNLI      SST-2     STS-B     QNLI       RTE       WNLI       QQP      Avg.
               compression rate
                    20%            0.98       3.4      −0.44     −0.54     −0.23     −0.84     −1.08         0       0.26
 DistilBERT                                                                                                                   0.17
                  k and j         4 | 558   4 | 558    4 | 558   4 | 558   4 | 558   5 | 545   7 | 522    5 | 545   5 | 545
                    40%             1.2       3.7       −0.1       0.9     −0.15      −0.7     −0.72         0        0.4
 DistilBERT                                                                                                                   0.5
                  k and j         6 | 400   5 | 409    4 | 418   5 | 409   5 | 409   3 | 428   7 | 392    5 | 409   5 | 409
                    50%             3.1       8.6      −0.27       1.4      −0.4                0.36         0
 DistilBERT                                                                           NA                             NA       1.8
                  k and j         6 | 333   5 | 341    5 | 341   5 | 341   5 | 341             7 | 326    5 | 341

                 25% − 35%          0.2       2.3        0.2      −0.5      0.44       0.2         1         0
 RoBERTA                                                                                                             NA       0.47
                   k and j        5 | 517   10 | 451   5 | 517   5 | 517   5 | 517   5 | 517   10 | 451   5 | 517
                 40% − 50%          0.2       3.4       0.61      −0.3      0.63       0.2         1         0
 RoBERTA                                                                                                             NA       0.71
                   k and j        5 | 384   10 | 384   5 | 384   5 | 384   5 | 384   5 | 384   10 | 384   5 | 384

Table 1: In the table above, we present the compressed models with the best accuracy achieved for
specific compression rates (or intervals) of the embedding layer. We report their drop in accuracy,
and the used values of k and j. Specifically, in each entry the “accuracy drop” is presented above
the used k and j values. The last column is the average accuracy drop over all tested tasks. Observe
that: (i) negative values presents improvements in the accuracy upon the non-compressed version
of the corresponding model, and (ii) the results in this table can be improved if we allow to use the
best model from higher compression rates also, e.g., in the task RTE on the network DistilBERT, we
achieved 2.5 accuracy increase when we compressed 60% of the embedding layer, however, in this
table we did not add this result for the smaller compression rates of 20, 40 and 50.

Software and Hardware. All the experiments were conducted on a AWS c5a.16xlarge machine
with 64 CPUs and 128 RAM [GiB]. To build and train networks, we used the suggested implemen-
tation at the Transformers 1 library from HuggingFace (Wolf et al., 2019) (Transformers version
3.1.0, and PyTorch version 1.6.0 (Paszke et al., 2017)). For more detailes about the implementation,
we refer the reader to section A at the appendix.
The setup. All our experiments are benchmarked against their publicly available implementations of
the DistilBERT, RoBERTa, and ALBERT models, fine-tuned for each task, which was in some cases
higher and in other cases lower than the values printed in the publications introducing these models.
Given an embedding layer from a network that is trained on a task from GLUE, an integer k ≥ 1,
and an integer j ≥ 1. We build and initialize a new architecture that replaces the original embedding
layer by two smaller layers as explained in Figure 3. We then fine tune the resulted network for 2
epochs. We ran the same experiments for several values of k and j that defines different compression
rates. We compete with the standard matrix factorization approach in all experiments.

3.1      R EPORTED RESULTS

Compressing RoBERTA and DistilBERT. (i) In Figures 5 and 6 the x-axis is the compression
rate of the embedding layer, i.e. a compression of 40% means the layer is 60% its original size. The
y-axis is the accuracy drop (relative error) with respect to the original accuracy of the network (with
fine tuning for 2 epochs). In Figure 5, each graph reports the results for a specific task from the
GLUE benchmark on RoBERTa, while Figure 6 reports the results of DistilBERT.
(ii) On the task WNLI we achieved 0 error on both networks using the two approaches of SVD and
our approach until 60% compression rate, so we did not add a figure on it.
(iii) In RoBERTa, we checked only 2 compression rates on MNLI due to time constraints, and we
achieved similar results in both techniques, e.g., we compressed 45% of the embedding layer, based
on our technique with k = 5 and j = 384 to obtain only 0.61% drop in accuracy with fine tuning
and 4.2% without, this is compared to 0.61% and 13.9% respectively for the same compression rate
via SVD factorization. In DistilBERT, we compressed 40% of the embedding layer with k = 4
and achieved a 0.1% increase in accuracy after fine-tuning, as compared to a 0.05% drop via SVD
factorization (on MNLI).
(iv) Table 1 suggests the best compressed networks in terms of accuracy VS size.

   1
       https://github.com/huggingface/transformers

                                                                 7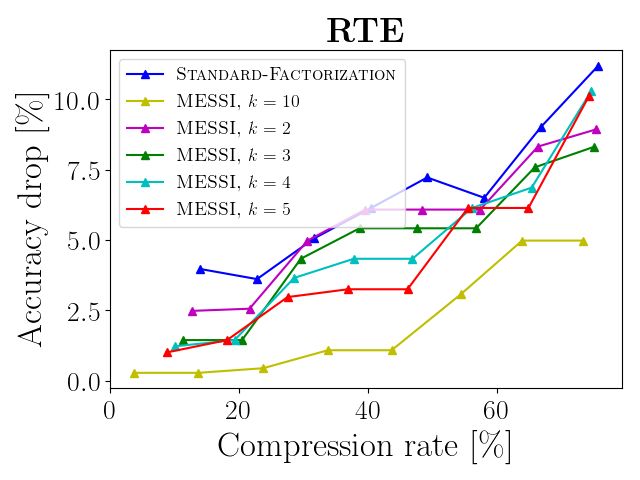
Published as a conference paper at ICLR 2021

        Model               Parameters   MRPC    COLA    MNLI    SST-2   STS-B   RTE    WNLI   QQP
   ALBERT (base-v2)           11.7M       89.7    57.7   84.9     92.5    90.5   77.6   59.2   90.7
 MESSI-ALBERT (base-v2)       11.7M        90     58.5   84.7     92.7    90.5   78.3   60.6   90.7

Table 2: In the table above, we report the accuracy achieved by “ALBERT (base-v2)” model on the
tasks from GLUE, and we compare them to the results achieved on another model of the same size
(up to 0.18% increase) which we call “MESSI-ALBERT (base-v2)”. This model is exactly the same
as the original “ALBERT (base-v2)” model up to one change, where the original embedding layer
of “ALBERT (base-v2)” (consists of 30k rows and 128 columns) is modified to the new suggested
MESSI architecture, with k = 7, and j = 125 according the pipeline at Section 2, and without
fine-tuning. It can be seen by the table, that the new architecture achieved a better results.

Improving the accuracy of pre-trained models using MESSI. In Table 2, we test if the MESSI
architecture can improve the accuracy of a pre-trained model, while maintaining the same number
of parameters. The only change done on the given model is factoring its embedding layer to the
suggested architecture using the detailed pipeline at section 2. Here, we make sure to choose the
right values of k and j such that the original embedding layer size is maintained (up to a very small
change). We conducted this experiment on the model ALBERT (base v2). The results are actually
promising.
More results that are placed in the appendix: (i) Figure 8 in section B shows the accuracy drop
as a function of the compression rate on the RoBERTA model before fine-tuning. (ii) In section C
we compress a fully-connected layer in different settings, specifically speaking we compress the
two popular models: LeNet-300-100 on MNIST (LeCun et al., 1998), and VGG-19 (Simonyan and
Zisserman, 2014) on CIFAR10 (Krizhevsky et al., 2009), see results at Figures 9 and 10. (iii) In
section D, we suggest a way to determine the values of k and j in practice for a given compression
rate, and we report the results on compressing DistilBERT based on this suggestion; see Figure 11.
(iv) Finally, in section E we check how another clustering method can fit in our pipeline, i.e., instead
of clustering the input neurons of the fully-connected layer (rows of A) via projective clustering
(steps 1 and 2 in the pipeline at Section 2), we try the known k-means clustering, and then we
continue the same by applying SVD on each cluster and building the corresponding new layers. See
results in Figures 12, 13, 14 and 15.

Figure 5: Results on RoBERTa: Accuracy drop as a function of compression rate, with fine tuning
for 2 epochs after compression. To illustrate the dependence of MESSI on the choice of k, we have
plotted several contours for constant-k. As the reader will notice, the same dataset may be ideally
handled by different values of k depending on the desired compression.

                                                   8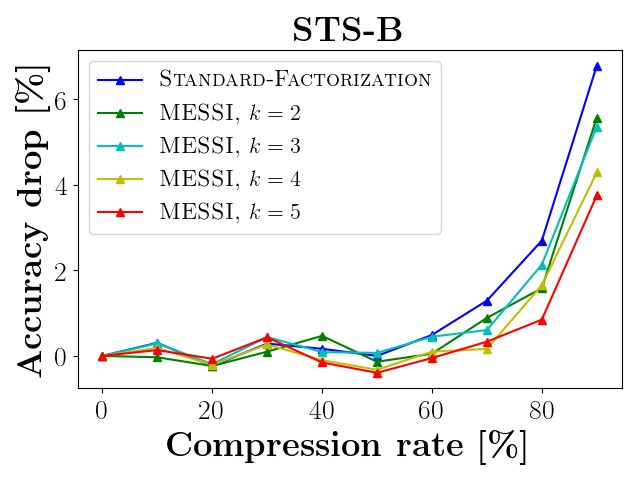
Published as a conference paper at ICLR 2021

Figure 6: Results on DistilBERT: Accuracy drop as a function of compression rate, with fine tuning
for 2 epochs after compression.

3.2   DISCUSSION

As shown by Figures 5 and 6, our approach outperforms the traditional SVD factorization. In all
experiments, our method achieves better accuracy for the same compression rate compared to the
traditional SVD. For example, in RobERTa, we compress 43% of the embedding layer with less
that 0.8% average drop in accuracy, this is compared to the 3% drop in the standard technique for a
smaller compression rate of 40%. In DistilBERT, we achieved 40% compression of the embedding
layer while incurring only a 0.5% average drop in accuracy over all nine GLUE tasks, compared
to a 2.8% drop using the existing SVD approach. As the reader will notice, the same dataset (and
network) may be ideally handled by different values of k depending on the desired compression.
We observed that our technique shines mainly when the network is efficient, and any small change
will lead to large error, e.g., as in the CoLA/RTE/MRPC graph of Figure 5. Although we achieve
better results in all of the cases, but here the difference is more significant (up to 10%), since our
compressed layer approximates the original layer better than SVD, the errors are smaller, and the
accuracy is better. Furthermore, Figure 8 shows clearly that even without fine tuning, the new
approach yields more accurate networks. Hence, we can fine tune for smaller number of epochs and
achieve higher accuracy. Finally, by Table 2 we can see that the MESSI architecture can be used
also to improve the accuracy of pre-trained models while maintaining the original size.

3.3   C ONCLUSION

We suggested a novel approach for compressing a fully-connected layer. This is by clustering the
input neurons of the layer into k-subsets (via projective clustering) and then factoring the corre-
sponding weights matrix of each subset. We then provided a novel architecture that replaces the
original fully-connected layer by a set of k small layers that operate in parallel and are then re-
combined with a single fully-connected layer. The experimental results showed that our suggested
algorithm overcomes the traditional factorization technique and achieves higher accuracy for the
same compression rate before and after fine-tuning.

3.4   F UTURE WORK

The future work includes experiments on other networks and data sets both from the field of NLP
and outside it, e.g., an inserting experiment is to modify the ALBERT network (Lan et al., 2019), by
changing its embedding layer architecture (that consists of two layers based on the standard matrix
factorization) to the suggested architecture in this paper, while maintaining the same number of pa-
rameters, and to check if this modification improved its accuracy, also the suggested generalizations
and extensions from section 2.1 should be tried, where we strongly believe they will allow us to
achieve even better results. Finally, generalizing the approach to other type of layers.

                                                  9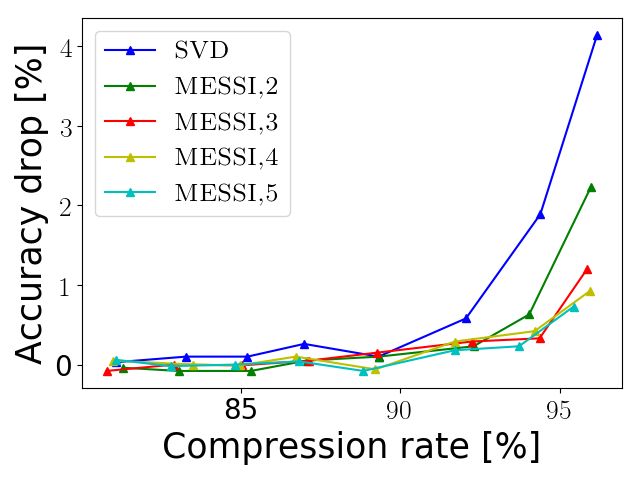
Published as a conference paper at ICLR 2021

4   ACKNOWLEDGEMENTS
Support for this research has been provided in part by NSF award 1723943. We are grateful for it.

R EFERENCES
Anish Acharya, Rahul Goel, Angeliki Metallinou, and Inderjit Dhillon. Online embedding com-
  pression for text classification using low rank matrix factorization. In Proceedings of the AAAI
  Conference on Artificial Intelligence, volume 33, pages 6196–6203, 2019.
Kenneth L Clarkson and David P Woodruff. Input sparsity and hardness for robust subspace ap-
  proximation. In 2015 IEEE 56th Annual Symposium on Foundations of Computer Science, pages
  310–329. IEEE, 2015.
Andrew M Dai and Quoc V Le. Semi-supervised sequence learning. In Advances in neural infor-
  mation processing systems, pages 3079–3087, 2015.
Arthur P Dempster, Nan M Laird, and Donald B Rubin. Maximum likelihood from incomplete data
  via the em algorithm. Journal of the Royal Statistical Society: Series B (Methodological), 39(1):
  1–22, 1977.
Jacob Devlin, Ming-Wei Chang, Kenton Lee, and Kristina Toutanova. BERT: Pre-training of deep
  bidirectional transformers for language understanding. In Proceedings of the 2019 Conference
  of the North American Chapter of the Association for Computational Linguistics: Human Lan-
  guage Technologies, Volume 1 (Long and Short Papers), pages 4171–4186, Minneapolis, Min-
  nesota, June 2019. Association for Computational Linguistics. doi: 10.18653/v1/N19-1423. URL
  https://www.aclweb.org/anthology/N19-1423.
Michael Edwards and Kasturi Varadarajan. No coreset, no cry: Ii. In International Confer-
 ence on Foundations of Software Technology and Theoretical Computer Science, pages 107–115.
 Springer, 2005.
Angela Fan, Edouard Grave, and Armand Joulin. Reducing transformer depth on demand with
  structured dropout. In International Conference on Learning Representations, 2019.
Jianzhou Feng, Li Song, Xiaokang Yang, and Wenjun Zhang. Learning dictionary via subspace
   segmentation for sparse representation. In 2011 18th IEEE International Conference on Image
   Processing, pages 1245–1248. IEEE, 2011.
Mitchell    A.    Gordon.            All    the    ways     you     can    compress    bert.
 http://mitchgordon.me/machine/learning/2019/11/18/all-the-ways-to-compress-BERT.html,
 2019.
Mitchell A Gordon, Kevin Duh, and Nicholas Andrews. Compressing bert: Studying the effects of
 weight pruning on transfer learning. arXiv preprint arXiv:2002.08307, 2020.
Fu-Ming Guo, Sijia Liu, Finlay S Mungall, Xue Lin, and Yanzhi Wang. Reweighted proximal
  pruning for large-scale language representation. arXiv preprint arXiv:1909.12486, 2019.
Xiaoqi Jiao, Yichun Yin, Lifeng Shang, Xin Jiang, Xiao Chen, Linlin Li, Fang Wang, and Qun Liu.
  Tinybert: Distilling bert for natural language understanding. arXiv preprint arXiv:1909.10351,
  2019.
Alex Krizhevsky, Geoffrey Hinton, et al. Learning multiple layers of features from tiny images.
  2009.
Zhenzhong Lan, Mingda Chen, Sebastian Goodman, Kevin Gimpel, Piyush Sharma, and Radu Sori-
  cut. Albert: A lite bert for self-supervised learning of language representations. In International
  Conference on Learning Representations, 2019.
Quoc Le and Tomas Mikolov. Distributed representations of sentences and documents. In Interna-
  tional conference on machine learning, pages 1188–1196, 2014.

                                                 10
Published as a conference paper at ICLR 2021
Yann LeCun, Léon Bottou, Yoshua Bengio, and Patrick Haffner. Gradient-based learning applied to
document recognition. Proceedings of the IEEE, 86(11):2278–2324, 1998.
Linqing Liu, Huan Wang, Jimmy Lin, Richard Socher, and Caiming Xiong. Attentive student
meets multi-task teacher: Improved knowledge distillation for pretrained models. arXiv preprint
arXiv:1911.03588, 2019a.
Risheng Liu, Zhouchen Lin, Fernando De la Torre, and Zhixun Su. Fixed-rank representation for
unsupervised visual learning. In 2012 IEEE Conference on Computer Vision and Pattern Recog-
nition, pages 598–605. IEEE, 2012.
Yinhan Liu, Myle Ott, Naman Goyal, Jingfei Du, Mandar Joshi, Danqi Chen, Omer Levy, Mike
Lewis, Luke Zettlemoyer, and Veselin Stoyanov. Roberta: A robustly optimized bert pretraining
approach. arXiv preprint arXiv:1907.11692, 2019b.
Stuart Lloyd. Least squares quantization in pcm. IEEE transactions on information theory, 28(2):
129–137, 1982.
Julien Mairal, Jean Ponce, Guillermo Sapiro, Andrew Zisserman, and Francis R Bach. Supervised
dictionary learning. In Advances in neural information processing systems, pages 1033–1040,
2009.
J Scott McCarley. Pruning a bert-based question answering model. arXiv preprint
arXiv:1910.06360, 2019.
Paul Michel, Omer Levy, and Graham Neubig. Are sixteen heads really better than one? In Advances
in Neural Information Processing Systems, pages 14014–14024, 2019.
Tomas Mikolov, Ilya Sutskever, Kai Chen, Greg S Corrado, and Jeff Dean. Distributed represen-
tations of words and phrases and their compositionality. In Advances in neural information pro-
cessing systems, pages 3111–3119, 2013.
Subhabrata Mukherjee and Ahmed Hassan Awadallah. Distilling transformers into simple neural
networks with unlabeled transfer data. arXiv preprint arXiv:1910.01769, 2019.
Adam Paszke, Sam Gross, Soumith Chintala, Gregory Chanan, Edward Yang, Zachary DeVito,
Zeming Lin, Alban Desmaison, Luca Antiga, and Adam Lerer. Automatic differentiation in
pytorch. In NIPS-W, 2017.
Matthew Peters, Mark Neumann, Mohit Iyyer, Matt Gardner, Christopher Clark, Kenton Lee, and
Luke Zettlemoyer. Deep contextualized word representations. In Proceedings of the 2018 Con-
ference of the North American Chapter of the Association for Computational Linguistics: Human
Language Technologies, Volume 1 (Long Papers), pages 2227–2237, 2018.
Alec Radford, Karthik Narasimhan, Tim Salimans, and Ilya Sutskever. Improving language under-
standing by generative pre-training, 2018.
Alec Radford, Jeffrey Wu, Rewon Child, David Luan, Dario Amodei, and Ilya Sutskever. Language
models are unsupervised multitask learners. OpenAI Blog, 1(8):9, 2019.
Victor Sanh, Lysandre Debut, Julien Chaumond, and Thomas Wolf. Distilbert, a distilled version of
bert: smaller, faster, cheaper and lighter. arXiv preprint arXiv:1910.01108, 2019.
Sheng Shen, Zhen Dong, Jiayu Ye, Linjian Ma, Zhewei Yao, Amir Gholami, Michael W Mahoney,
and Kurt Keutzer. Q-bert: Hessian based ultra low precision quantization of bert. In AAAI, pages
8815–8821, 2020.
Karen Simonyan and Andrew Zisserman. Very deep convolutional networks for large-scale image
recognition. arXiv preprint arXiv:1409.1556, 2014.
Siqi Sun, Yu Cheng, Zhe Gan, and Jingjing Liu. Patient knowledge distillation for bert model
compression. In Proceedings of the 2019 Conference on Empirical Methods in Natural Language
Processing and the 9th International Joint Conference on Natural Language Processing (EMNLP-
IJCNLP), pages 4314–4323, 2019.
11Published as a conference paper at ICLR 2021
Raphael Tang, Yao Lu, Linqing Liu, Lili Mou, Olga Vechtomova, and Jimmy Lin. Distilling task-
specific knowledge from bert into simple neural networks. arXiv preprint arXiv:1903.12136,
2019.
Ivana Tosic and Pascal Frossard. Dictionary learning. IEEE Signal Processing Magazine, 28(2):
27–38, 2011.
Holger Trittenbach and Klemens Böhm. One-class active learning for outlier detection with mul-
tiple subspaces. In Proceedings of the 28th ACM International Conference on Information and
Knowledge Management, pages 811–820, 2019.
Murad Tukan, Alaa Maalouf, and Dan Feldman. Coresets for near-convex functions. arXiv preprint
arXiv:2006.05482, 2020a.
Murad Tukan, Alaa Maalouf, Matan Weksler, and Dan Feldman. Compressed deep networks: Good-
bye svd, hello robust low-rank approximation. arXiv preprint arXiv:2009.05647, 2020b.
Alex Wang, Amanpreet Singh, Julian Michael, Felix Hill, Omer Levy, and Samuel Bowman. Glue:
A multi-task benchmark and analysis platform for natural language understanding. In Proceedings
of the 2018 EMNLP Workshop BlackboxNLP: Analyzing and Interpreting Neural Networks for
NLP, pages 353–355, 2018.
Ziheng Wang, Jeremy Wohlwend, and Tao Lei. Structured pruning of large language models. arXiv
preprint arXiv:1910.04732, 2019.
Thomas Wolf, Lysandre Debut, Victor Sanh, Julien Chaumond, Clement Delangue, Anthony Moi,
Pierric Cistac, Tim Rault, Rémi Louf, Morgan Funtowicz, et al. Huggingface’s transformers:
State-of-the-art natural language processing. ArXiv, pages arXiv–1910, 2019.
Dong Xu, Shuicheng Yan, Lei Zhang, Hong-Jiang Zhang, Zhengkai Liu, and Heung-Yeung Shum.
Concurrent subspaces analysis. In 2005 IEEE Computer Society Conference on Computer Vision
and Pattern Recognition (CVPR’05), volume 2, pages 203–208. IEEE, 2005.
Zhilin Yang, Zihang Dai, Yiming Yang, Jaime Carbonell, Russ R Salakhutdinov, and Quoc V Le.
Xlnet: Generalized autoregressive pretraining for language understanding. In Advances in neural
information processing systems, pages 5753–5763, 2019.
Xiyu Yu, Tongliang Liu, Xinchao Wang, and Dacheng Tao. On compressing deep models by low
rank and sparse decomposition. In Proceedings of the IEEE Conference on Computer Vision and
Pattern Recognition, pages 7370–7379, 2017.
Ofir Zafrir, Guy Boudoukh, Peter Izsak, and Moshe Wasserblat. Q8bert: Quantized 8bit bert. arXiv
preprint arXiv:1910.06188, 2019.
12Published as a conference paper at ICLR 2021
A I MPLEMENTATION IN P YTORCH
Since we did not find straight support for the new suggested architecture, we implemented it as
follows. To represent the matrices V 1 , · · · , V k that are described is Section 2, we concatenate them
all to a one large matrix V = [(V 1 )T , · · · , (V k )T ]T of kj rows and d columns, and we build a fully-
connected layer the corresponds to V . For the k parallel layers (matrices) U 1 , · · · , U k , we build one
large sparse matrix U of n rows and kj columns. Every row of this matrix has at least (k − 1)j zero
entries, and at most j non zero entries, where the non-zero entries of the ith row corresponds to the
rows in matrix V which encode the closest subspace to that row’s point.
Finally, during the fine tuning or training, we set those zero entries in U as non-trainable parameters,
and we make sure that after every batch of back-propagation they remain zero. Hence we have at
most nj non-zero entries (trainable parameters) in U and nj + ndk in total.
We hope that in the future, the suggested architecture will be implemented in the known Deep-
Learning libraries so it can be easily used while taking advantage of the substantial time and space
benefits presented in this paper.
Figure 7: Implementation. Example of the factorization A = U V in our implementation. Here
n = 7 and d = 7. The matrix U is built such that row z contains a row from U i where point z was
partitioned to the ith subspace. In this example, the 4th and 6th rows were both clustered to the first
subspace. Hence, the first 3 coordinates of the corresponding rows in the representation matrix U
are nonzero, and the other entries are zero. In this way, we used jk dimensions so that none of the k
subspaces of dimension j interact.
13Published as a conference paper at ICLR 2021
B R ESULTS B EFORE F INE T UNING
In this section we report the result of compressing RoBERTa without fine-tuning. By Figure 8
we can clearly see that even without fine tuning, the new approach yields more accurate networks
compared to the standard SVD factorization. Hence, our approach gives a better start for the learning
(fine-tuning) process, which implies that we can fine tune for smaller number of epochs and achieve
higher accuracy and smaller networks.
Figure 8: Compressing RoBERTa results: Accuracy drop as a function of compression rate, without
fine tuning.
14Published as a conference paper at ICLR 2021
C C OMPRESSING FULLY- CONNECTED LAYERS USING MESSI.
In this section we test our approach on two popular models: LeNet-300-100 on MNIST (LeCun
et al., 1998), and VGG-19 (Simonyan and Zisserman, 2014) on CIFAR10 (Krizhevsky et al., 2009).
Also here, we conducted our experiments on the same hardware described in Section 3.
In both experiments, we test our approach on multiple values of k and compare it to k = 1 (standard
SVD factorization). For every value of k, we compress each layer from the hidden fully-connected
layers of the given model by the same percentage and using the same value of k.
LeNet-300-100. The network consists of 266610 parameters, and it is comprised of two fully-
connected hidden layers with 300 and 100 neurons, respectively, trained on the MNIST data set.
We test our approach on k ∈ {2, 3, 4, 5}. In Figure 9, we report the accuracy drop as a function
of the compression rate for the whole network. We can see the advantage of our approach when
compressing more than 90% of the network.
Figure 9: Compressing LeNet-300-100: Accuracy drop as a function of compression rate
VGG-19. We used the implementation at 2 . The network consists of 16 convolutional layers, fol-
lowed by 2 dense hidden (fully-connected) layers with 512 neurons each. Finally, the classification
layer has 10 neurons. The fully-connected layers consists of 530442 parameters.
Here, we tested our approach for k ∈ {2, 5}. In Figure 10, we report the accuracy drop as a function
of the compression rate of the fully-connected layers. The suggested approach has a clear advantage
for high compression rates.
Figure 10: Compressing VGG-19: Accuracy drop as a function of compression rate of the fully-
connected layers in the network
2
https://github.com/chengyangfu/pytorch-vgg-cifar10/blob/master/vgg.py
15Published as a conference paper at ICLR 2021
D MESSI- ENSEMBLE
In this section we show only the best computed results of DistilBERT: that is obtained by training
models at several k values and then evaluating the model that achieves the best accuracy on the
training set. Specifically, given a fully-connected layer of n input neurons and d output neurons, for
a given compression rate x (e.g., x = 0.4 means that we want to remove 40% of the parameters),
we try multiple values of k via binary search on k. For every such k value we compute the implied
value j = (1 − x)dn/(n + kd), and we compress the network based on those k and j via the MESSI
pipeline. Finally, we save the model that achieves the best accuracy on the training set, and evaluate
its results on the test set. Figure 11 reports the results for this approach.
Figure 11: Results on DistilBERT: Accuracy drop as a function of compression rate, with fine tuning
for 2 epochs after compression. The red line (MESSI, ensemble) is obtained by training models at
several k values and then evaluating the model that achieves the best accuracy on the training set.
E P ROTECTIVE CLUSTERING VS k- MEANS
Recall the suggested pipeline from section 2: The first step of it is to compute a set of k subspaces
in Rd , each of dimension j that approximates the (k, j)-projective clustering of the input matrix A.
Then, the second step partitions the input neurons (rows of A) according to their closest subspace
from the set of k subspace that is computed in the first step. Then, in step 3, we compute the SVD for
each cluster, and in steps 4 and 5 we build (and possibly fine-tune) the corresponding architecture as
described (see in Figure 3).
In this section, we compare using projective clustering to using k-means clustering. We do not apply
steps 1 and 2, as we instead partition the input neurons (rows of A) into k groups via applying k-
means clustering on them (instead of projective clustering). We then apply steps 3, 4 and 5 in exactly
the same way.
Here, we evaluated our results on the networks: RoBERTa (Liu et al., 2019b) and DistilBERT (Sanh
et al., 2019) on the RTE and MRPC tasks from the GLUE benchmark (Wang et al., 2018). Figures 12
and 13 compare the results on RoBERTA between the two clustering methods, with and without
fine-tuning, respectively, while Figures 14 and 15 do the same for the results on DistilBERT.
We also used the LeNet-300-100 model on MNIST LeCun et al. (1998) to check this (same) exper-
iment in a different setting. See Figure 16.
Discussion. In Figure 13, where we test the accuracy drop before fine-tuning, we can see that using
projective clustering for partitioning the neurons is better than running k-means on them, i.e., the
projective clustering approach yielded a better start (accuracy before fine-tuning) than the k-means
approach for the learning process.
16Published as a conference paper at ICLR 2021
Figure 12: Compressing RoBERTa (with two epochs of fine-tuning): Accuracy drop as a function
of compression rate, comparing the projective clustering approach to the known k-means clustering.
Figure 13: Compressing RoBERTa (without fine-tuning): Accuracy drop as a function of compres-
sion rate, comparing the projective clustering approach to the known k-means clustering.
This could be explained by the fact that our original approach (projective clustering) aims to compute
a set of k subspaces (each of dimension j) that minimizes the sum of squared distances from each
row in the input matrix A (neuron) to its closest subspace from the set. Hence, factoring the matrix
A based on those subspaces gives a good approximation for it, which is not the case in the k-means
clustering.
This advantage may explain the difference between the two approaches after fine-tuning for the same
number of epochs as can be seen in Figure 12.
On the other hand, in Figure 15, the two methods gave similar results in terms of accuracy before fine
tuning, and we can see that this effects the results after the fine-tuning, where the two approaches
also succeeded to get similar results as can be seen in Figure 13.
Hence, the better way to determine the partition (which determines the compressed architecture) and
to initialize the new layer in the MESSI pipeline is the projective clustering approach.
17Published as a conference paper at ICLR 2021
Figure 14: Compressing DistilBERT (with two epochs of fine-tuning): Accuracy drop as a function
of compression rate, comparing the projective clustering approach to the known k-means clustering.
Figure 15: Compressing DistilBERT (without fine-tuning): Accuracy drop as a function of com-
pression rate, comparing the projective clustering approach to the known k-means clustering.
Figure 16: Compressing LeNet-300-100: Accuracy drop as a function of compression rate. Here we
compare the projective clustering approach to the known k-means clustering.
18Published as a conference paper at ICLR 2021
E.1 G ENERALIZATIONS AND E XTENSIONS .
Here, we give more details about the suggested generalizations and extensions from section 2.1, we
also add few more:
`q -error. For simplicity, our suggested approach aims to minimize sum of squared distances to k
subspaces. However, it can be easily applied also to sum of distances from the points to the subspace.
In this case, we aim to compute the maximum-likelihood of the generating subspaces assuming a
Laplacian instead of Gaussian distribution. More generally, we may want to minimize the sum over
every distance to the power of q > 0., i.e., we take the q-norm kerrkq where err is the distance
between a point to its projection on its closest subspace.
Even for k = 1 recent results of Tukan et al. (2020b) show improvement over SVD.
Observe that given the optimal subspaces, the system architecture in these cases remains the same
as ours in Figure 3.
Distance functions. Similarly, we can replace the Euclidean `2 -distance by e.g. the Manhattan
distance which is the `1 -norm between a point x and its projection, i.e., kx − x0 k1 or sum of dif-
ferences between the corresponding entries, instead of sum of squared entries, as in the Euclidean
distance kx − x0 k2 in this paper. More generally, we may use the `p distance kx − x0 kp , or even
non-distance functions such as M-Estimators that can handle outliers (as in Tukan et al. (2020a))
by replacing dist(p, x) with min {dist(p, x), t} where t > 0 is constant (threshold) that makes sure
that far away points will not affect the overall sum too much.
From an implementation perspective, the EM-algorithm for k-subspaces uses a k = 1 solver routine
as a blackbox. Therefore extending to other distance functions is as simple as replacing the SVD
solver (the k = 1 for Euclidean distance) by the corresponding solver for k = 1.
Non-uniform dimensions. In this paper we assume that k subspaces approximate the input points,
and each subspace has dimension exactly j, where j, k ≥ 1 are given integers. A better strategy
is to allow each subspace to have a different dimension, ji for every i ∈ {1, · · · , k}, or add a
constraint only on the sum j1 + · · · + jk of dimensions. Similarly, the number k may be tuned as
in our experimental results. Using this approach we can improve the accuracy and enjoy the same
compression rate. This search or parameter tuning, however, might increase the computation time
of the compressed network. It also implies layers of different sizes (for each subspace) in Figure 3.
Dictionary Learning. Our approach of projective clustering is strongly related to Dictionary Learn-
ing (Tosic and Frossard, 2011; Mairal et al., 2009). Here, the input is a matrix A ∈ Rn×d and the
output is a “dictionary” V T ∈ Rd×j and projections or atoms which are the rows of U ∈ Rn×j that
minimize kA − U V k under some norm. It is easy to prove that U V is simply the j-rank approxima-
tion of A, as explained in Section 1. However, if we have additional constraints, such as that every
row of U should have, say, only k = 1 non-zero entries, then geometrically the columns of V T are
the j lines that intersects the origin and minimize the sum of distances to the points. For k > 1 every
point is projected onto the subspace that minimizes its distance and is spanned by k columns of V T .
Coresets. Coresets are a useful tool, especially in projective clustering, to reduce the size of the
input (compress it in some sense) while preserving the optimal solution or even the sum of distances
to any set of k subspaces. However, we are not aware of any efficient implementations and the
dependency on d and k is usually exponential as in Edwards and Varadarajan (2005). A natural
open problem is to compute more efficient and practical coresets for projective clustering.
E.2 E XPERIMENTING ON `q - ERROR
To get a taste of the suggested extensions, we tried the first suggestion of `q -error, with q = 1. I.e.,
we cluster the rows of the input matrix A based on the set of k-subspaces that minimizes the sum of
(non-squared) distances from each row in A to its closest subspace from the set.
The local minimum of the new clustering problem can still be obtained by the suggested EM al-
gorithm. The only difference is that the SVD computation of the optimal subspace for a cluster of
points (k = 1) should be replaced by more involved approximation algorithm for computing the
19Published as a conference paper at ICLR 2021
Clustering method Task Fine-tuning epochs j = 517 j = 348
PC-`1 MRPC 0 3.1 5.1
PC-`2 MRPC 0 3.9 5.1
PC-`1 MRPC 2 0.2 0.2
PC-`2 MRPC 2 0.2 0.2
PC-`1 RTE 0 5 6.8
PC-`2 RTE 0 3.2 7.4
PC-`1 RTE 2 0.47 1.2
PC-`2 RTE 2 0.44 1
Table 3: In the table above, we compare two approaches to cluster the rows of the input matrix A
(and check how they fit in the MESSI pipeline), the first approach is projective clustering with `1
error (PC-`1 ), and the second is the standard protective clustering with `2 error that we used in all
the other experiments.
subspace that minimizes sum over distances to the power of q = 1; see e.g. Tukan et al. (2020b);
Clarkson and Woodruff (2015).
However, this change increased the running time of the algorithm from minutes to days, this is due
to the fact the deterministic approximation algorithms for the new problem (`1 -error) with k = 1
take a time of O(nd4 ) at least, where d = 768 in our case, and we need to run this approximation
algorithm many times in the EM procedure. For that, we conducted our experiments only on one
network (RoBERTA) on 2 tasks from the GLUE benchmark (MRPC and RTE).
Table 3, shows the accuracy drop for both techniques for two values of j with k = 5 on the MRPC
task, and the same on RTE with k = 10. It can be seen from the table, that mostly, using the `1 error
as an initialization is better than the `2 . However,for some reason (that needs further investigation)
after fine-tuning for 2 epochs both approaches reached almost the same accuracy, even more, the `2
approach achieved a better accuracy sometime. We leave this for future research.
20You can also read