Observing the Impact of WWF Earth Hour on Urban Light Pollution: A Case Study in Berlin 2018 Using Differential Photometry - MDPI
←
→
Page content transcription
If your browser does not render page correctly, please read the page content below
sustainability

Article
Observing the Impact of WWF Earth Hour on Urban
Light Pollution: A Case Study in Berlin 2018 Using
Differential Photometry
Andreas Jechow 1,2
 1    Leibniz Instute for Freshwater Ecology and Inland Fisheries, 12587 Berlin, Germany;
      andreas.jechow@gmx.de
 2    GFZ German Centre for Geosciences, 14473 Potsdam, Germany

 Received: 11 January 2019; Accepted: 28 January 2019; Published: 31 January 2019

 Abstract: Earth Hour is one of the most successful coordinated mass efforts worldwide to raise
 awareness of environmental issues, with excessive energy consumption being one driver of climate
 change. The campaign, first organized by the World Wildlife Fund in Australia in 2007, has grown
 across borders and cultures and was celebrated in 188 countries in 2018. It calls for voluntarily
 reduction of electricity consumption for a single hour of one day each year. Switching off non-essential
 electric lights is a central theme and resulted in 17,900 landmarks going dark in 2018. This switch-off of
 lights during Earth Hour also leads to reduction of light pollution for this specific period. In principle,
 Earth Hour allows the study of light pollution and the linkage to electricity consumption of lighting.
 However, quantitative analysis of the impact of Earth Hour on light pollution (and electricity
 consumption) are sparse, with only a few studies published showing no clear impact or the reverse,
 suffering from residual twilight and unstable weather conditions. In this work, light pollution
 measurements during Earth Hour 2018 in an urban park (Tiergarten) in Berlin, Germany, are reported.
 A novel light measurement method using differential photometry with calibrated digital cameras
 enables tracking of the switching off and switching back on of the lights of Berlin’s iconic Brandenburg
 Gate and the buildings of Potsdamer Platz adjacent to the park. Light pollution reduction during
 the event was measurable, despite the presence of moonlight. Strategies for future work on light
 pollution using such events are discussed.

 Keywords: light pollution; earth hour

1. Introduction
     Earth Hour is an annual coordinated mass effort, organized by the World Wildlife Fund (WWF)
to raise awareness of climate change [1]. The campaign calls for citizens to voluntarily limit or cease
their electricity consumption, mainly lights, for a single hour at one day per year. The first Earth Hour
event was held in Sydney, Australia, on 31 March 2007 and has spread to 188 countries around the
world, affecting a variety of regions, cultures, and economies [2]. The objective of Earth Hour is to call
attention to environmentally sustainable action through the collective impact made when individuals,
businesses, governments, and communities voluntarily combine electricity conservation efforts. Earth
Hour’s awareness efforts respond to the rise of global electricity demand that is placing unprecedented
strain on the electricity grid and increasing emissions of greenhouse gas emissions into the atmosphere
because of fossil fuel combustion.
     Surprisingly, quantitative analysis of the impact of Earth Hour on actual electricity consumption
are sparse as results are mainly documented individually and on a local level [3]. However, Olexsak
and Meier [3] compiled 274 measurements of observed changes in electricity demand caused by Earth

Sustainability 2019, 11, 750; doi:10.3390/su11030750                        www.mdpi.com/journal/sustainability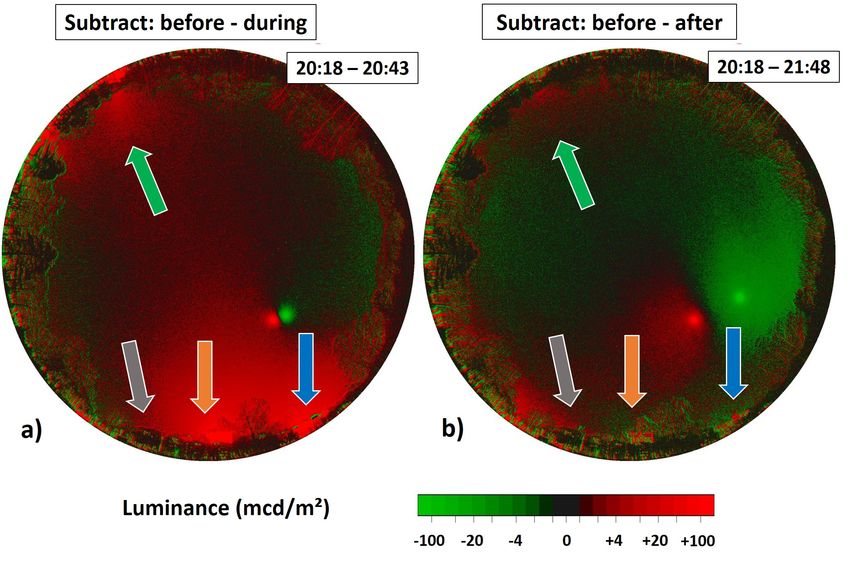
Sustainability 2019, 11, 750                                                                         2 of 16

Hour events in 10 countries, spanning six years. These events showed reduced electricity consumption
at an average of 4%, with a range of +2% (increased demand, New Zealand) to −28% (reduced demand,
Canada). Cheong and Lee [4] linked microblogging activity on Twitter with such energy demand data.
While the goal of Earth Hour is not to achieve measurable electricity savings, the collective events
illustrate how purposeful behavior can quantitatively affect regional electricity demand. Other studies
included the impact on education and communication. Sison examined how Earth Hour used creative
strategic communication to scale up a local community event to a global event promoting climate
change awareness [5]. Ärlemalm-Hagsér investigated education for sustainability in a theme about
Earth Hour in a Swedish preschool [6].
      One main theme within Earth Hour is to switch off non-essential electric lights. In 2018, lights
went out at around 17,900 landmarks worldwide including the Sydney Opera House (Sydney), Big Ben
and the Houses of Parliament (London), the Tokyo Sky Tree (Tokyo), the Empire State Building
(New York), the Pyramids of Egypt (Cairo), Sheikh Zayed Grand Mosque (Abu Dhabi), Christ the
Redeemer statue (Rio de Janeiro), and the Eiffel Tower (Paris) [2]. Thus, a secondary effect of Earth
Hour is reduction of light pollution, a form of environmental pollution caused by the excessive use
of artificial light at night [7–9]. Light pollution can affect astronomical observations [10] but also
humans [11] and flora and fauna [12,13] with impacts going beyond the pure night-time as shown
with pollinators [14] or altered daytime behavior in guppies [15]. Light pollution can occur in direct
form, when light is directly emitted onto the target by e.g., street lights, and in indirect form, when
light is diverted to the target e.g., by scattering events within the atmosphere. Artificial skyglow [16] is
one form of indirect light pollution undergoing dynamics with changed atmospheric conditions [17]
or human usage [18].
      Several efforts have been made to raise awareness of light pollution in the context of Earth
Hour [19–23]. This included star-gazing events, for example, organized by the Royal Astronomical
Society of Canada [21], the connection to other coordinated mass efforts such as the International Year
of Astronomy in 2009 [20] or other grassroots movements such as GLOBEATNIGHT [21]. Despite these
awareness-raising activities, few attempts to quantitatively study the impact of Earth Hour on light
pollution have been published so far. However, two cases in Spain investigated indirect light pollution
(skyglow) by measuring the night sky brightness with small photometers (Sky Quality Meters, SQM,
Unihedron, Canada). In a study in Valencia in 2012 [22] no significant reduction was observed and
in a study in Barcelona in 2016 an increase was observed [24]. Both times, the Earth Hour event was
scheduled within twilight hours, making it difficult to observe small changes (as lights are not turned
off coherently at the same time by all participants) against an elevated and changing background.
In the Barcelona study, weather conditions with moving clouds exacerbated the data interpretation [24]
as clouds amplify skyglow [17,25].
      In this work, urban light pollution measurements during Earth Hour 2018 in an urban park
(Tiergarten) in Berlin, Germany, are reported. Using a calibrated camera with a fisheye lens and a
software to produce luminance maps [17,18,26–30] the changes in brightness due to the light switch-offs
were observed with differential photometry [18]. With this technique, it was possible to track the
switching off and switching back on of the lights of Berlin’s iconic Brandenburg Gate and the buildings
of Potsdamer Platz despite the presence of moonlight.

2. Materials and Methods

2.1. Earth Hour
     In 2018, Earth Hour was scheduled on 24 arches between 8:30 and 9:30 p.m. local time (in Berlin:
UTC+1, no DST). Earth Hour is usually scheduled for the last Saturday of March each year, unless
this date coincides with the Catholic holiday of Easter, then the event is moved one week earlier (2013,
2016, 2018 next in 2024, 2027). The first Earth Hour in 2007 was scheduled at 7:30 p.m. in Sydney,
in 2008 it was moved back to 8 pm and since 2009 occurs at 8:30 p.m. local time. As the event occurs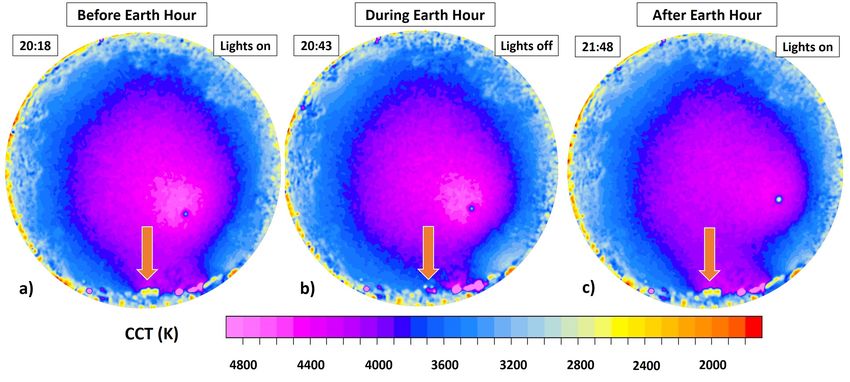
Sustainability 2019, 11, 750                                                                           3 of 16

during twilight in some countries it was rescheduled in some cities, such as in Dublin in 2008 where it
was held between 9 and 10 p.m.
     The WWF does not promote electricity savings accounting, but instead focuses on campaign
participation measurements of social media engagement, commitment pledges, and physical
turnout to organized events. The number of participating cities, municipalities, towns, universities,
and landmarks, as well as key government figurehead and celebrity endorsement, is also often
highlighted to indicate the reach and visibility of the campaign [2]. The WWF has indicated that
measurable electricity savings is not an accurate indicator of the campaign’s success since external
factors such as weather can influence results [3].

2.2. Study Site
      Measurements were conducted in an urban park (Tiergarten) in the center of Berlin, Germany.
The site and relevant landmarks are shown in see Figure 1. The camera was positioned at a clearing
(52◦ 300 50.4600 N 13◦ 220 32.1600 E, indicated by a red arrow in Figure 1) with an almost direct view (some
leafless trees were obstructing the view near horizon) to the Brandenburg Gate (green arrow in Figure 1,
52◦ 300 58.6500 N 13◦ 220 39.3400 E, distance ca. 300 m at azimuth of 30◦ ) and Potsdamer Platz. Landmarks
included the Sony Centre building complex (blue arrow in Figure 1, 52◦ 300 3600 N 13◦ 220 24 E, azimuth
210◦ , distance ca. 500 m), the Deutsche Bahn Tower (orange arrow in Figure 1, 52◦ 300 34 N 13◦ 220 3200 E,
azimuth 180◦ , distance ca. 500 m) and the Beisheim Centre building complex (grey arrow in Figure 1,
52◦ 300 4100 N 13◦ 220 3200 E).

      Figure 1. Map of the measurement site within Berlin Tiergarten with the buildings of Potsdamer
      Platz to the South and Brandenburg Gate to the North. The red arrow indicates the camera position,
      the green arrow the Brandenburg Gate, the blue arrow the Sony Centre building complex, the orange
      arrow the Deutsche Bahn Tower and the grey arrow the Beisheim Centre building complex. Source:
      Google Earth (data from March 18th 2018, arrows own addition).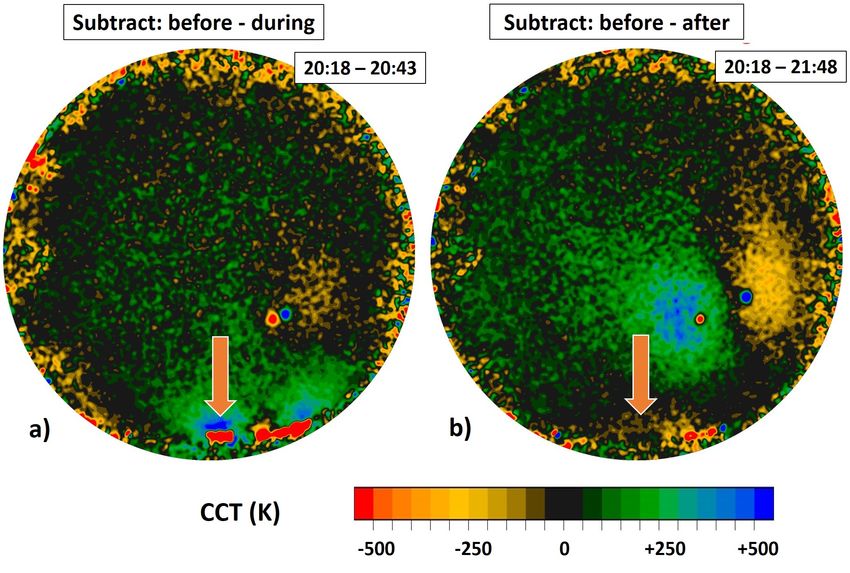
Sustainability 2019, 11, 750                                                                           4 of 16

2.3. Measurement Instrument (Calibrated DSLR Camera with Image Processing Software)
      Night-time light measurements were performed with a calibrated digital camera equipped with
a fisheye lens using images in the raw format. Luminance maps obtained with this method have
been proven to be valuable for assessment of the night sky brightness in dark sky parks [28], at urban
sites [17,18,26] or ecological sites even for challenging outdoor field-work [27,29]. For a review on
current measurement techniques see [30]. Images were obtained with a Canon EOS 6D, which has
a full-frame 20.2 Megapixel (5496 × 3670) CMOS sensor. The camera was mounted on a tripod and
operated with a circular fisheye lens (Sigma EX DG with 8 mm focal length). This lens has a field of
view of 180◦ and was always used at full aperture of 3.5. All-sky images were obtained by aligning the
camera lens towards the zenith. The camera was set to ISO 3200 and a shutter time of 1s. A remote
control was programmed to take an image every 10 s. Between 20:21 and 21:51 local time, a total of
543 images were obtained.
      For image processing the commercial ”Sky Quality Camera” software (Version 1.8, Euromix,
Ljubljana, Slovenia) was used. Figure 2 shows an all-sky RGB image obtained before the switch-off.
In this all-sky projection, North is in the upper part of the image, South in the lower part, East to the left
and West to the right. Potsdamer Platz is in the South (lower part of the image) and the Brandenburg
Gate to the North (upper part of the image). Arrows indicate landmarks in the same color code as in
Figure 1.

      Figure 2. RGB image obtained before the switch-off in all-sky projection. The green arrow the
      Brandenburg Gate, the blue arrow the Sony Centre building complex, the orange arrow the Deutsche
      Bahn Tower and the grey arrow the Beisheim Centre building complex.

     The camera was calibrated by the software manufacturer, including photometric calibration
using the green channel of the camera, as well as correction of optical aberrations such as vignetting.
The calibration of the camera is done in the field as well as in the laboratory. The field calibration is
following classical astronomical photometry during a night of photometric quality, where there is a
constant ratio between air-mass and extinction. Over the course of a night extinction and brightness
measurements are performed on different stars and a cross calibration is done with multiple cameras
(see Appendix in [30] or [31] for full procedure). Vignetting calibration is done in the laboratory by
imaging a surface with a defined brightness under different angles (see for example [28]).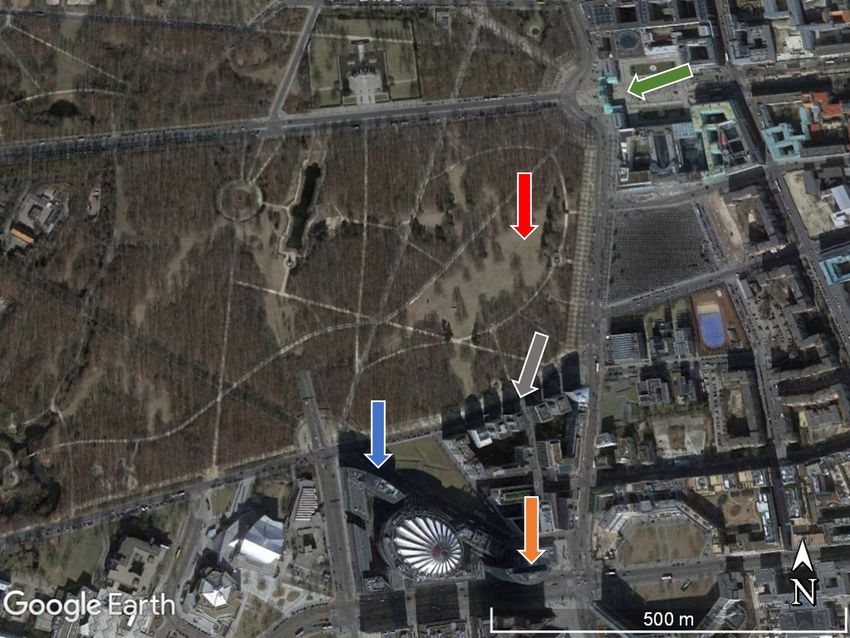
Sustainability 2019, 11, 750                                                                         5 of 16

     The software calculates the luminance Lv,sky for each camera pixel (luminance is commonly
referred to as “brightness” referenced to human vision). Furthermore, the software allows acquisition
of the cosine corrected illuminance Ev,cos in the imaging plane:
                                          Z       π   Z 2π
                                                  2
                               Ev,cos =                           Lv,sky (θ, φ)sinθcosθdφdθ,            (1)
                                              0           0

and the scalar illuminance for the imaging hemisphere Ev,scal,hem without cosine correction:
                                                      Z       π   Z 2π
                                                              2
                               Ev,scal,hem =                             Lv,sky (θ, φ)sinθdφdθ.         (2)
                                                          0        0

     In the equations, Lv,sky is the sky luminance, θ is the zenith angle and φ is the azimuth angle.
For all-sky images, i.e., when imaging in the horizontal plane, Ev,cos is usually termed horizontal
illuminance Ev,hor .
     From the three spectral channels, color correlated temperature (CCT) is calculated by the software.
CCT describes the temperature of black body radiation that most closely matches the color spectrum
of the observed light. For example, candles emit so called warm-white light with a low CCT of ca.
2000 K and sunlight is cold-white with a CCT of about 5800 K. The software provides luminance and
CCT maps, allows subtraction of one image from another, to analyze multiple images (batch analysis),
sectors of the image, and to do cross sections.

2.4. Weather Conditions
     During the measurements, the sky was almost clear with some cirrus clouds at higher altitudes,
cloud cover was classified as one okta or less, but not zero. Height of base of lowest observed
cloud was classified as 2500 m or higher, or no clouds. There were no stratocumulus, stratus,
cumulus, cumulonimbus, altocumulus, altostratus and nimbostratus but cirrus of type 2, in patches or
entangled sheaves. Temperature decreased from 3.5 ◦ C at 20:00 local time to 1.0 ◦ C at 22:00 local time.
The humidity was between 75% and 85%. Although near the dew point, no fog was obviously visible
or reported. Historical weather data were extracted from ogimet.com.

2.5. Sun (Twilight) and Moon
      During the measurements, the sun changed altitude from −19◦ to −26◦ . Astronomical night
(sun below 18◦ ) just started a few minutes before Earth Hour at 20:24 local time. The moon was near
first quarter (phase angle ca. 85◦ , ≈51% illuminated) and descending, changing its altitude from about
50◦ at the beginning of the measurements to about 40◦ at the end. the resulting illuminance from
moonlight can be estimated to range between 20 mlx (50◦ altitude) and 16 mlx (40◦ altitude) [32,33] .

3. Results

3.1. Luminance Maps
     Figure 3 shows luminance maps obtained on 24 March 2018 (a) before Earth Hour with lights on
at 20:18 local time, (b) during Earth Hour with lights off at 20:43 local time and (c) after Earth Hour
with lights back on at 21:48 local time. The biggest change occurs in the South (lower part of the image)
where the switching on and off of the Deutsche Bahn building (orange arrow) is obvious and a bright
area (white color in false color plot) can be seen in Figure 3a,c but not in Figure 3b. Smaller changes can
be spotted at the Sony center building (right hand side of Deutsche Bahn Tower) and the Brandenburg
Gate (green arrow).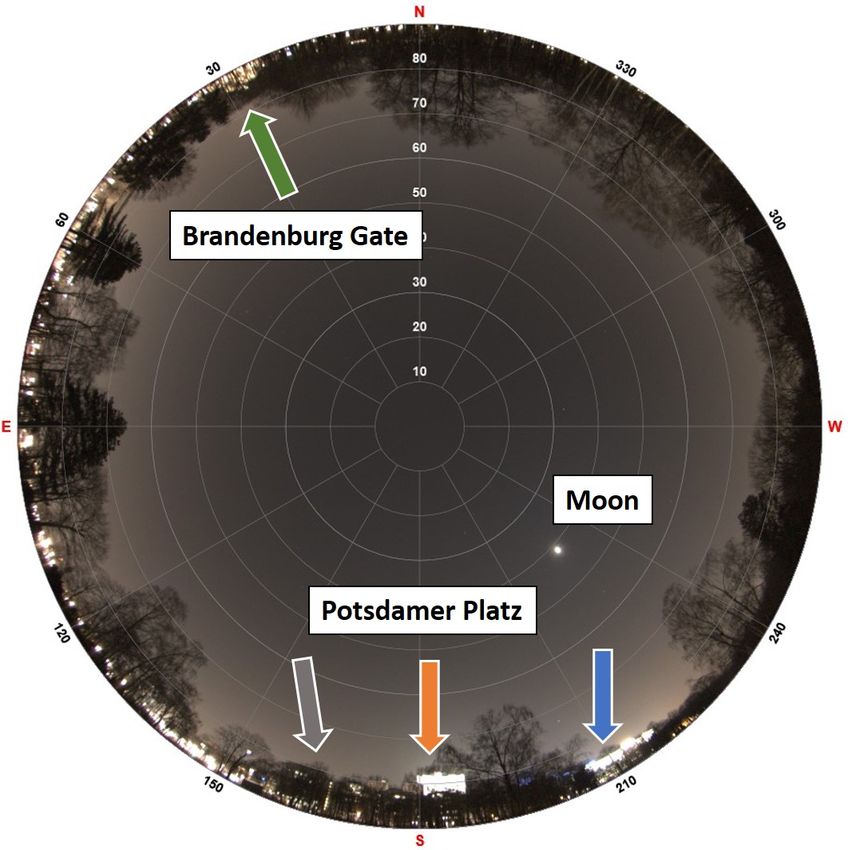
Sustainability 2019, 11, 750 6 of 16
Figure 3. Luminance maps on 24 March (a) before Earth Hour at 20:18 local time, (b) during Earth
Hour at 20:43 local time and (c) after Earth Hour at 21:48 local time. The green arrow indicates the
Brandeburg Gate, the blue arrow the Sony Centre building complex, the orange arrow the Deutsche
Bahn Tower and the grey arrow the Beisheim Centre building complex.
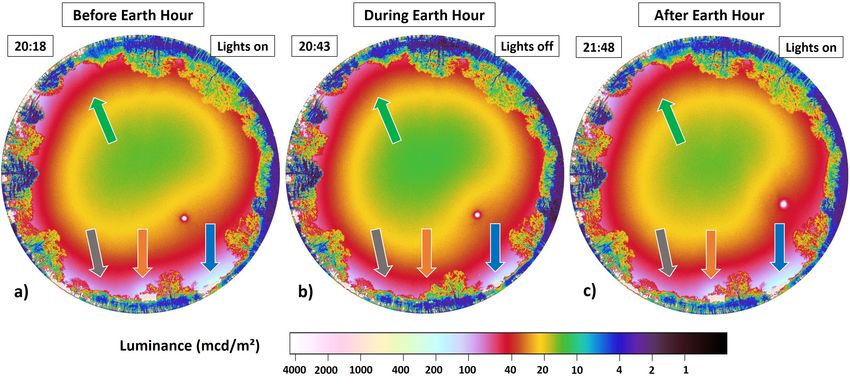
The differences become more obvious when subtracting the data from two images from another.
Figure 4a shows the difference in luminance between , before and during Earth Hour obtained by
subtracting the image taken during Earth Hour (Figure 3b) from the image obtained before Earth Hour
(Figure 3a). The red areas in Figure 4a indicate a higher luminance before Earth Hour and the green
areas in Figure 4 indicate a higher luminance during Earth Hour. The most obvious change is the
moon, which changed position with respect to the observer as can be seen by the red and green dot in
the lower right part of the image center.
Figure 4. Difference in luminance between the images shown in Figure 3. (a) shows the difference
between obtained by subtracting the image obtained after the switch-off (Figure 3b) from the image
obtained before the switch-off (Figure 3a). (a) shows the difference in luminance between before and
after Earth Hour by subtracting the image obtained after Earth Hour (Figure 3c) from the image taken
before Earth Hour (Figure 3a). Red areas indicate a higher luminance before the switch-off and the
green areas a higher luminance after the switch-off. The green arrow indicates the Brandeburg Gate,
the blue arrow the Sony Centre building complex, the orange arrow the Deutsche Bahn Tower and the
grey arrow the Beisheim Centre building complex.Sustainability 2019, 11, 750 7 of 16
Most parts of the image show reduced luminance with the switching off of the lights during
Earth Hour (red colors), most notably in the lower part of the image (Potsdamer Platz, orange arrow
indicates Deutsche Bahn Tower) and in the upper part of the image near Brandenburg Gate (green
arrow). Only some regions remain at the same luminance (black colors), mainly the trees near the
horizon. Only a few parts of the image show an increased luminance (green colors), mainly at the right
side of the image due to moonlight.
Figure 4b shows the difference in luminance between before and after Earth Hour by subtracting
the image obtained after Earth Hour (Figure 3c) from the image taken before Earth Hour (Figure 3a).
The red areas in Figure 4b indicate a higher luminance before Earth Hour and the green areas in
Figure 4 indicate a higher luminance after Earth Hour. The change of the moon position is even more
apparent than in Figure 4a. Most parts of the image show no change in luminance before and after
Earth Hour (dark areas). The biggest changes are due to moonlight as the moon moved westwards.
3.2. Color Correlated TemperatureMaps
Figure 5 shows CCT maps obtained on 24 March 2018 (a) before Earth Hour with lights on at
20:18 local time, (b) during Earth Hour with lights off at 20:43 local time and (c) after Earth Hour with
lights back on at 21:48 local time. For CCT, a smoothing over 5 pixel was applied. The biggest change
occurs in the South (lower part of the image) around Potsdamer Platz, mainly near Deutsche Bahn
building (orange arrow).
Figure 5. CCT maps on March 24th (a) before Earth Hour at 20:18 local time, (b) during Earth Hour
at 20:43 local time and (c) after Earth Hour at 21:48 local time. Orange arrow indicates Deutsche
Bahn tower.
Figure 6a shows the difference in CCT between before and during Earth Hour obtained by
subtracting the image taken during Earth Hour (Figure 5b) from the image taken before Earth Hour
(Figure 5a). Yellow and red areas indicate a lower CCT and green and blue areas a higher CCT before
Earth Hour. Overall, changes in CCT are not big and the most obvious change occurs in the lower part
of the image (Potsdamer Platz, orange arrow indicates Deutsche Bahn Tower) with green and blue
indicating a higher CCT (a higher content of short wavelength light) before Earth Hour.
Figure 6b shows the difference in CCT between before and after Earth Hour by subtracting the
image obtained after Earth Hour (Figure 5c) from the image obtained before Earth Hour (Figure 5a).
Yellow and red areas indicate a lower CCT and green and blue areas a higher CCT before Earth Hour.
Most parts of the image show no change in CCT before and after Earth Hour (dark areas) and the
biggest changes are due to moonlight as the moon moved westwards.Sustainability 2019, 11, 750 8 of 16
Figure 6. Difference in CCT between the images shown in Figure 5. (a) shows the CCT difference
obtained by subtracting the image taken during Earth Hour (Figure 5b) from the image obtained before
Earth Hour (Figure 5a). (b) shows the difference in CCT between before and after Earth Hour by
subtracting the image obtained after Earth Hour (Figure 5c) from the image obtained before Earth Hour
(Figure 5a). Yellow and red areas indicate a lower CCT before Earth Hour and green and blue areas a
higher CCT before the switch-off. Orange arrow indicates Deutsche Bahn Tower.
3.3. Time series Analysis
Figures 7 and 8 show data extracted from the time series of 543 images taken around Earth Hour,
green vertical lines indicate switching on and off of lights at Brandenburg Gate and orange vertical
lines indicate switching on and off of lights at Potsdamer Platz.
3.3.1. Luminance and Illuminance Time series
Figure 7a shows the zenith luminance (measured in a 30◦ circle), (b) the horizontal illuminance
(cosine corrected) and (c) the scalar illuminance (not cosine corrected) of the imaging hemisphere
(see methods for details) as a function of local time. All three graphs show about the same trend.
The switching off of Brandenburg Gate at 20:30 local time has only a minor influence on measured
values, but the switching off of lights around Potsdamer Platz a few minutes later (20:38) shows a
sharp drop in measured values in all three graphs. The switching back on of Brandenburg Gate lights
is hardly perceivable in the data, but the switching on of lights at Potsdamer Platz is. Lights do not turn
on immediately, but ramp up slowly, which indicates the use of traditional gas discharge lamps rather
than LEDs. Differences are that zenith luminance and horizontal illuminance show higher fluctuations
than scalar illuminance and that zenith luminance and scalar illuminance return after Earth Hour to
about the same values as before but horizontal illuminance is higher after Earth Hour.
Values of horizontal, scalar illuminance and zenith luminance averaged over 5 min are
summarized in Table 1 with errors being standard deviation. The upper set of rows shows the
values before and after switching off the lights at Brandenburg Gate (BBG). The change was on the
order of 1–2%. The middle set of rows shows the values before and after switching off the lights at
Potsdamer Platz (PP). The change was notable with up to 15% decrease in scalar illuminance, while
horizontal illuminance decreased by 11% and zenith luminance by 8%, respectively. The lower set of
rows shows the comparison between before and after Earth Hour (EA) by comparing the first 5 min
and the last 5 min of the measurements. While scalar and zenith luminance returned to the starting
values, horizontal illuminance increased by 2%. This is even more surprising, as the moon was setting
and the theoretical horizontal illuminance from lunar light should have decreased from 20 mlx toSustainability 2019, 11, 750 9 of 16
16 mlx. Correcting this offset by subtracting the theoretical lunar illumination results in an increase of
8% in horizontal illuminance.
a) b)
c)
Figure 7. (a) Zenith luminance, (b) horizontal illuminance (cosine corrected) and (c) scalar illuminance
(not cosine corrected) as a function of local time calculated from the all-sky images time series.
The green vertical lines indicate the switching on and off of lights near Brandenburg Gate and
the orange vertical lines indicate the switching on and off of lights near Potsdamer Platz.
Table 1. Illuminance and luminance values averaged over 5 min. BBG—Brandenburg Gate,
PP—Potsdamer Platz, EA—Earth Hour.
Horizontal Scalar Zenith
Illuminance Illuminance Luminance
Ev,hor Ev,hor Lv,zen
(mlx) (mlx) (mcd/m2 )
before BBG off 84.2 ± 0.2 215.1 ± 2.0 16.3 ± 0.1
after BBG off 83.2 ± 0.9 210.7 ± 3.8 16.0 ± 0.1
rel. change −1% −2% −2%
before PP off 83.4 ± 1.0 211.6 ± 1.0 15.9 ± 0.1
after PP off 75.0 ± 0.3 183.9 ± 0.9 14.7 ± 0.1
rel. change −11% −15% −8%
before EA 83.7 ± 0.2 216.4 ± 0.8 16.2 ± 0.1
after EA 85.3 ± 0.5 217.2 ± 0.9 16.1 ± 0.2
rel. change +2% ±0% ±0%
3.3.2. Color Correlated Temperature Time series
Figure 8a shows the cosine corrected CCT (for the horizontal plane) and (b) the not cosine corrected
CCT (scalar) of the imaging hemisphere as a function of local time. The data fluctuates a lot more and
the signal to noise is much worse than in the luminance data (Figure 7). Due to these fluctuations,
a clear pattern of the two major switch-off events at this position is not apparent. Although there
are some smaller changes visible near the PP switch-off times (orange vertical lines), the signal is not
strong enough and such fluctuations occur at other times, too.Sustainability 2019, 11, 750 10 of 16
a) b)
Figure 8. CCT values as a function of local time calculated from the all-sky images time series (a) cosine
corrected and (b) the not cosine corrected (scalar). The green vertical lines indicate the switching on
and off of lights near Brandenburg Gate and the orange vertical lines indicate the switching on and off
of lights near Potsdamer Platz.
Values of cosine corrected and scalar CCT averaged over 5 min are summarized in Table 2 with
errors being standard deviation. The upper set of rows shows the values before and after switching
off the lights at Brandenburg Gate (BBG), the middle set of rows shows the values before and after
switching off the lights at PP and the lower set of rows shows the comparison between before and after
Earth Hour (EA) by comparing the first 5 min and the last 5 min of the measurements. Most changes
are within the error of the measurement (standard deviation) apart from a slightly higher change in
cosine corrected CCT, which is still not significant given other influences (i.e., atmospheric conditions,
other lighting changes than Earth Hour events).
Table 2. CCT values averaged over 5 min with error being standard deviation. BBG—Brandenburg
Gate, PP—Potsdamer Platz, EA—Earth Hour.
CCT CCT
(Cosine) (Scalar)
before BBG off 3873 ± 15 3517 ± 16
after BBG off 3868 ± 10 3526 ± 13
∆ 5 9
before PP off 3868 ± 15 3527 ± 14
after PP off 3824 ± 16 3501 ± 16
∆ 44 26
before EA 3887 ± 14 3507 ± 13
after EA 3837 ± 16 3505 ± 14
∆ 50 2
4. Discussion
4.1. Summary of Main Results
The impact of a coordinated mass event, WWF Earth Hour, that includes switching off lights
for one hour, was used to study its impact on light pollution in an urban park in Berlin. By using
differential photometry with a commercial DSLR camera and a fisheye lens, the impact of Earth
Hour was detectable despite the presence of moonlight. Spatially resolved luminance maps allowed
extraction of the zenith luminance, and horizontal and scalar illuminance. Thus, direct and indirect
light pollution could be measured. The biggest change occurred when the lights at the nearby PP were
switched off with up to 15% decrease in scalar illuminance, 11% decrease in horizontal illuminance
and 8% decrease in zenith luminance. After the end of the event, with the lights being switched backSustainability 2019, 11, 750 11 of 16
on, values returned to approximately starting values. A spatially resolved analysis of the CCT showed
only small changes at specific spatial directions.
4.2. Previous Work on Earth Hour and Light Pollution
There exists some previous work on Earth Hour and light pollution measurements.
Marco et al. [22] used a SQM a few km outside of the city of Valencia, Spain during Earth Hour
2012 (31 March). However, although the lights of some main buildings were switched off during Earth
Hour, this could not be detected with the small photometers. This is partially because it was scheduled
a week after the daylight-saving time change in Valencia. Therefore, the sunset was just a few minutes
before the event (20:24) and astronomical twilight ended after Earth Hour as late as 21:56.
Martí Devesa [24] investigated Earth Hour 2015 (28 March between 20:30 and 21:30) by analyzing
the data obtained with a permanently installed SQM at the Faculty of Physics at the Universitat
de Barcelona. On this day and at this location, the sun position at the start was already −15◦ and
astronomical twilight ended at 20:45 local time. Unfortunately, moving clouds masked the switch-off
as clouds amplify the night sky brightness in Barcelona and surroundings [17,25]. Martí Devesa also
analyzed the 2016 event with the same result [24].
4.3. Previous Work on Regular or Organized Switch-Offs
Differential photometry was used to study the change in night sky brightness and illuminance
during an automated regular switch-off of ornamental light in the town of Balaguer, Spain and an
organized switch-off of all public lights in the nearby village of Àger, close to Montsec Astronomical
Park [18]. The sites were observed during two nights with clear and cloudy conditions using a DSLR
camera and a fisheye lens, the same method as used in this work. A time series of images made
it possible to track changes in lighting conditions and sky brightness simultaneously. During the
clear night, the ornamental lights in Balaguer contributed over 20% of the skyglow at zenith at the
observational site. Furthermore, very small changes in the ground illuminance on a cloudy night near
Àger were detected [18].
4.4. Earth Hour vs. Regular and Organized Switch-Offs
There are several drawbacks regarding the study of light pollution and Earth Hour: first, it is
happening only once a year and only for one-hour duration. Furthermore, Earth Hour is not scheduled
to happen in astronomical night or at new moon, as the intention of the event is raising awareness of
energy consumption and light pollution is only a side effect. The biggest advantage of Earth Hour
is that private lighting can be studied, while regular or organized switch-offs usually involve public
lighting [18]. Studying private lights is still challenging, as a synchronized switch-off of all public
lights at the same time is unrealistic. A regular switch-off (happening for example daily) has the
advantage that the measurements can be scheduled at favorable conditions (new moon, clear sky) or
that different weather conditions can be studied for example clouds [18]. An organized switch-off
relies also on weather conditions, as does Earth Hour. A clever combination of exploiting Earth Hour
(or similar events) and studying regular as well as planned switch-offs could help to disentangle the
contributions of private and public lighting on skyglow.
4.5. Sun and Moon for Earth Hour 2019 and 2020 around the World
As mentioned above, Earth Hour is usually scheduled for the last Saturday of March each year
between 20:30 and 21:30 p.m. Depending on time zone and latitude, twilight might affect this event at
some locations. Furthermore, moonlight might affect the detectability of the switching off of lights.
The times for sunset, the end of astronomical twilight and moonlight (moonset time and illumination)
are summarized in the Table 3, all times are local time and the time zone difference to GMT for the
specified dates are given for each location. In 2019, no moonlight will affect Earth Hour and in 2020 inSustainability 2019, 11, 750 12 of 16
most locations the effect due to moonlight will be not high (waning crescent, phase angle ca. −120◦ ,
illumination ≈ 12–18%) and it is close to the horizon at most sites (Ev,hor,moon < 5mlx) [32,33].
Generally speaking, the higher the latitude and the further west within a time zone, the less
favorable for with night during Earth Hour (see London and Reykjavik in GMT). Daylight savings time
is also unfavorable as it shifts solar noon to later times. Of the 21 cities listed, 8 are affected by twilight
(9 including Berlin but there the effect is minor). New York City, Santiago de Chile and San Francisco
are in daylight savings time, Paris and Madrid are far west within their time zone, Moscow (55.8◦ N)
and Stockholm (59.3◦ N) are at relatively high latitudes and Reykjavik (64.1◦ N) close to the arctic
circle. However, in all cities (apart from Reykjavik) astronomical twilight will end within Earth
Hour. Such data can be acquired at different sources (see for example website timeanddate.com) [34].
Table 3. Sun and moon for Earth Hour 2019 and 2020 at selected cities.
End of Astronomical Moonlight
Date (DD.MM.YYYY) Sunset
Twilight (Set, Illumination)
Sydney Australia (GMT +11)
30.03.2019 18:53 20:16 no
28.03.2020 18:55 20:18 yes (21:10, 13%)
Tokyo Japan (GMT +9)
30.03.2019 18:00 19:27 no
28.03.2020 17:59 19:26 yes (21:28, 13%)
Hong Kong (GMT +8)
30.03.2019 18:37 19:52 no
28.03.2020 18:37 19:52 yes (21:53, 13%)
Shanghai China (GMT +8)
30.03.2019 18:11 19:33 no
28.03.2020 18:10 19:32 yes (21:36, 13%)
Dubai UAE (GMT +4)
30.03.2019 18:34 19:51 no
28.03.2020 18:33 19:50 yes (22:02, 14%)
Moscow Russia (GMT +3)
30.03.2019 19:02 21:16 no
28.03.2020 19:00 21:12 yes (23:30, 15%)
Athens Greece (GMT +2)
30.03.2019 18:45 20:15 no
28.03.2020 18:44 20:14 yes (22:35, 15%)
Cairo Egypt (GMT +2)
30.03.2019 18:12 19:33 no
28.03.2020 18:11 19:32 yes (21:49, 15%)
Cape Town South Africa (GMT +2)
30.03.2019 18:44 20:07 no
28.03.2020 18:46 20:09 yes (21:13, 15%)
Berlin Germany (GMT +1)
30.03.2019 18:36 20:37 no
28.03.2020 18:34 20:34 yes (22:58, 15%)Sustainability 2019, 11, 750 13 of 16
Table 3. Cont.
End of Astronomical Moonlight
Date (DD.MM.YYYY) Sunset
Twilight (Set, Illumination)
Madrid Spain (GMT +1)
30.03.2019 19:36 21:10 no
28.03.2020 19:35 21:08 yes (23:35, 16%)
Paris France (GMT +1)
30.03.2019 19:17 21:08 no
28.03.2020 19:16 21:05 yes (22:31, 15%)
Rome Italy (GMT +1)
30.03.2019 18:32 20:08 no
28.03.2020 18:31 20:06 yes (23:32, 16%)
Stockholm Sweden (GMT +1)
30.03.2019 18:24 20:56 no
28.03.2020 18:21 20:52 yes (23:10, 15%)
London UK (GMT)
30.03.2019 18:29 20:27 no
28.03.2020 18:27 20:25 yes (22:51, 16%)
Reykjavik Iceland (GMT)
30.03.2019 20:12 23:26 no
28.03.2020 20:08 23:18 yes ( next day, 16%)
Rio de Janeiro Brazil (GMT −3)
30.03.2019 17:54 19:08 no
28.03.2020 17:53 19:08 yes (20:44, 16%)
Santiago Chile (GMT −3)
30.03.2019 19:40 21:02 no
28.03.2020 19:42 21:04 yes (22:19, 17%)
New York USA (GMT −5)
30.03.2019 19:18 20:52 no
28.03.2020 19:17 20:50 yes (23:28, 17%)
Mexico City Mexico (GMT −6)
30.03.2019 18:50 20:03 no
28.03.2020 18:49 20:03 yes (22:33, 18%)
San Francisco USA (GMT −8)
30.03.2019 19:30 21:00 no
28.03.2020 19:29 20:58 yes (22:35, 18%)
4.6. Future Directions
The single point study presented here shows a clear result, while studies previously published
did not. This depends on choice of site and potentially instrument as well. The signal that can be
measured depends on how much of the surrounding light is switched on or off. As this is mostly not
known (due to private participants of unknown number), several sites should be considered when
doing an attempt to investigate Earth Hour. Each site should be near a major source of light pollution
that will be switched off during Earth Hour, but with low surrounding illumination. That was also the
reason for picking the site within an urban park in the city center.
Furthermore, it would be interesting at what distance a switch-off at a major site (like Berlin PP)
can be detected (or at what distance it still makes an impact, respectively). Thus, it would be advisable
to use several identical measurement instruments distributed over a larger area within the city limitsSustainability 2019, 11, 750 14 of 16
at different observation positions. It would be also interesting to intercompare results from different
devices. One could for example:
• distribute several identical measurement systems (all-sky camera systems are advised) within
urban parks close to landmarks that will be switched off during Earth Hour.
• combine imaging measurements with high frequency measurements from single channel devices
(i.e., SQMs).
• integrate existing long-term light pollution observation stations.
It would be interesting to gather additional information and for example analyze the relation
between private lighting an energy consumption. This could include:
• inventory of large corporate and public participants.
• electricity consumption data.
It should be further feasible to use existing communication strategies around Earth Hour and
light pollution to integrate citizen-scientist measurements with night sky brightness measurements.
One could further acquire social media data from platforms such as Twitter and integrate such data in
the analysis to estimate participation.
5. Conclusions
In conclusion, differential photometry with a commercial DSLR camera and a fisheye lens enabled
investigation of the effect of Earth Hour on light pollution in an urban park in Berlin, despite the
presence of moonlight. A time series of all-sky images allowed the extraction of zenith luminance,
and horizontal and scalar illuminance, and the detection of changes in all these parameters. CCT data
showed no significant change. This is the first successful report the author is aware of measuring the
impact of Earth Hour on light pollution with quantitative methods.
Taking both sun and moon illumination for the next Earth Hour events (2019, 2020) into account,
there are several places around the world that will allow future studies. These include several of the
landmarks highlighted by the WWF in their 2018 report. It is advised to plan future observations
within urban parks next to major switch-off sites and to use an all-sky imaging time series, ideally in
combination with other devices or citizen scientists to evaluate the capability of alternative systems to
study such events in the future.
In the long run, both reduction of energy consumption and light pollution should be goals of
such events. Switching off lights for one hour per year is certainly not enough. WWF is advocating to
reduce energy usage in the context of climate change. Light pollution researchers could also advocate
to reduce usage of private light and to switch off ornamental lighting on a routinely basis. Such data
as presented here, or more future data, can potentially help in arguing for such lighting habit changes.
Funding: AJ is supported by the Leibniz Association, Germany within the ILES (SAW-2015-IGB-1) and CONNECT
(SAW-K45/2017) projects and by the IGB Leibniz Institute through the Frontiers in Freshwater Science project
(IGB Frontiers 2017). Some aspects of this manuscript were inspired due to collaboration within the COST
Action ES1204 LoNNe (Loss of the Night Network), supported by COST (European Cooperation in Science and
Technology). The publication of this article was funded by the Open Access Fund of the Leibniz Association.
Acknowledgments: The author thanks the ILES team, the LoNNe measurement fraction, the Stars4all network
and particularly Franz Hölker and Chris Kyba for fruitful discussions.
Conflicts of Interest: The author declares no conflict of interest.
References
1. WWF Earth Hour. Available online: https://www.earthhour.org (accessed on 10 January 2019).
2. Earth Hour Report 2018. Available online: http://awsassets.panda.org/downloads/earth_hour_2018_
report.pdf (accessed on 10 January 2018).Sustainability 2019, 11, 750 15 of 16
3. Olexsak, S.J.; Meier, A. The electricity impacts of Earth Hour: An international comparative analysis of
energy-saving behavior. Energy Res. Soc. Sci. 2014, 2, 159–182. [CrossRef]
4. Cheong, M.; Lee, V. Twittering for earth: A study on the impact of microblogging activism on Earth Hour 2009
in Australia. In Asian Conference on Intelligent Information and Database Systems; Springer: Berlin/Heidelberg,
Germany, 2010; pp. 114–123.
5. Sison, M.D. Creative strategic communications: A case study of Earth Hour. Int. J. Strateg. Commun. 2013, 7,
227–240. [CrossRef]
6. Ärlemalm-Hagsér, E. Minds on Earth Hour—A theme for sustainability in Swedish early childhood
education. Early Child Dev. Care 2013, 183, 1782–1795. [CrossRef]
7. Falchi, F.; Cinzano, P.; Duriscoe, D.; Kyba, C.C.M.; Elvidge, C.D.; Baugh, K.; Portnov, B.A.; Rybnikova, N.A.;
Furgoni, R. The new world atlas of artificial night sky brightness. Sci. Adv. 2016, 2, e1600377. [CrossRef]
[PubMed]
8. Bará, S. Anthropogenic disruption of the night sky darkness in urban and rural areas. R. Soc. Open Sci. 2016,
3, 160541. [CrossRef] [PubMed]
9. Kyba, C.C.M.; Kuester, T.; de Miguel, A.S.; Baugh, K.; Jechow, A.; Hölker, F.; Bennie, J.; Elvidge, C.D.;
Gaston, K.J.; Guanter, L. Artificially lit surface of Earth at night increasing in radiance and extent. Sci. Adv.
2017, 3, e1701528. [CrossRef] [PubMed]
10. Riegel, K.W. Light Pollution. Science 1973, 179, 1285–1291. [CrossRef]
11. Cho, Y.; Ryu, S.H.; Lee, B.R.; Kim, K.H.; Lee, E.; Choi, J. Effects of artificial light at night on human health:
A literature review of observational and experimental studies applied to exposure assessment. Chronobiol. Int.
2015, 32, 1294–1310. [CrossRef]
12. Longcore, T.; Rich, C. Ecological light pollution. Front. Ecol. Environ. 2004, 2, 191–198. [CrossRef]
13. Schroer, S.; Hölker, F. Impact of lighting on flora and fauna. In Handbook of Advanced Lighting Technology;
Springer: Berlin, Germany, 2017; pp. 957–989.
14. Knop, E.; Zoller, L.; Ryser, R.; Gerpe, C.; Hörler, M.; Fontaine, C. Artificial light at night as a new threat to
pollination. Nature 2017, 548, 206–209. [CrossRef]
15. Kurvers, R.H.; Drägestein, J.; Hölker, F.; Jechow, A.; Krause, J.; Bierbach, D. Artificial light at night affects
emergence from a refuge and space use in guppies. Sci. Rep. 2018, 8, 14131. [CrossRef] [PubMed]
16. Rosebrugh, D.W. Sky-Glow from large cities. J. R. Aastron. Soc. Can. 1935, 29, 79.
17. Jechow, A.; Kolláth, Z.; Ribas, S.J.; Spoelstra, H.; Hölker, F.; Kyba, C.C.M. Imaging and mapping the impact
of clouds on skyglow with all-sky photometry. Sci. Rep. 2017, 7, 6741. [CrossRef] [PubMed]
18. Jechow, A.; Ribas, S.J.; Domingo, R.C.; Hölker, F.; Kollath, Z.; Kyba, C.C.M. Tracking the dynamics of skyglow
with differential photometry using a digital camera with fisheye lens. J. Quant. Spectrosc. Radiat. Transf. 2018,
209, 212–223. [CrossRef]
19. Claudio, L. Switch on the night: Policies for smarter lighting. Environ. Health Perspect. 2009, 117, A28.
[CrossRef] [PubMed]
20. Pompea, S.M.; Schweitzer, A.; Deustua, S.; Isbell, D.; Fienberg, R.T.; Arion, D.N.; Walker, C.E.; Gay, P.L.;
Smith, D.A.; Pantoja, C.A.; et al. International Year of Astronomy 2009 Cornerstone Projects: What’s
Available for You. In Science Education and Outreach: Forging a Path to the Future: Proceedings of a Conference
Held at Millbrae, California, USA, 12–16 September 2009; Astronomical Society of the Pacific: San Francisco,
CA, UAS, 2010; Volume 431, p. 86.
21. Walker, C.E.; Pompea, S.M. National education program for energy efficient illumination engineering.
In Proceedings of the SPIE Eco-Photonics 2011: Sustainable Design, Manufacturing, and Engineering
Workforce Education for a Green Future, Strasbourg, France, 28–30 MARCH 2011; International Society for
Optics and Photonics: Bellingham, WA, USA, 2011; Volume 8065, p. 80650Q.
22. Marco, E.; Morales-Rubio, A.; Bullón, J.M. Light pollution in Valencian Natural Parks: Where Light not
only annoys astronomers. In Proceedings of the X Scientific Meeting of the Spanish Astronomical Society,
Valencia, Spain, 9–13 July 2012; pp. 981–986.
23. Edensor, T. The gloomy city: Rethinking the relationship between light and dark. Urban Stud. 2015, 52,
422–438. [CrossRef]
24. Martí Devesa, G. Light Pollution in Barcelona: Night Sky Brightness Analysis. Bachelor’s Thesis, Universitat
de Barcelona, Barcelona, Spain, 2016.Sustainability 2019, 11, 750 16 of 16
25. Ribas, S.J.; Torra, J.; Paricio, S.; Canal-Domingo, R. How Clouds are Amplifying (or not) the Effects of ALAN.
Int. J. Sustain. Light. 2016, 18, 32–39. [CrossRef]
26. Kolláth, Z. Measuring and modelling light pollution at the Zselic Starry Sky Park. J. Phys. Conf. Ser. 2010,
218, 012001. [CrossRef]
27. Jechow, A.; Hölker, F.; Kolláth, Z.; Gessner, M.O.; Kyba, C.C.M. Evaluating the summer night sky brightness
at a research field site on Lake Stechlin in northeastern Germany. J. Quant. Spectrosc. Radiat. Transf. 2016, 181,
24–32. [CrossRef]
28. Kolláth, Z.; Dömény, A. Night sky quality monitoring in existing and planned dark sky parks by digital
cameras. Int. J. Sustain. Light. 2017, 19, 61–68. [CrossRef]
29. Jechow, A.; Kolláth, Z.; Lerner, A.; Hänel, A.; Shashar, N.; Hölker, F.; Kyba, C.C.M. Measuring Light Pollution
with Fisheye Lens Imagery from A Moving Boat, A Proof of Concept. Int. J. Sustain. Light. 2017, 19, 6–16.
[CrossRef]
30. Hänel, A.; Posch, T.; Ribas, S.J.; Aubé, M.; Duriscoe, D.; Jechow, A.; Kollath, Z.; Lolkema, D.E.; Moore, C.;
Schmidt, N.; et al. Measuring night sky brightness: Methods and challenges. J. Quant. Spectrosc. Radiat.
Transf. 2018, 205, 278–290. [CrossRef]
31. Falchi, F. Campaign of sky brightness and extinction measurements using a portable CCD camera. Monthly
Notices of the Royal Astronomical Society 2011, 412, 33–48. [CrossRef]
32. Brown, D.R. Natural Illumination Charts; Department of the Navy, Bureau of Ships: Washington, DC,
USA, 1952.
33. Bond, D.; Henderson, F. The Conquest of Darkness. (AD 346297); Defense Documentation Center: Alexandria,
VA, USA, 1963.
34. Time and Date. Available online: https://www.timeanddate.com/astronomy/ (accessed on 9 January 2019).
c 2019 by the author. Licensee MDPI, Basel, Switzerland. This article is an open access
article distributed under the terms and conditions of the Creative Commons Attribution
(CC BY) license (http://creativecommons.org/licenses/by/4.0/).You can also read