Payment Card Reform Framework (PCRF): A Policy Evaluation Study - Policy Ideas 48 - Institute for ...
←
→
Page content transcription
If your browser does not render page correctly, please read the page content below

Policy
                                   Ideas
                                   № 48
                                   May 2018

Payment Card Reform Framework (PCRF):
       A Policy Evaluation Study

            Dr. Teo Wing Leong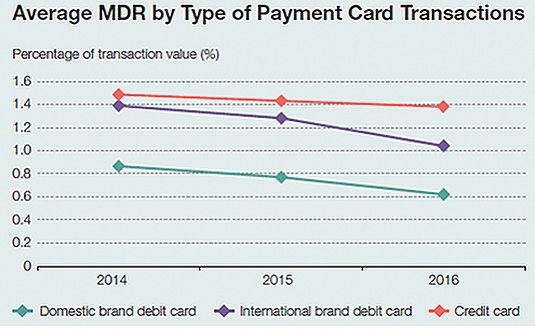
2 Payment Card Reform Framework (PCRF): A Policy Evaluation Study
Policy Ideas № 48

Executive Summary
In recent years, Bank Negara Malaysia (BNM), the Malaysian central bank, has taken various
initiatives to accelerate the migration to electronic payments (e-payments) in Malaysia. It sees
e-payments as “one of the strategic tools for achieving greater economic efficiency, productivity
and growth” (Bank Negara Malaysia, 2011). It has set ambitious targets to increase the number of
e-payment transactions per capita in Malaysia from 44 transactions in 2010 to 200 transactions
in 2020 and reduce the use of cheques by more than half, from 207 million to 100 million a year
over the same period. BNM introduced the Payment Card Reform Framework (PCRF) on 15th
January 2015 as one of its initiatives to encourage migration to e-payments. The dual objectives
of PCRF were to 1) “prevent indiscriminate increases in interchange fees and provide for an
objective and transparent framework for setting of interchange fees for domestic payment card
transactions” and 2) “address other distortions in the payment card market in order to create an
enabling environment for wider deployment of point-of-sale (POS) terminals and to promote the
greater usage and acceptance of cost effective payment cards” (Bank Negara Malaysia, 2014b).

An important aspect of the PCRF is the setting of ceilings on interchange fees for various types
of payment cards —a step that in itself creates conflicts and inconsistency within the economics
of the electronic payment system and is likely to have a limited impact and chance of success in
achieving the objectives. In fact, the progress to date has been mixed, especially in comparison
to the ambitious objectives set by the bank. There has been progress made in the placement
of terminals and use of debit cards —the primary focus of the PCRF. Credit card usage has
been largely static. As we will discuss later, most of the progress has come from steps that are
consistent with the economic parameters of the electronic payment system. This paper argues
following a market-based framework will help the central bank in achieving its policy objectives.

This paper reviews some of the assumptions underlying the Payment Card Reform Framework
(PCRF) programme, assesses its progress to date and suggests steps that might be taken to
improve the chances of achieving the Bank’s objectives. The first section of the paper reviews
some of the context and economics of the payment system within which the Bank operates.
It forms a basis for some of the assumptions and impacts of specific actions. The next section
briefly reviews the objectives and steps taken and their relationship to the basic economics. The
third section summarizes the progress to date. Finally, the last section discusses additional steps
that could be considered as well as steps that should be avoided. Further detail is provided in
the Appendix.

                      Wing Leong Teo joined the School of Economics, University of Nottingham Malaysia Campus as an
                      Associate Professor in July 2011. He received his Ph.D. in Economics from the Johns Hopkins University in
                      2006. Prior to joining UNMC, he has taught at the National Taiwan University. His research interests include
                      macroeconomics, international finance and monetary economics. Wing Leong has been an academic visitor to
                      the Federal Reserve Bank of Richmond, the City University of Hong Kong, as well as a consultant for the Central
                      Bank of China (Taiwan). He is also a research fellow of the Centre for Finance, Credit and Macroeconomics
                      (CFCM) and a research fellow and the Malaysia Coordinator for the Nottingham Centre for Research on
                      Globalisation and Economic Policy (GEP). He has assumed the role of Head of School of Economics at the
                      University of Nottingham Malaysia Campus since February 2014.

The opinion in this publication belongs to the author alone and does not reflect the opinion of the author's employer or IDEAS.

Payment Card Reform Framework (PCRF): A Policy Evaluation Study                                                                                  3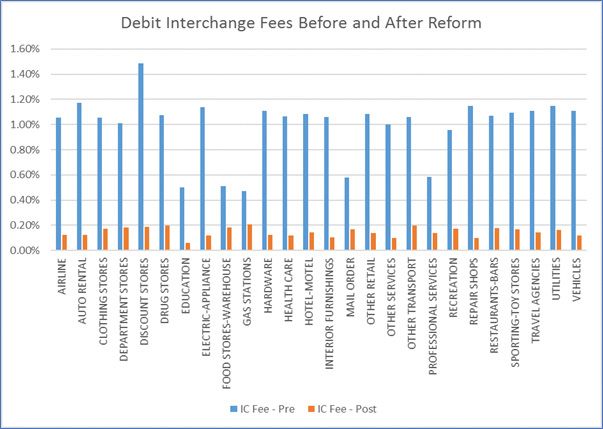
Some of the steps which BNM might consider to more effectively attain its objectives include:

                   Recognition and consideration of the value delivered to each participant in the system
                   for the costs they incur accounting for the benefits of e-commerce;

                   Avoidance of further one-sided reductions in revenue to either the debit or credit products
                   without counter measures to balance the impact;

                   Provision of tax incentives for use of a debit, credit or other e-payment vehicle;

                   Inclusion of all relevant costs in the computation of recommended interchange fees and
                   letting the market players decide;

                   Consideration of an average rate guideline (if any regulation) for credit and debit cards a
                   la Australia vs a cap to allow for increased product differentiation;

                   An education programme targeted at small and medium size merchants to illustrate the
                   value of acceptance; and

                   Direct reimbursement of merchant discounts to new accepting merchants for a limited
                   period of time.

4   Payment Card Reform Framework (PCRF): A Policy Evaluation Study
Policy Ideas № 48 1. SYSTEM CONTEXT AND ECONOMICS The three and four party payment systems consist of account holders, merchants and their banks or scheme. Revenue for the electronic payment system or scheme is collected from only two participants — the merchant or the account holder. Each should pay for the services rendered to it by the scheme or system. In the case of the merchant, it pays a merchant discount or service fee — primarily to compensate for the guaranteed transaction, a prompt payment and for processing and advertising amounts (for example, decals and terminals). This pricing can be compared to a factoring service. Account holders pay their bank account fees and interest where applicable on unsecured loans. In the four-party system, when the merchant’s bank (acquirer) is different from the account holder’s bank (issuer), an amount of the revenue collected from the merchant via the merchant discount is transferred from the acquirer to the issuer because the cost of providing some of the service to the merchant is borne by the issuer.The opposite flow exists for a cash advance. This amount is called the interchange fee. It is a subset of the merchant discount, not a determiner of it. In most parts of the world, the transfer amount representing the cost of the guarantee, funding and processing is estimated using industry averages, cost has been determined to be an objective and transparent way to establish the fee. In Malaysia, an Industry Survey in 2012 found that the cost of guaranteeing, funding and limited processing was over 2% for credit cards — substantially above the prevailing rate. Work done by the Bank indicated that the cost of selected items for debit was about 21 basis points — substantially less than other comparable studies completed in other countries. While components of the costs included can be debated, it is certainly the case that the costs of the service provided are less for debit than credit. Therefore, in Malaysia as in most parts of the world, separation of debit and credit Merchant discount and interchange pricing at appropriate levels is a positive and economically consistent step. It is also worth noting that in the computation of default interchange fees, rewards and program loyalty costs are not included. In fact, given that rewards are generally at least 1%, there is no room in the calculated result for them. The fees are only sufficient to cover the cost of the guarantee, funding and some processing. Generally, revenues from annual fees along with other issuer revenues fund rewards and other account costs. Interchange existed before rewards and has generally been reduced over time — not increased as a result of rewards. Upward or downward changes in interchange are generally within the cost envelope and reflect incentives for product use, additional costs and value, competition and underlying account characteristics. There is a macroeconomic cost to cash (printing money, circulation, collection, losses etc.) as well as a cost to the merchant to accept it; and studies indicate that effective transformation to an electronic payment system can add as much as 1% to GDP — consistent with the Bank’s estimate (Bank Negara Malaysia, 2011). Payment Card Reform Framework (PCRF): A Policy Evaluation Study 5
A few summary background comments about the four-party scheme are helpful to put the
following discussion into context:

    •     The merchant discount or service fee is collected from merchants to compensate for
          the services rendered by the system. It is the same whether or not the acquirer and
          issuer are the same or different — i.e. whether or not there is an interchange fee;
    •     Merchant discounts predate interchange fees;
    •     The interchange fee creates no new revenue for the system, but simply is an internal
          transfer of revenue from the point of collection (acquirer) to the point of cost incidence
          (issuer);
    •     Reward costs are not part of the interchange calculation. Rewards are funded by all
          issuer revenues and in particular, annual fees;
    •     Revenue for the system is only collected from the end users — account holders or
          merchants. If the revenue is reduced arbitrarily from one, it must be made up from the
          other or costs must be reduced;
    •     Cost has been determined to be transparent and objective way to establish interchange
          fees;
    •     Consumers use debit and credit for different reasons — and the size and profitability of
          the transactions are different taking into account the risk profiles — consumers make
          the purchase decisions and the choice of payment card type (debit, credit); and
    •     In arguing for lower MDR charges, retailers often claim that the savings from MDR
          reductions will be passed on to consumers. However, this is not the case in practice. It
          is reported that some retailers are imposing surcharges of 2% on the actual price of
          a product even though they are charged a MDR of 1.5% or 0.5% for card payments
          (FMT, 2018). Retailers need to understand the value of payment cards towards higher
          ticket lifts, guaranteed, timely payments and see MDR as part of the costs of operating
          a business.

6       Payment Card Reform Framework (PCRF): A Policy Evaluation Study
Policy Ideas № 48
2. THE BANK’S GENERAL GOALS AND STEPS TAKEN
BNM wishes to promote debit cards as a cost-effective payment card to displace cash and checks.
There is high penetration of debit cards in Malaysia. Less than 29% of the adult population in
Malaysia has credit cards while more than 83% of the adult population has a debit card on hand
(Borneo Post Online, 2017). However, debit card transaction per capita in Malaysia were only
3.5 in 2016 (Borneo Post Online, 2017). Advanced countries such as Australia, UK, Sweden and
Norway all have debit card transaction per capita of over 100, with Norway having 298 debit
card transaction per capita in 2012 (Bank Negara Malaysia, 2014a).
In addition to setting the ceilings of interchange fee rates, PCRF also includes other measures.
For example, PCRF requires acquirers to charge merchants specified and separate MDR for
each type of payment card (domestic debit, international debit and credit card) transactions.
This measure addresses the fact that the difference in costs of providing a debit card service
transaction versus a credit card. Along with the measure to unbundle MDR is a measure to
facilitate the identification of debit cards and international prepaid cards by mandating that all
debit cards and international prepaid cards in circulation must be visually and electronically
identifiable through the word “Debit” and “Prepaid” prominently displayed on the face of the
cards, respectively by 1st January 2018.
Other measures of PCRF include:
• removing restrictions on co-badging of debit cards;
• making acquirers responsible for ensuring that merchants do not impose any surcharge
on transactions made using debit cards or prepaid cards;
• empowering merchants to steer cardholders to use cost-effective payment cards and to
have the first priority in routing decisions;
• prohibition for an operator of a payment system to restrict or prevent the access of an
account maintained by a customer or a line of credit extended by other payment card
networks;
• requiring issuers of debit cards, prepaid cards and credit cards to offer customers the
option of obtaining basic cards, with minimal or no cardholder incentives or rewards, and
at zero nominal fee charged to customers;
• requiring issuers, acquirers and operators of payment card networks to report to BNM
on costs and fees associated with payment cards periodically;
• 0.1% of credit interchange will go towards establishing a Market Development Fund
(MDF) to fund POS terminal deployment; and
• The credit interchange ceiling of 100 bps will be adjusted in the event industry fails to
meet its KPI of POS terminal deployment.
Payment Card Reform Framework (PCRF): A Policy Evaluation Study 73. HOW DO THE QUANTITATIVE CHANGES
RELATE TO THE SYSTEM ECONOMICS?
As indicated above, steps taken which are consistent with the overall economics of electronic
payments system are more likely to result in success and attainment of the Bank’s objectives.
With that in mind, we would evaluate the primary steps as follows:
• Reducing interchange fees with no relationship to the underlying costs of providing
the service to the merchant is not likely to succeed. It results in additional cost to the
account holders in the form of increased fees or reduced services and financial inclusion;
• Separation of debit and credit is consistent with the underlying economics and an
establishment of debit interchange to or near its underlying costs is constructive;
• The minor change in credit interchange, which was already below its appropriate level,
will have little impact and further reduction would create a substantial imbalance and
encourage the use of credit vs debit;
• Steps which would accelerate one-sided reductions as a result of not attaining volume
or POS placement objectives are unlikely to be successful and are counterproductive in
that issuers are not the primary vehicle for POS placement;
• Routing decisions create a conflict between the merchant and the card user. It is not
clear that they will assist with the attainment of the objectives;
• The quantitative goals were set too high and based on geographies with substantially
different cultures, populations, geographical characteristics and economic situations.
These need to be re-examined;
• Providing economic reductions to government parties is inconsistent with the economic
savings they get from acceptance and puts unneeded pressure on small businesses,
new acceptors and consumers to make up the revenue shortfall or the required cost
reduction; and
• Targets relate mostly to debit and cannot be attained without active participation of
government.
8 Payment Card Reform Framework (PCRF): A Policy Evaluation StudyPolicy Ideas № 48 WHAT ARE THE RESULTS TO DATE? The Appendix summarizes some of the quantitative measures and comparisons of initial results against the stated goals. It is referred to in the following pages. Overall, the implementation of PCRF has resulted in wider potential acceptance of card payments by merchants (as evidenced by a larger number of POS terminals) and the apparent acceptance of card payments for lower value transactions. However, by the end of 2017, the actual number of POS terminals and the total number of debit card transaction in the year have both fallen significantly behind the ambitious targets set in PCRF. Other measures of PCRF, such as requiring acquirers to charge merchants specified and separate MDR for each type of payment card and facilitating the identification of debit cards and international prepaid cards have been carried out according to schedule and their aims have been achieved. We look at these key results in more detail below. Setting of interchange fee ceilings is one of the key measures of PCRF. Figures 1 and 2 show the interchange fees of debit card transactions and credit card transactions, respectively, across merchant categories for a payment network in Malaysia. As can be seen from Figure 1, the interchange fee rates of debit card transactions have declined significantly across all merchant categories. Figure 2 shows that for credit card transactions, credit card effective interchange fee rates have declined for all but 6 merchant categories post PCRF. Prior to the reforms, operators of payment card networks established higher interchange fee rates for premium credit cards. An unintended result of this was to create incentives for issuers of credit cards to lower the income requirement for premium cards so they could receive higher interchange fees. This practice can be and has been addressed in other jurisdictions as a brand issue. Higher interchange fees for premium products is consistent with the increased value these products bring to both merchants and consumers especially in a digital economy. The imposition of ceilings does not allow for sufficient product differentiation and thus the rates are now the same (Figure 3). This lack of differentition also ignores the fact that investments made in payment innovation and new products vary in terms of enhanced security features and new payment forms. Allowing market forces and economics to dictate credit card interchange rates would also steer merchants’ preference towards the more cost-efficient debit card, and thus promote BNM’s policy objective of increasing debit card usage. From the standpoint of merchants, it is the merchant discount rate (MDR) which impacts them directly. Figure 4 below shows that average MDRs have declined for both debit and credit card transactions post reform. PCRF succeeded in unbundling MDRs for credit card and debit card transactions, as evidenced by the gap of about 0.4% in MDR by 2016. We note that the declines in average MDRs are much smaller than the decline in interchange fee rates (comparing to Figures 1 and 2), especially for international debit cards, which suggests that the pass throughs from interchange fee rates reduction to MDRs have not taken place. This is consistent with other geographies where reductions are not reflected in either merchant discounts or in product price. As a result, the consumer is likely to be paying more post regulation than before. Payment Card Reform Framework (PCRF): A Policy Evaluation Study 9
Panel 1 of Table 1 shows the PCRF’s targets for the number of cumulative POS terminals
deployed in Malaysia and the total volume of debit card transactions in Malaysia between
2015 and 2020. The targets for cumulative POS terminals set by BNM for 2015 to 2020 are
aggressive. The target of 800,000 POS terminals by 2020 translates to 25 terminals per 1000
inhabitants, which is in line with the figure in electronically advanced payment countries such
as Australia, UK, Sweden and Norway, which have about 22 to 33 POS terminals per 1000
inhabitants (Bank Negara Malaysia, 2011). However, these quantitative targets may have been
set too high as they are benchmarked against geographies with substantially different cultures,
populations, geographical characteristics and economic situations.

Panel 1 of Table 2 shows the actual outcomes of POS terminals between 2015 to 2017. Not
surprisingly, the number of POS terminals in Malaysia has fallen behind the targets set in PCRF in
the first 3 years after its introduction. The number of POS terminals increased from 233,248 in
2014 to 278,266 in 2015, which was quite an achievement, as it was a 19.3% growth (compared
to 2.7% to 3.1% growth per annum in 2013 and 2014), but the 2015 figure was still 0.6% below
the target for that year. By the end of 2017, the number of POS terminals was only 406,229,
which was 5.5% below the PCRF target for the year of 430,000.

The targets for debit card transaction volume, as can be seen from Figure 6, are relatively
modest through 2015 (with a target growth rate of 30%), considering that debit card transaction
volume had been growing at 37 to 39% per annum in 2013 and 2014. Nonetheless, the targets
for 2016 to 2020 are quite aggressive, with target growth rates of 47 to 80% per annum. The
target of 1 billion debit card transactions by 2020 translates to 30 transactions per capita (Bank
Negara Malaysia, 2011). The actual outcome of 90.1 million transactions in 2015 exceeded
the PCRF target of 89 million for that year. Nonetheless, the actual outcome of 107.5 million
transactions for 2016 was only 78% of the PCRF target of 137 million transactions for that
year. What is more worrying is that the actual number of debit card transactions in 2017 of
162.1 million is only 66% of the PCRF target of 246 million for that year. Moreover, while debit
card transaction volume has continued to increase post PCRF (Figure 7), the attribution is
rather contested. Specifically, the growth rates of debit card transaction volume continued to
decelerate in 2015 and 2016, following the general declining trend since 2010 (Figure 8), before
registering a significant increase of 51% in 2017 (though it was significantly lower than the 2017
target growth rate of debit card transaction volume of 80% in the PCRF).

While the PCRF has not set targets for debit card transaction values, it is interesting to note
that they have continued to grow post PCRF (Figure 9). Nonetheless, the PCRF does not seem
to have had a positive impact on total debit card transaction value, as the growth rates of
transaction value have been largely flat since 2011, with a dip in 2016 (Figure 10).

Average debit card transaction value (total value divided by number of transactions) has
declined in 2016 and 2017 (Figure 11), suggesting that debit cards are beginning to replace
cash as a payment option for lower-value transactions thus supporting the policy objective of
a cashless economy.

10   Payment Card Reform Framework (PCRF): A Policy Evaluation Study
Policy Ideas № 48

Certain business models may become untenable and costs are shifted to consumers who
can ill afford them because of the distortions created by the interchange fee regulations. For
example, in the United States, after the Federal Reserve Board imposed debit card interchange
fee standards for regulated banks it was observed that 50 percent of regulated issuers ended
their reward programmes in 2011; at the same time, average monthly fees of noninterest
checking accounts increased by 25% while the minimum balance for free-checking services
increased by 23% (Wang, 2012). In the case of Spain, Iranzo et al. (2012) report that the
government-enforced agreement to lower interchange fee rates for a five-year period has led
to an increase of annual card fees by 50% and reduced card rewards. They also highlighted that
there is no evidence that the reduction in interchange fees have benefited consumers in the
form lower prices for goods and services. In the case of Australia, Chan et al. (2012) report that
interchange fee cap introduced in Australia since 2003 have resulted in card issuers reducing
reward offerings, while Stillman et al. (2008) document a 40% increase in annual fees on a
“standard” rewards credit card.

Payment Card Reform Framework (PCRF): A Policy Evaluation Study                                                    11
CONCLUSION AND RECOMMENDATIONS
We note that PCRF has helped Malaysia to increase the number of POS terminals in Malaysia
substantially compared to the pre-reform period. However, if the current trajectory of slow
growth does not pick up, it is unlikely to achieve its ambitious targets in terms of both the
number of POS terminals and the volume of debit card transactions, as Malaysia has fallen
significantly behind these targets by 2017.This should be viewed as a consequence of interfering
with the economic rationale of the system. We discuss the various arguments and evidences
associated with whether BNM should regulate the interchange fee rates in Malaysia and conclude
that such regulations are counterproductive since interchange fee regulations have unintended
consequences while open market policies work better to achieve optimal results especially in
rapidly evolving markets such as electronic payments. When government imposes ceilings on
interchange fees below the appropriate cost of the service and without offsetting benefits, card
issuers must recoup the lost revenues by either increasing other revenues from account holders
or by decreasing costs. As Malaysia invests to transform into a digital and innovation economy,
some of these investments to make payments more secure and ubiquitous need to be factored
into the cost equation.

Furthermore, because it is virtually impossible to pass through all the reduction in interchange
fees to end customers, consumers end up paying more than what they were paying before the
regulation. These impacts affect both debit and credit accounts as well as other bank services. In
addition, interchange fee regulations may reduce innovations in the payment markets as issuers
have less resources for investment.

While large retailers generally gain directly from reductions of interchange fee rates (and hence
lower MDRs), small and medium size merchants generally do not since their pricing is generally
not based on a pass-through model. To the extent that consumers find their accounts more
expensive to use, they may switch back to higher cost payment methods such as cash and
cheques (Morris et al, 2017). Reduction of interchange fee rates can also adversely impact
small and medium enterprises (SMEs) through reduction of credit availability to SME’s as lower
interchange reduces issuers’ ability to take credit risk (Mastercard Australia, 2016). These are all
examples of the way in which independent steps are inconsistent with the basic economics of
the system and result in unintended consequences and conflict. The results to date suggest that
BNM should reconsider its approach to interchange regulation and take steps to bring it into
line with the underlying economics of the system by leaving the economics to market forces.

In order to more effectively reach the Bank’s objectives, we recommend that the Bank and the
Government reorient their approach to become less interventionist, appreciate the market
dynamics and to concentrate on steps that are effective and consistent with the economics of
the payment system. These would include:

     1. Recognition and consideration of the value delivered to each participant in the system
        for the costs they incur accounting for the benefits of e-commerce;
     2. Avoidance of further one-sided reductions in revenue to either the debit or credit
        products without counter measures to balance the impact;

12    Payment Card Reform Framework (PCRF): A Policy Evaluation Study
Policy Ideas № 48
3. Provision of tax incentives for use of a debit, credit or other e-payment vehicle;
4. Inclusion of all relevant costs in the computation of recommended interchange fees and
letting the market players decide;
5. Consideration of an average rate guideline (if any regulation) for credit and debit cards
a la Australia vs a cap to allow for increased product differentiation;
6. An education programme targeted at small and medium size merchants to illustrate the
value of card payment acceptance; and
7. Direct reimbursement of merchant discounts to new accepting merchants for a limited
period of time;
The Government should introduce policies that more directly encourage the use of e-payments
furthering the BNM policy objectives to achieve a cashless economy. An example might be
to provide tax incentives for e-payments, modelled on the Tax Incentives for Electronically
Traceable Payments (TIETP) policy in South Korea. South Korea introduced TIETP in 1999, to
provide tax incentives for individual consumers to use payment cards for transactions (Sung et
al., 2017). Under this policy, expenditure paid using payment cards are eligible for tax deductions
against taxable labour income up to certain thresholds.
Combined with merchant incentives, this type of adjustment gives clear incentives for both
consumers and merchants to choose card payments over cash and has been credited in turning
South Korea into the country with the highest ratio of card payments over GDP since 2005
(Sung et al., 2017). The motivation for South Korea to introduce TIETP was to reduce the
shadow economy through encouraging electronically traceable payments and to enable tax
authorities to follow the audit trails of the retail sectors. Credit card transactions skyrocketed
from 4.9% of GDP in 1999 to 34.3% of GDP in 2002 following the implementation of TIETP
in South Korea (Sung et al., 2017). While tax incentives come with fiscal costs, TIETP has been
credited for increasing personal income tax revenue in South Korea by 4.2% with an estimated
net gain of USD1.3 billion (Sung et al., 2017).
Another policy option would be to directly reimburse merchants for the merchant discount
rates. India has recently implemented a policy to reimburse merchants the merchant discount
rate on digital payments via debit cards for low value transactions of up to Rs2000 (about
RM120), starting from 1st January 2018 (Times of India, 2017).
Finally, if BNM’s goal is to promote debit, then it should leave credit interchange unregulated
with no caps, since merchants make routing decisions based on cost effectiveness and the
customers not deriving sufficient value will automatically switch to the debit cards.
Payment Card Reform Framework (PCRF): A Policy Evaluation Study 13APPENDIX DISCUSSION OF IMPACTS AND RESULTS Setting of interchange fee ceilings is one of the key measures of the PCRF. Figures 1 and 2 show the interchange fees of debit card transactions and credit card transactions, respectively, across merchant categories for a payment network in Malaysia. As can be seen from Figure 1, the interchange fee rates of debit card transactions have declined significantly as expected across all merchant categories to below 0.2% after reform, compared to interchange fee rates of above 1% for most merchant categories before reform. Figure 1: Interchange Fee Rates for Debit Card Transaction Across Merchant Categories for a Payment Network in Malaysia Figure 2 shows that for credit card transactions, credit card effective interchange fee rates have declined for all but 6 merchant categories post reform. 14 Payment Card Reform Framework (PCRF): A Policy Evaluation Study
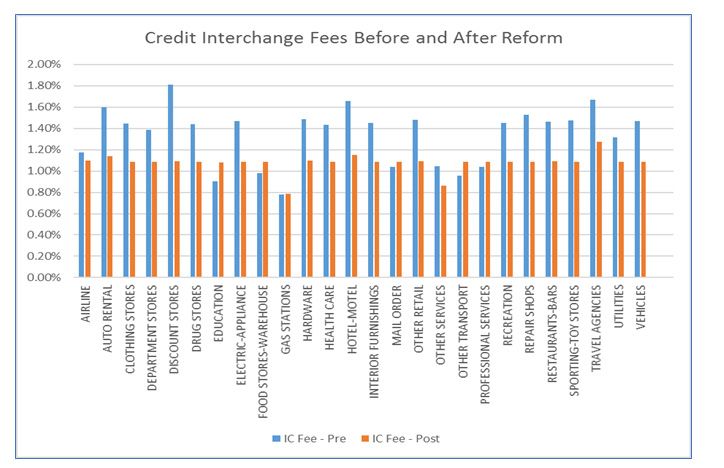
Policy Ideas № 48

Figure 2: Interchange Fee Rates for Credit Card Transaction Across Merchant
Categories for a Payment Network in Malaysia

Prior to the reform, operators of payment card network established higher interchange fee
rates for premium credit cards. An unintended result of this was to create incentives for issuers
of credit cards to lower the income requirement for premium cards so they could receive
higher interchange fees. This practice can be and has been addressed in other jurisdictions as
a brand issue. Higher interchange fees for premium products is consistent with the increased
value these products bring to both merchants and consumers. The imposition of ceilings does
not allow for sufficient product differentiation and thus the rates are now the same (Figure 3).

Figure 3: Interchange Fee Rates for Credit Card Transaction Across Card Types in a
Payment Network in Malaysia

Payment Card Reform Framework (PCRF): A Policy Evaluation Study                                                   15
From the standpoint of merchants, what affect them directly is the merchant discount rate
(MDR). Figure 4 below shows that average MDRs have declined for both debit and credit card
transaction post reform. The decline of average MDR is especially significant for international
debit card transaction, which fell from 1.4% in 2014 to slightly over 1% in 2016. On the other
hand, the average MDR of credit card transactions only fell slightly from around 1.5% in 2014
to slightly below 1.4% in 2016 reflecting the slight decrease in the rate. PCRF succeeded in
unbundling MDRs for credit card and debit card transactions, as evidenced by the gap of about
0.4% in MDR by 2016., We note that the declines in average MDRs are much smaller than the
decline in interchange fee rates (comparing to Figures 1 and 2), especially for international debit
cards, which suggests that the pass throughs from interchange fee rates reductions to MDRs
have not taken place. This is consistent with other geographies where reductions are not
reflected in either merchant discounts or in product price. As a result, the consumer is likely to
be paying more post regulation than before.

Figure 4: Average MDR by Type of Payment Card Transactions

Source: Figure 6.9 of Bank Negara Malaysia (2017a).

16    Payment Card Reform Framework (PCRF): A Policy Evaluation Study
Policy Ideas № 48

The primary industry indicators are targets for the number of cumulative POS terminals
deployed in Malaysia and the total volume of debit card transactions for each year between
2015 and 2020. They are summarized in Table 1 below:

Table 1: Industry Indicators Set Up in PCRF
 Industry Indicators              2015               2016          2017          2018              2019            2020
 1) Cumulative POS                280,000            330,000       430,000       560,000           690,000         800,00
 terminals comprising:            252,000            264,000       301,000       392,000           483,000         560,000
 a. Contact terminals             28,000             66,000        129,000       168,000           207,000         240,000
 b. Contactless terminals
 2) Debit card                    89                 137           246           433               681             1,000
 transactions (million)
Source: Bank Negara Malaysia (2014b)

The targets for cumulative POS terminals set by BNM for 2015 to 2020 are quite aggressive. Specifically, as
can be seen from Figure 5, while the actual numbers of Cumulative POS Terminals had been flat between
2012-2014, with only 2.7% to 3.1% growth per annum, BNM’s targeted the figure to grow to 280,000 in
2015, which is 20% growth relative to the 2014 figure of 233,248. In subsequent years, the target growth
rates for Cumulative POS Terminals are between 15.9% to 30.3% per annum. The target of 800,000
POS terminals by 2020 translates to 25 terminals per 1,000 inhabitants, which is in line with the figure in
electronically advanced payment countries such as Australia, UK, Sweden and Norway, which have about
22 to 33 POS terminals per 1000 inhabitants (Bank Negara Malaysia, 2011). However, these quantitative
targets may have been set too high as they are benchmarked against geographies with substantially
different cultures, populations, geographical characteristics and economic situations.

Figure 5: Cumulative POS Terminals: Actual Figures for 2012-2017 vs BNM’s Targets in PCRF

           900,000
           800,000
           700,000
           600,000
           500,000
           400,000
           300,000
           200,000
           100,000
                   0
                    2011      2012      2013      2014      2015   2016   2017     2018     2019     2020     2021

                                                 2012-2017 Actual            BNM Target

Source: Data for 2013-2017 actual figures are from Bank Negara Malaysia (2018), data for 2012 actual figure is from Bank
Negara Malaysia (2017a), data for BNM’s targets are from Bank Negara Malaysia (2014b)

Payment Card Reform Framework (PCRF): A Policy Evaluation Study                                                                     17
Panel 1of Table 2 shows the actual outcomes of POS terminals between 2015 to 2017. The
number of POS terminals in Malaysia has fallen behind the targets set in PCRF in the first
3 years after its introduction. The targets for the number of POS terminals are 280,000 for
2015, 330,000 for 2016 and 430,000 for 2017, but the actual outcomes for these years are
only 278,266 for 2015, 326,507 for 2016 and 406,229 for 2017. However, considering that the
numbers of POS terminals had only been growing at 2.7% to 3.1% per annum in 2013 and
2014, the increase of POS terminals from 233,248 in 2014 to 278,266 in 2015 was quite an
achievement, as it was a 19.3% growth, even though the 2015 figure was still 0.6% below the
target for that year. Similarly, for 2016, the actual number of 326,507 terminals is only 1% below
the target for that year. Nonetheless, the number of POS terminals by the end of 2017 was only
406,229, which was 5.5% below the PCRF target for the year of 430,000.
Table 2: Targets and Actual Outcomes of Industrial Indicators
2015 2016 2017
1) Cumulative POS Terminals
Targets in PCRF 280,000 330,000 430,000
Actual Outcome 278,266 326,507 406,229
2) Debit card transactions (million)
Targets in PCRF 89.0 137.0 246.0
Actual Outcome 90.1 107.5 162.1
Source: Data for actual outcomes are from Bank Negara Malaysia (2017c), data for PCRF targets are from Bank Negara Malaysia (2014b).
The targets on debit card transaction volume, as can be seen from Figure 6 below are relatively
modest through 2015 (with a target growth rate of 30%), considering that debit card transaction
volume had been growing at 37% to 39% per annum in 2013 and 2014. Nonetheless, the
targets for 2016 to 2020 are quite aggressive, with target growth rates of 47% to 80% per
annum. The target of 1 billion debit card transactions by 2020 translates to 30 transactions per
capita (Bank Negara Malaysia, 2011). The actual outcome of 90.1 million transactions in 2015
exceeded the PCRF target of 89 million for that year. Nonetheless, the actual outcome of 107.5
million transactions for 2016 was only 78% of the PCRF target of 137 million transactions for
that year. What is more worrying is that the actual number of debit card transactions in 2017 of
162.1 million is only 66% of the PCRF target of 246 million for that year. Moreover, while debit
card transaction volume has continued to increase post PCRF (Figure 7), it is not clear whether
the increase in volume can be attributed to PCRF. Specifically, the growth rates of debit card
transaction volume continued to decelerate in 2015 and 2016, following the general declining
trend since 2010 (Figure 8), before registering a significant increase of 51% in 2017 (though it
was significantly lower than the 2017 target growth rate of debit card transaction volume of
80% in PCRF).
18 Payment Card Reform Framework (PCRF): A Policy Evaluation StudyPolicy Ideas № 48 Figure 6: Debit Card Transactions (million): Actual Figures for 2012-2017 vs BNM’s Target Source: Data for 2012-2017 actual figures are from Bank Negara Malaysia (2017a), data for BNM’s targets are from Bank Negara Malaysia (2014b). Figure 7: Debit Card Transaction Volume Data Source: Bank Negara Malaysia (2018) Payment Card Reform Framework (PCRF): A Policy Evaluation Study 19
Figure 8: Growth Rates of Debit Card Transaction Volume

Data Source: Author’s calculation based on data on volume

While PCRF has not set targets for debit card transaction values, it is interesting to note that
they have continued to grow post PCRF (Figure 9). Nonetheless, PCRF does not seem to have
positive impact on total debit card transaction value, as the growth rates of transaction value
have been largely flat since 2011, with a dip in 2016 (Figure 10).

Figure 9: Debit Card Transaction Values

Data Source: Bank Negara Malaysia (2018)

20    Payment Card Reform Framework (PCRF): A Policy Evaluation Study
Policy Ideas № 48

Figure 10: Growth Rates of Debit Card Transaction Value

Data Source: Author’s calculation based on data on value

Average debit card transaction value (total value divided by number of transactions) has
declined in 2016 and 2017 (Figure 11), suggesting that debit cards are beginning to replace cash
as a payment option for lower-value transactions.

Figure 11: Average Debit Card Transaction Values

Data Source: Author’s calculation based on transaction volume and value.

Payment Card Reform Framework (PCRF): A Policy Evaluation Study                                                  21
Similarly, while PCRF has not set targets for credit card transactions, credit card transaction
volume and values have both continued to grow post PCRF (Figures 12 and 13). For credit card
transaction volume, its growth rates have picked up post PCRF (Figure 14), while for credit card
transaction value, the growth rates remain largely flat (Figure 15).

Figure 12: Credit Card Transaction Volume

Data Source: Bank Negara Malaysia (2018)

Figure 13: Credit Card Transaction Values

Data Source: Bank Negara Malaysia (2018)

22    Payment Card Reform Framework (PCRF): A Policy Evaluation Study
Policy Ideas № 48

Figure 14: Growth Rates of Credit Card Transaction Volume

Data Source: Author’s calculation based on data on volume

Figure 15: Growth Rates of Credit Card Transaction Value

Data Source: Author’s calculation based on data on value

Payment Card Reform Framework (PCRF): A Policy Evaluation Study                 23
Average credit card transaction values have also declined slightly in 2016, reversing a general
upward trend, before increasing slightly in 2017, suggesting that credit cards have also been
used to replace cash and checks in lower value transactions post PCRF (Figure 16). Along
with the larger number of POS terminals, this suggests that there is now wider acceptance
of card payments by merchants and cards are now accepted for lower value transactions. It is
also interesting to note that the ratio of credit card transactions to debit card transactions has
continued to decline post reform, implying a larger fraction of payments are carried out using
the more cost-efficient debit card transactions (Figure 17). The effect of allowing market forces
to determine credit card interchange rates would also steer merchants’ preference towards
the more cost-efficient debit card, and thus promote BNM’s policy objective of increasing debit
card usage.

Figure 16: Average Credit Card Transaction Values

Data Source: Author’s calculation based on transaction volume and value.

Figure 17: Credit Card to Debit Card Transaction Ratio

Data Source: Author’s calculation based on credit card and debit card transaction volume

24    Payment Card Reform Framework (PCRF): A Policy Evaluation Study
Policy Ideas № 48

References
Bank Negara Malaysia. 2011. Financial Sector Blueprint 2011-2020. [ONLINE] Available at: http://www.
bnm.gov.my/files/publication/fsbp/en/BNM_FSBP_FULL_en.pdf. [Accessed 13 February 2018].

Bank Negara Malaysia. 2014a. Payment Card Reform Framework: Concept Paper. [ONLINE] Available at:
http://www.bnm.gov.my/guidelines_old/50_others/CP_Payment_Card_Reform_Framework.pdf. [Ac-
cessed 13 February 2018].

Bank Negara Malaysia. 2014b. Payment Card Reform Framework. [ONLINE] Available at: http://www.bnm.
gov.my/guidelines/50_others/Payment_Card_Reform_Framework.pdf. [Accessed 13 February 2018].

Bank Negara Malaysia. 2017a. The Financial Stability and Payment Systems Report 2016. [ONLINE] Avail-
able at: http://www.bnm.gov.my/files/publication/fsps/en/2016/fs2016_book.pdf. [Accessed 13 February
2018].

Bank Negara Malaysia, 2017b. Merger of MyClear and MEPS – Strengthening Malaysia’s Payments Infra-
structure to Accelerate Migration to E-Payments. [ONLINE] Available at http://www.bnm.gov.my/index.
php?ch=en_press&pg=en_press&ac=4440&tpt=9ch252&lang=en.

Bank Negara Malaysia. 2018. Payment Statistics. [ONLINE] Available at: http://www.bnm.gov.my/index.
php?ch=ps&pg=ps_stats. [Accessed 13 February 2018].

Borneo Post Online, 2017. Action Required to Catalyse Debit Card Usage in Malaysia. [ONLINE]
Available at http://www.theborneopost.com/2017/07/20/action-required-to-catalyse-debit-card-usage-in-
malaysia/.

Carbo-Valverde, S., Chakkravorti, S., Rodriguez-Fernandez, F, 2016. The Role of Interchange Fees in
Two-sided Markets: An Empirical Investigation on Payment Cards. Review of Economics and Statistics
98(2), 367-381.

Chan, I., Chong, S., Mitchell, S., 2012. The Personal Credit Card Market in Australia: Pricing over the Past
Decade. Reserve Bank of Australia Bulletin. [ONLINE] Available at: https://www.rba.gov.au/publications/
bulletin/2012/mar/7.html. [Accessed 14th February, 2018]

Evans, D.S., 2011a. Interchange Fees – The Economics and Regulation of What Merchants Pay for Cards.
Competition Policy International.

Evans, D.S., 2011b. Payments Innovation and Interchange Fee Regulation: How Inverting the Mer-
chant-Pays Business Model Would Affect the Extent and Direction of Innovation. In Evans, D.S. (2011a).

Evans, D.S., and Schmalensee, R., 2011. The Economics of Interchange Fees and Their Regulation: An
Overview. In Evans, D.S. (2011a).

Hayashi, F. and Maniff J.L., 2015. Public Authority Involvement in Payment Card Markets: Various Coun-
tries. August 2015 Update.

Payment Card Reform Framework (PCRF): A Policy Evaluation Study                                                     25
Iranzo, J., Fernanedez, P., Matias, G. and Delgado, M., 2012. The Effects of the Mandatory Decrease of Interchange
Fees in Spain. [ONLINE] Available at: https://repositorio.uam.es/bitstream/handle/10486/10839/54105_in-
forme_matiasclavero.pdf?sequence=1 [Accessed 14th February 2018]

MasterCard Australia, 2016. Submission to the RBA Review of Card Payments Regulation.

Morris, J., Manne, G., Lee, I., and Zywicki, T., 2017. Punishing Rewards: How Clamping Down on Credit Card
Interchange Fees Can Hurt the Middle Class. [ONLINE] Available at: https://macdonaldlaurier.ca/files/pdf/
MLI-PaymentCardRegulationPaper10-17web.pdf. [Accessed 14th February 2018]

Oliver, R. and Weiner, S. E., 2009. The Role of Central Banks in Retail Payments: The Central Bank as Operator.

Peirez, J., 2009. The Role of Central Banks in Retail Payments: The Central Bank as Operator. Commentary.

Stillman, R., Bishop, W., Malcom, K. and Hildebrandt, N., 2008. Regulatory Intervention in the Payment Card
Industry by the Reserve Bank of Australia: Analysis of the Evidence. CRA International.

Sung, M.J., Awasthi, R. and Lee, H. C., 2017. Can Tax Incentives for Electronic Payments Reduce the Shadow
Economy? Korea’s Attempt to Reduce Underreporting in Retail Businesses. World Bank Policy Research Work-
ing Paper 7936.

Times of India, 2017. Merchant Discount Rate on E-transactions up to Rs 2000 to be Borne by Govt. [ON-
LINE] Available at: https://timesofindia.indiatimes.com/business/india-business/merchant-discount-rate-on-e-
transactions-up-to-rs-2000-to-be-borne-by-govt/articleshow/62084354.cms

United States Government Accountability Office, 2009. Rising Interchange Fees Have Increased Costs for Mer-
chants, but Options for Reducing Fees Pose Challenges.

Wang, Zhu, 2012. Debit Card Interchange Fee Regulation: Some Assessments and Considerations. Economic
Quarterly 98(3), 159-183.

Zandi, M., Koropeckj, S., Singh, V. and Matsiras, P. 2016. The Impact of Electronic Payments on Economic Growth.
[ONLINE] Available at: https://usa.visa.com/dam/VCOM/download/visa-everywhere/global-impact/im-
pact-of-electronic-payments-on-economic-growth.pdf. [Accessed 13 February 2018].

26   Payment Card Reform Framework (PCRF): A Policy Evaluation Study
Policy Ideas № 48

IDEAS is inspired by the vision of Tunku Abdul Rahman Putra al-Haj, the first Prime Minister of Malaysia. As
a cross-partisan think tank, we work across the political spectrum to improve the level of understanding and
acceptance of public policies based on the principles of rule of law, limited government, free markets and free
individuals. On 2 September 2016, IDEAS was ranked as the 17th think tank to watch globally in a survey of more
than 6,800 think tanks in 143 countries by the University of Pennsylvania’s 2015 Global Go To Think Tank Index
                                                    Report.

        Please support us by making a donation. You can make a contribution by cheque payable to
“IDEAS Policy Research Berhad” or by transfer to our account CIMB 8008852042. We can only survive with
                                              your support.

                                                  © 2018 IDEAS. All rights reserved.

                                             IDEAS Policy Research Berhad
                                                 The Lower Penthouse
                                  Wisma Hang Sam, 1, Jalan Hang Lekir 50000 Kuala Lumpur

                                                             www.ideas.org.my
                                                            Reg №: 1219187-V

Payment Card Reform Framework (PCRF): A Policy Evaluation Study                                                27
Selection of IDEAS’ Publications (2016 - 2017) Policy Ideas Policy Paper No. 44: Illicit Trade in Malaysia: Causes & Consequences by Adli Amirullah, Amirah Fazira and Ali Salman (October 2017) Policy Paper No. 43: Reining in the IGP’s Power: Decentralisation as an option by Nicholas Ideas (September 2017) Will Our Public Universities Have Financial Autonomy? By Wan Saiful Wan Jan Policy Ideas No. 42 (May 2017) History and Epistemology of Universities by Munif Zarirruddin Fikri Nordin, Policy Ideas No. 41 (May 2017) The History of University Autonomy in Malaysiam by Dr. Chang-Da Wan, Policy Ideas No. 40 (May 2017) Autonomy and Accountability in Higher Education: Lessons from Ghana and Mexico, by Dr. Sean Matthews, Policy Ideas No. 39 (May 2017) Malaysia’s Tax System Friend or Foe to Prosperity? By Dan Mitchell, Policy Ideas No. 38 (April 2017) Upgrading Democracy: ‘Soft Laws’ and The Ombudsman by Roy Lee, Policy Ideas No. 37 (February 2017) A critical look into the Whistleblower Protection Act 2010 by Christopher Leong, Policy Ideas No. 36 (February 2017) Innovations in Vector-Borne Diseases by Philip Stevens, Policy Ideas No. 35 (November 2016) Separating the Attorney-General and Public Prosecutor: Enhancing Rule of Law in Malaysia by Aira Nur Ariana Azhari and Lim Wei Jiet, Policy Ideas No. 34 (December 2016) Strengthening the Royal Malaysia Police by Enhancing Accountability by Nicholas Chan, Policy Ideas No. 33 (September 2016) The Principles of Political Finance Regulations by Dr. Stefan Melnik, Policy Ideas No. 29 (May 2016) Financial Burden of Living with Autism by Shanuja Chandran, Policy Ideas No. 28 (June 2016) Brief Ideas Ownership and Control of Airlines in Southeast Asia: Prospects for an ASEAN Community Carrier Brief by Adli Amirullah IDEAS No. 8 (December 2017) Chinese Investments in Malaysia: Question on the Future of Liberal Democracy and Economic Freedom by Wan Saiful Brief Ideas No. 7 (September 2017) Advancing the ASEAN Single Aviation Market by Adli Amirullah, Brief Ideas No. 6 (July 2017) Governing State-Owned Enterprises: Lessons learned from 1MDB by Rama Ramanathan, Brief Ideas No. 5 (August 2016) Institute for Democracy and Economic Affairs (IDEAS) The Lower Penthouse. Wisma Hang Sam, 1, Jalan Hang Lekir 50000 Kuala Lumpur Website: ideas.org.my Tel: +603 2070 8881 / 8882 Fax: +603 2070 8883
You can also read