Debt investor update - first quarter 2021 - Danske Bank

Page created by Willie Jones
 
CONTINUE READING
Debt investor update - first quarter 2021 - Danske Bank
Debt investor update – first quarter 2021
Debt investor update - first quarter 2021 - Danske Bank
Agenda

01.      Financial update                    2

02.      Capital and funding                 10

03.      Covered bond universe and ratings   16

04.      Appendix                            19
Debt investor update - first quarter 2021 - Danske Bank
Debt investor update – Q1 2021

We are a Nordic universal bank with strong regional roots

  Norway (AAA)                                                                                                                                                                       Finland (AA+)
  Challenger position                                                                                                                                                                3rd largest
  Market share: 7%                                                                                                                                                                   Market share: 10%
  Share of Group lending: 10%                                                                                                                                                        Share of Group lending: 7%

  GDP growth 2021E: 3.7%                                                                                                                                                             GDP growth 2021E: 2.2%
  Unemployment 2021E: 3.3%                                                                                                                                                           Unemployment 2021E: 3.3%
  Leading central bank rate: 0.00%                                                                                                                                                   Leading central bank rate: -0.50%

  Denmark (AAA)                                                                                                                                                                      Sweden (AAA)
  Market leader                                                                                                                                                                      Challenger position
  Market share: 25%                                                                                                                                                                  Market share: 5%
  Share of Group lending: 39%                                                                                                                                                        Share of Group lending: 10%

  GDP growth 2021E: 3.0%                                                                                                                                                             GDP growth 2021E: 3.4%
  Unemployment 2021E: 4.6%                                                                                                                                                           Unemployment 2021E: 8.5%
  Leading central bank rate: -0.60%                                                                                                                                                  Leading central bank rate: 0.00%

                                                                                                                                                                                      Northern Ireland (AA)
                                                                                                                                                                                     Market leader
                                                                                                                                                                                     Market share Personal: 19%, Business: 27%
                                                                                                                                                                                     Share of Group lending: 3%

Note: Data as per end-Q1 2021 unless otherwise stated. Share of Group lending is before loan impairment charges and excludes Corporates & Institutions (14%), Global Commercial Real Estate (14%) and Nordic Asset Finance (3%)   2
Debt investor update - first quarter 2021 - Danske Bank
Debt investor update – Q1 2021

Summary – Good customer activity drives total income up; significant decline in
impairment charges and progress towards cost-income ratio ambition
                                                                                                                               Positive impact from retail deposit
 Continued lending growth driven by                                     Diversified business model; capital
                                                                                                                               repricing in Denmark; margin pressure
 Nordic franchise, lockdown in Denmark                                  markets platform delivering in current
                                                                                                                               on lending. Further deposit initiatives
 resulting in low credit demand                                         environment
                                                                                                                               launched in April

                                                                        Steady progress with cost initiatives;
 Credit quality remained strong; low                                                                                           We confirm our net profit guidance for
                                                                        costs further down in line with
 impairments in Q1 and solid buffers                                                                                           the year as a whole
                                                                        expectations

 Profit development Q1-21 vs Q1-20 (DKK m)                                                        Lending and deposit growth               Cost-income ratio*

                                                                                       4,034          Lending            Deposits
                                                                           3,754                                                                 69       69
                                                                                                                          +23%
                                                                                                        +3%                                                       58
                                                               112
                                                   392
                                                                                                            1,828               1,381

                                        1,296                                                      1,782              1,126
                        110
    -1,409
   Q1-20 PBT             NII            Fee/     Insurnace   Expenses   Impairments   Q1-21 PBT
                                      trading/    business
                                        other                                                      Q1-20 Q1-21        Q1-20 Q1-21               Q1-20    Q4-20   Q1-21

*Excl. impairment charges on intangible assets                                                                                                                           3
Debt investor update - first quarter 2021 - Danske Bank
Debt investor update – Q1 2021

Solid trading and fee performance combined with more normalised impairment levels
resulting in net profit of DKK 3,139 m
 Income statement and key figures (DKK m)                                                                          Key points, Q1-21 vs Q1-20

                                                            Q1-21         Q1-20    Index     Q4-20         Index   • Total income up 17%, driven by the rebound in trading income
Net interest income                                         5,450         5,560     98       5,447          100      and net income from insurance business, off-set by slightly
Net fee income                                              3,402         3,240    105       3,644           93      lower NII
Net trading income                                          1,266           141    898       1,044          121    • Cost-income ratio closer to longterm ambition; down 11pp
Net income from insurance business                            491            99    496         350          140      due to a combination of higher total income and results from
Other income                                                  195           186    105          97          201      cost management initiatives
Total income                                               10,805         9,227    117      10,582          102    • Profit before tax further up due to a significant decrease in
Expenses                                                    6,273         6,385     98       7,316           86      impairment levels of 88%, in line with expectations
Impairment charges on goodwill                                  -                    -           -            -
Impairments charges, other intangible assets                    -                    -         379            -
Profit before loan impairment charges                       4,531          2,842   159       2,886          157
Loan impairment charges                                       497          4,251    12         713           70
                                                                                                                   Key points, Q1-21 vs. Q4-20
Profit before tax, core                                     4,034         -1,409     -       2,173          186
Profit before tax, Non-core                                    20           -254     -        -113            -
                                                                                                                   • Total income stable from Q4, despite record-high performance
Profit before tax                                           4,054         -1,663     -       2,059          197
                                                                                                                     fee bookings in Q4 of 628 m
Tax                                                           914           -374     -         609          150
Net profit                                                  3,139         -1,289     -       1,450          216
                                                                                                                   • Cost-income ratio further down from Q4, due mainly to run-off
  RoE (%)                       C/I *(%)                CET1 (%)           REA (DKK bn)    EPS                       of transformation cost and costs related to AML/Estonia

  Q1-21         7.5             Q1-21            58.1   Q1-21      18.1    Q1-21   798     Q1-21     3.5           • Impairments further down from the level in Q4, driven
  Q4-20         3.4             Q4-20            69.1   Q4-20      18.3    Q4-20   784     Q4-20     1.6             primarily by positive trend in LC&I oil-related exposure
  Q1-20         -3.8            Q1-20            69.2   Q3-20      18.2    Q3-20   766     Q1-20     -1.7

*Excl. impairment charges on intangible assets
                                                                                                                                                                                     4
Debt investor update - first quarter 2021 - Danske Bank
Debt investor update – Q1 2021

NII: NII slightly down as increase in deposits and repricing partly mitigates negative
effects from lending; Q1 stable due to deposit repricing effect, days and FX
 Net interest income, Q1-21/Q1-20 (DKKm)                                                             Net interest income, Q1-21/Q4-20 (DKKm)
      5,560                                                                                                                    5,553
                 -58                                                                                                                    -12                           25
                                                                                                                                                 -27        19                  -77
                                                                                 -29        5,450
                                                  -134               56                                               106                                                                 36
                           -141        153
                                                                                                                                                                                                         -67
                                                            43
                                                                                                            5,447                                                                                                5,450

      Q1 20    Lending    Lending     Deposit    Deposit   Other   FX effect     Day      Q1 21             Q4 20   One-off    Q4 20 Lending    Lending   Deposit   Deposit     Other   FX effect        Days   Q1 21
               volume     margin      volume     margin                                                    Reported Q4-20     adjusted volume   margin    volume    margin

 Lending volume; Q1-21/Q4-20 (DKK bn)                                                                Margin development (bps)
                                                                                                     115
      1,838
                                                             9         of which General Banking      110                                                                                        113        PB&C lending
                                                                                                                              106                                       112
                  -9         8                                                                       105   109                                    103                   102                                PB&C deposit
                                        -13                                                  1,828                                                106                                           101
                                                   10                                                                                                                                                      LC&I lending
                                                                                   1                                          103
                                                            -21        5                                                                                                                                   LC&I deposit
                                                                                                      35                       38
                                                                                                      30                                          33
                                                            -12                                       25   29                  29                 29

                                                                                                      20                                                                   23                       23
                                                                                                                                                                           18                       19
                                                                                                      5
      Q4 20   Personal DK Personal    Business    Asset    LC&I        NI        Other     Q1 21      Q120                    Q220               Q320                  Q420                  Q121
                           Nordic    Customers   Finance

                                                                                                                                                                                                                          5
Debt investor update - first quarter 2021 - Danske Bank
Debt investor update – Q1 2021

Fee: Increase in fee driven by capital markets performance and AuM; Q1 impact from
mortgage-related fees
 Net fee income, Q1-21/Q1-20 (DKKm)                                                        Net fee income, Q1-21/Q4-20 (DKKm)
                                                        Q1 20     Q1 21                                                                         Q4 20         Q1 21
                                                                             3,402
                                                                                                                                                                      3,645
                                                                     3,240           +5%
                                                                                                                                                                                      -7%
                                                                                                                                                                              3,402

                                                                                                 -16%

                                                                                             1,590

         +3%
                                                                                                     1,333

     1,293 1,333
                                                                                                                     -9%            +15%
                            -4%             -5%
                                                                                                                 838
                                                                                                                        764             766      -3%
                                         808           +58%
                        799    764             766                                                                                664
                                                                                                                                               552      538
                                                            538

                                                      341

    Investment fees    Money transfer,    Lending &    Capital            Total              Investment fees    Money transfer,    Lending &    Capital                  Total
                         account fee,    guarantees    Markets                                                    account fee,    guarantees    Markets
                      cash management                                                                          cash management
                        and other fees                                                                           and other fees

                                                                                                                                                                                       6
Debt investor update - first quarter 2021 - Danske Bank
Debt investor update – Q1 2021

Trading: Rebound in trading income from difficult Q1 last year; strong underlying
trading income Q/Q driven by customer activity and favourable market conditions
 Net trading income, Q1-21/Q1-20 (DKKm)                                                                                                Highlights

                                 LC&I ex. xVA         xVA     P&BC        NI         Group Functions

                                                                                                                                       Trading income improved significantly from an extraordinarily
                                                                                                                                       turbulent Q1-20
  Q1 20          -344            190            162     52   82     141

                                                                                                                                       Trading income in Q1 positively affected by one-off of DKK 227
                                                                                                                                       m from sale of Visa shares booked in Group Functions (Q4: one
  Q4 20                                          607                           143        153    6     135    1,044
                                                                                                                                       off of DKK +106 m)

 Q1 21                     -20                                    1,008                                      94       150   34 1,266   Solid trading income at LC&I driven by seasonally high customer
                                                                                                                                       activity in Q1, positive value adjustments and benign market
                                                                                                                                       conditions

                                                                                                                                                                                                        7
Debt investor update – Q1 2021

Expenses: Downwards trajectory according to plan, including lower costs for
AML/Estonia and transformation
 Expenses, Q1-21/Q1-20 (DKKm)                                                          Highlights

                                 51

                   272
                                           215                                         Expenses adjusted for one-offs down 6% vs Q1-20 and 18% vs Q4-20
       6,385
                                                     77          49     90     6,273

                                                                                       One-off of DKK 150 m related to provision for upcoming changes in the VAT
                                                                                       setup following the ECJ ruling, and booking of DKK 122 m for Group-wide
                                                                                       initiative to enable employees to work more effective, from home

       Q1-20     One-offs     Transfor-    AML    Staff cost   Bonus   Other   Q1-21
                               mation             ex. bonus

                                                                                       Transformation costs significantly down from Q4-20, when most of 2020’s
 Expenses, Q1-21/Q4-20 (DKKm)                                                          transformation costs were booked, including provision for ’21

     7,316      272
                              721

                                          365
                                                                                       AML and Estonia case costs trending down according to plan
                                                    17          33
                                                                       245     6,273

                                                                                       Underlying staff cost down as the layoff round at the end 2020 gathered
                                                                                       effect.
     Q4-20     One-offs     Transfor-     AML    Staff cost    Bonus   Other
                             mation              ex. Bonus
                                                                               Q1-21   FTEs down 398 from Q4-20 and 604 from Q3-20

                                                                                                                                                                   8
Debt investor update – Q1 2021

Impairments: Strong credit quality and low level of actual credit detoriation; individual
exposures affected by pandemic accounted for most of the impairments in Q1
 Impairment charges by category (DKK bn)                                                   Loan loss ratio by business unit

        Credit quality deterioration: oil & gas           Post-model adjustments
                                                                                                        3.4
        Credit quality deterioration: outside oil & gas   Macroeconomic adjustments

          4.3
                                                                                                                    1.63

                                                                                                                                                 1.01
          1.4                                                                                           0.45                       0.54
                                                                                                                                                 -0.02          0.09
                                                                                                                    -0.07         0.16
                                                                                                                                                                    0.11

                                                                                                    Q120          Q220           Q320            Q420         Q121
          0.7
                                                  1.0                                                                          P&BC       LC&I
          0.5
                             1.1                  0.5
                                                  0.2          0.8                         Highlights
                             1.0                               0.5
          1.7                                                  0.0
                                                  1.3                          0.5         • P&BC accounted for the main part of impairment charges due to individual
                             0.4                               0.8           0.1             credit exposures affected by the corona crisis, for instance in the hotel,
                                                                                 0.3 0.1
                             0.2                                             0.0             restaurants, and leisure segment. New charges were in line with
                            -0.5                              -0.5                           expectations, and with limited spillover to other sectors
                                                  -1.0
                                                                                           • Impairments decreased notably at LC&I owing to lower impairment charges
                                                                                             against oil-related exposure; limited charges outside this sector
       Q1 2020           Q2 2020             Q3 2020        Q4 2020         Q1 2021

                                                                                                                                                                           9
Debt investor update – Q1 2021

Capital: Strong capital base; CET1 capital ratio of 18.1% (buffer of 4.9%)

 Capital ratios, under Basel III/CRR (%)                                                                                               Estimated capital buffer structure (%)

                                                                                              Tier 2                                          Countercyclical capital buffer
                                                    23.4                                      Hybrid T1/AT1
                                23.0                                    23.2                                                                  Capital conservation buffer
            22.7                                                                              Pillar II component (total 4.5%)
                                                                                                                                              Systemic risk buffer                                     13.2
             2.3                 2.4                 3.1                 3.1                  CET1
                                                                                                                                              CET1 Pillar II req.                                       0.1
                                                                                                                                                                                                        2.5
                                 2.2                                                                                                          CET1 min req.
             3.1                                     2.2                 2.2                                   18.1
                                                                                                                                              CET1 target (above 16%)                                   3.0
                                                                                              2.8                                             CET1 Q1 2021 (18.1%)
                                                                                                                2.0
                                                                                                                                                                                                        3.1
                                                                                              2.1               1.5                     The trigger point for MDA restrictions
                                                                                                                                        will be at the regulatory CET1                                  4.5
                                                                                                                                        requirement (currently at 13.2%)
                                                                                                                                                                                                      2021E
                                18.3                18.1                17.9
            17.3
                                                                                                                                       Highlights
                                                                                            13.2                                       • CET1 capital ratio has decreased from 18.3% to 18.1% since Q4-20, due primarily to
                                                                                                               10.1                      an increase in REA excl. FX of 0.3% points
                                                                                                                                       • Total REA increased by 14bn to 798bn, due mainly to the higher market risk (+11) and
                                                                                                                                         credit risk (+3)
                                                                                                                                       • Of the DKK 25-35 bn expected REA 1) increase for H1-21 related to implementation of
                                                                                                                                         EBA guidelines, approx. 12 bn has been implemented in Q1-21 and expect the
           2019               2020               Q1 2021            Q1 2021                               Fully phased-                  remainder to take effect in Q2-20. Further increases expected for H2-21 of a similar
          reported           reported            reported              fully                              in regulatory                  magnitude as H1
                                                                     loaded*                             requirement**                 • The Group’s leverage ratio under transitional rules and under fully phased-in rules has
                                                                                                                                         decreased 0.1% point to 4.4% since Q4-2020

 * Based on fully phased-in rules including fully phased-in impact of IFRS 9. ** Pro forma fully phased-in min. CET1 req. in 2021 of                                                                                           10
 4.5%, capital conservation buffer of 2.5%, SIFI req. of 3%, countercyclical buffer of 0.1% and CET1 component of P-II requirement
Debt investor update – Q1 2021

Strong CET1 capital build-up since 2008; Available Distributable Items (ADI) well in
excess of DKK 100 bn
     Common Equity Tier 1, 2008 – Q1-21 (DKK bn)

                                                                                                                     +DKK 67 bn

                                                                                                                                                                                                                          144              145
                                                                                                                  130              134              133               133              127              133
                                                                               119              126
                                                             107
                           79                85
           77

         2008             2009             2010             2011              2012             2013               2014            2015             2016              2017              20181           2019              2020             Q1-21

     REA, CET1, profit and distribution (DKK bn; %)

                                                  2008         2009          2010          2011          2012          2013          2014          2015         2016          2017          2018          2019          2020                  Q1-21

        REA                                        960           834           844           906           819           852           865          834           815           753            748          767           784                      798

        CET1 ratio                                8.1%          9.5%        10.1%         11.8%         14.5%         14.7%         15.1%         16.1%         16.3%         17.6%        17.0%         17.3%         18.3%                      18.1%

        Net profit                                   1.0          1.7           3.7           1.7           4.7           7.1        13.02         17.72          19.9          20.9          15.0         15.1            4.6                      3.1

        Distribution to shareholders3                  0             0            0             0             0           2.0         10.5          17.1          18.9          16.3           7.6             0           1.7                     N/A

        Total assets                              3,544        3,098         3,214         3,424         3,485         3,227        3,453         3,293         3,484         3,540         3,578         3,761         4,109                     4,073

1.The decline in CET1 capital in 2018 is due mainly to Danica Pension’s acquisition of SEB Pension Danmark which led to a higher deduction in Group regulatory capital. 2. Before goodwill impairment charges 3. Based on year-end communicated
distributions. 2017 is adjusted for cancelled buy-back. 2019 is adjusted for cancelled dividend.
                                                                                                                                                                                                                                                          11
Debt investor update – Q1 2021

Fully compliant with MREL requirement; expect to cover MREL need with both
preferred and non-preferred senior
                                                                                                                                   MREL resources and requirements; Q1 2021; % of Group REA
 Overview of MREL                                                                                                                   Overview of MREL

                                                                                                                                                                                                           Senior 1Y        MREL requirement (incl. CBR)
                                                                                                                                                                    42.8%
                                                                                                                                                                    (341)                                  NPS >1Y           Debt buffer + capital req. in RD
 MREL requirement;
                                                                                                                                                                             2.8%
 •   REA based (adjusted for RD): 2x(P1 + P2) + CBR -CCyB =>                                                                                                                 (22)
     DKK 207 bn                                                                                                                                              4.1%                                                            36.0%
                                                                                                                                                             (33)                                                            (287)
 •   CBR stacked on top of MREL requirement => DKK 38 bn
                                                                                                                                                                                                                       Of which allowed
 •   De facto MREL requirement => DKK 245 bn                                                                                                                                                Subordination cap          senior preferred
 •   M-MDA: CBR must be met in addition to MREL => Substantial headroom to M-MDA.                                                                                   12.5%
                                                                                                                                                                    (100)
 Adding
 •   RD capital and debt buffer => DKK 42 bn
 =>Total resolution requirement:
 •   Q1 2021 REA based (incl. CBR) + RD => 36.0% of Group REA / DKK 287 bn                                                                                                                                                    245

 Subordination requirement:                                                                                                                                         23.4%
 •   As the higher of 2x(P1 + P2) + CBR or 8% TLOF => MREL subordination                                                                                            (187)
     requirement 30.6% of adjusted REA (DKK 208 bn)
 •   Total subordination requirement including RD = > 31.3 % (DKK 251 bn)
 •   => We expect to cover MREL need with new issues of both preferred senior and                                                                                                                                              42
     non-preferred senior
                                                                                                                                                           MREL ressources**                                                 MREL

* RD is not included in the consolidation for the purpose of determining the MREL for the Group. The capital and debt buffer requirements that apply to RD are thus deducted from the liabilities used to fulfil the MREL. Consequently, the total
resolution requirement and subordination requirement is the sum of Group’s MREL requirement and RD’s capital and debt buffer requirement.
** MREL resources include structured notes.
                                                                                                                                                                                                                                                                12
Debt investor update – Q1 2021

Funding structure and sources: Danish mortgage system is fully pass-through

 Loan portfolio and long-term funding, Q1 2021 (DKK bn)                     Funding sources (%)

                                                                                                                63 63
                                                2,214
                                                                                     Q4 2020
                                                 109      Senior &
                                                          NPS bonds                  Q1 2021

                           1,828

  Bank loans                621                 1,129     Deposits

  Bank mortgages            399
                                                 168      Covered bonds                                                             13 13
                                                                                                                           9 9                          8 8
                                                                                   6 6
                                                                                            1 1                                                1 2

  RD mortgages              808                  808      Issued RD bonds                              -2 -1
                                                                                  Deposits CD & CP     Repos,   Deposits   Senior   Covered   Subord.   Equity
                                                                                   credit               net                & NPS     bonds     debt
                                                                                    inst.
                            Loans               Funding
                                                                                  Short-term funding                                           Long-term funding

                                                                                                                                                                   13
Debt investor update – Q1 2021

Funding programmes and currencies

     Covered bonds by currency, end-Q1 2021                                                   Largest funding programmes, end-Q1 2021

                                                                                                                                          Utilisation
                                                                0%                                            EMTN Programme                 46%
                 EUR
                                                         21%                                                  Limit – EUR 35bn
                 SEK                                                 38%
                 NOK                                                                                          Global Covered Bond            73%
                 CHF                                                                                          Limit – EUR 30bn

                                                          41%
                                                                                                              ECP Programme                   6%
                                                                           Total DKK 169 bn                   Limit – EUR 13bn

     Senior debt1 by currency, end-Q1 2021                                                                    US MTN (144A)                  57%
                                                                                                              Limit – USD 20 bn

                 USD
                                                               6%
                                                                                                              US Commercial Paper            21%
                 EUR                                     7% 4%                                                Limit – USD 6bn
                 NOK
                                                                     44%
                 SEK
                                                                                                              UK Certificate of Deposit       6%
                 Other                                                                                        Limit – USD 15bn
                                                         40%
                                                                                                              NEU Commercial Paper
                                                                           Total DKK 171 bn                                                   3%
                                                                                                              Limit – EUR 10bn

1.   Including senior preferred and non-preferred debt                                                                                                  14
Debt investor update – Q1 2021

Funding and liquidity: LCR compliant at 151%

  Changes in funding,* 2021 (DKK bn and bp)                                                                      Long-term funding excl. RD (DKK bn)**

                                     Cov. bonds          Senior          Non-Preferred Senior                                                   Funding plan   Completed
          31bp                                                                                                                                          100
                                                                                                                                                                       79        70-90
                    59bp                                                                                                              69
                                                                                                                       67
           36
                     25                          33 bp     81bp                          5bp
                             104bp
                                                   8          8                           8      35 bp
                                 6
                                                                                                   1                                                                            DKK 15 bn
          Redemptions 2021:                 Redeemed 2021: DKK 16 bn                           New 2021:             2017            2018               2019          2020       2021E
              DKK 67 bn                                                                         DKK 9 bn

  Maturing funding,* 2022–2024 (DKK bn and bp)                                                                   Liquidity coverage ratio (%)

                                        Cov. bonds           Non-Preferred Senior
                                        Senior                                                                                                         160
             26bp                                                                                                      154           156                            154       151
                                                   13bp
                                156bp                                                                    170bp
                                                                       68bp              12bp
              41                                             70bp
                       28bp                         32
                                  29                                                                       29
                                                                        23                24                                                                                                100
                        14                                    17
                                                                                                 58bp
                                                                                                  1
               2022: DKK 84 bn                       2023: DKK 72 bn                       2024: DKK 54 bn           Q1 2020       Q2 2020           Q3 2020      Q4 2020    Q1 2021

* Spread over 3M EURIBOR.
** Includes covered bonds, senior, non-preferred senior and capital instruments, excl. RD, .                                                                                                 15
Debt investor update – Q1 2021

Danske Bank covered bond universe, a transparent pool structure1

                      Residential mortgages from
                      • Denmark, D-pool
                                                                                                                                                              +
                      • Norway, I-pool
                      • Sweden, Danske Hypotek AB                                                                                                  C-pool (AAA/AAA)

                      • Finland, Danske Mortgage Bank Plc
                                                                                                                                                                                                             Finland
                      Commercial mortgages from
                      • Sweden and Norway, C-pool                                                                                Norway                    Sweden
                                                                                                                                                                                                         Danske Mortgage
                                                                                                                                                                                                         Bank Plc
                                                                                                            I-pool (AAA/AAA)                              Danske Hypotek                                 Aaa
                                                                                                                                                          AB AAA

                       Pass-through principle based on mortgages
                       from primarily Denmark
                                                                                                                            Denmark
                       • Capital Centre T,
                         Adjustable-rate mortgages
                                                                                                                       Realkredit Danmark A/S
                       • Capital Centre S, Fixed-rate
                                                                                                                       (AAA/AA+)
                         callable mortgages
                                                                                                                       D-pool (AAA/AAA)
 1 The migration to Danske Hypotek of Swedish residential loans from Danske Bank’s I-pool and Swedish residential-like loans from Danske Bank’s C-pool is ongoing. Details of the composition of individual cover pools can be found on the respective
 issuers’ website
                                                                                                                                                                                                                                                         16
Debt investor update – Q1 2021

Danske Bank’s credit ratings

 Long-term instrument ratings                                                                                No rating actions on Danske Bank in Q1 2021

                                         Fitch            Moody’s              Scope               S&P
                                         AAA                Aaa                 AAA                AAA
                                         AA+                Aa1                 AA+                AA+       Moody’s affirmed its rating and Stable outlook on Danske Bank on 18
                                                                                                             December 2020
                                         AA                 Aa2                 AA                     AA
                                                                                                             Moody’s cite asset quality and capitalisation as strengths and profitability
                                         AA-                Aa3                 AA-                    AA-   pressures as a weakness
                                          A+                 A1                 A+                     A+
    Speculative grade Investment grade

                                          A                  A2                  A                     A     S&P affirmed its rating and Stable outlook on Danske Bank on 16 December
                                                                                                             2020
                                          A-                 A3                  A-                    A-
                                                                                                             S&P cite Danske’s capitalisation as a relative strength, offsetting pressure on
                                         BBB+               Baa1               BBB+                BBB+      earnings and asset quality
                                         BBB                Baa2                BBB                    BBB
                                         BBB-               Baa3                BBB-               BBB-      Fitch retains Negative Outlook on Danske Bank’s ratings
                                                                                                             The Negative outlook reflects the economic uncertainties relating to the fallout
                                         BB+                Ba1                 BB+                    BB+
                                                                                                             from the coronavirus pandemic and the financial uncertainties relating to the
                                                                                                             Estonia case
                                           Fitch rated covered bonds – RD, Danske Bank
                                           Moody’s rated covered bonds – Danske Mortgage Bank
                                           Scope rated covered bonds – RD                                    Moody’s and S&P have a stable outlook for Danske Bank, whereas Fitch retains
                                           S&P rated covered bonds – RD, Danske Bank, Danske Hypotek         its Negative outlook. The outlooks reflect the economic uncertainties relating to
                                           Counterparty rating                                               the fallout from the corona crisis and the financial uncertainties relating to the
                                           Senior unsecured                                                  Estonia case
                                           Non-preferred senior
                                           Tier 2
                                           Additional Tier 1

                                                                                                                                                                                                17
Debt investor update – Q1 2021

Danske Bank’s ESG ratings

 We have chosen to focus on five providers based on their importance to our investors
                                                                   Q1 2021                                  31 Dec 2020            31 Dec 2019           31 Dec 2018         Range

                     1        B                   271 companies, out of the 9526 analysed, made the         B                      C                    C                    D- to A+ (A+ highest rating)
                                                  climate change A List in 2020
                              C+ Prime            Decile rank: 1                                            C+ Prime               C Prime              C Prime              D- to A+ (A+ highest rating)
                                                                                                                                                                             A decile rank of 1 indicates a higher
                                                  Of the 287 banks rated, C+ is the highest rating                                                                           ESG performance, while a decile rank
                                                  assigned                                                                                                                   of 10 indicates a lower ESG
                                                                                                                                                                             performance
                              BB                  MSCI rates 197 banks                                      BB                     B                    B                    CCC to AAA (AAA highest rating)
                                                   AAA 2%
                                                   AA 24%
                                                   A     25%
                                                   BBB 25%
                                                   BB 17%
                                                   B       6%
                                                   CCC 1%
                              High Risk           Rank in Diversified Banks 170/388                         High Risk              Medium Risk          N/A                  Negligible to Severe risk
                              (30.2)              Rank in Banks             431/981                         (30.2)                 (29.4)                                    (1 = lowest risk)

                              64                  Rank in Sector                    6/31                    64                     59                   55                   0 to 100 (100 highest rating)
                                                  Rank n Region                    75/1617
                                                  Rank in Universe                 79/4893
         ESG rating agencies are not regulated                                                                        ESG rating agency criteria are not always public
         ESG ratings are unsolicited and in principle based on public information                                     ESG ratings are updated annually with interim updates limited
         Disclosure of ESG ratings is discretionary
1   CDP: Carbon Disclosure Project – primary focus is on climate change / management, also linked to TCFD
                                                                                                                                                                                                                 18
Appendix

01.        Sustainability               20

02.        Business units               29

03.        Credit quality               41

04.        Macro and portfolio reivew   46

05.        Outlook                      49

06.        Contact details              50
Debt investor update – Q1 2021

Danske Bank has been working with sustainability for many years

                                 2006                             2007                             2008                            2009

                             First CSR report                Joined the UN           First Responsible Investment Policy    Began offsetting our
                                 published                  Global Compact             Moneyville launched to support        carbon emissions
                                                                                            financial literacy

                        2015                                 2014                                 2011–13                           2010

                Green Bond Team                 Developed LetBank for customers              Reduced our carbon             Signed the UN-backed
             100% green electricity              less familiar with online banking            emissions by 25%             Principles for Responsible
                                                                                                                                   Investment

                  2016                            2017                           2018                             2019                       2020

      Published sector-specific          Developed the Pocket        Endorsed TCFD and launched        Founding signatory to the      Joined PCAF and the
        Position Statements               Money solution for             +impact for startups             UN Principles for          Net-Zero Asset Owner
                                         children and parents             addressing SDGs                Responsible Banking                Alliance
                                                                                                                                                        20
Debt investor update – Q1 2021

Sustainability is an integrated element of our corporate strategy and our corporate
targets
                           What we want to accomplish by 2023                      How we measure success            The seven focus areas

                                                                                                                                          Sustainable
                            "On average among the top 2 in customer                                                                   1

                                                                                                                        Sustainable
                                                                                        ≤2.0 average CSAT rank                            investing

                                                                                                                          finance
                            satisfaction in everything we do"
  Customers                                                                                                                               Sustainable
                                                                                                                                      2
                                                                                                                                          financing

                            "At least 90% of our employees are engaged"                 ≥90% engagement index                         3   Governance

                                                                                                                        Sustainable
                                                                                                                        operations
  Employees
                                                                                                                                          Diversity &
                                                                                                                                      4
                                                                                                                                          inclusion
                            "We operate sustainably, ethically, and
                                                                                        Quantified progress across                        Environmental
                            transparently – and have positive impact on                                                               5
                                                                                        seven specific focus areas                        footprint
                            the societies we are part of"
     Society
                                                                                                                                          Entrepreneurshi
                                                                                                                                      6

                                                                                                                        initiatives
                                                                                                                                          p

                                                                                                                          Impact
                                                                                        9-10% return on equity
                            "We continuously improve the profitability
                                                                                        CIR in the low 50s                            7   Financial literacy
                            level, leveraging our full potential"
   Investors                                                                            Dividend policy of 40-60%

Note: 2023 ambitions as communicated on 1 November 2019 together with Q3 report.                                                                               21
Debt investor update – Q1 2021

Our 2023 Sustainability Strategy defines the key dimensions for our efforts to create
lasting value for our customers, employees, society and investors
                                 Danske Bank’s 2023 Sustainability Strategy

                                                                                        22
Debt investor update – Q1 2021

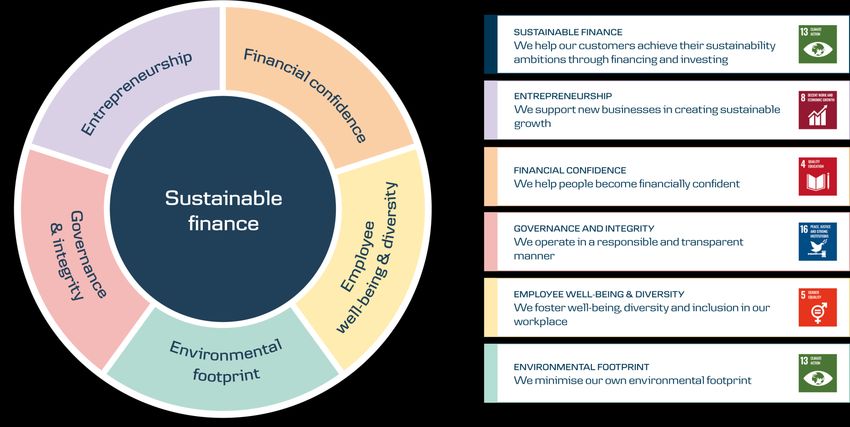
 Danske Bank aspires to Nordic leadership in sustainable finance – our sustainable
 finance framework guides our approach
     Group ambition for
                                                                                              Be a leading bank in the Nordics on sustainable finance
     Sustainable finance

                                                                   Sustainable financing:                                       Sustainable investing:
                                                                   • Well above DKK 100bn in                                    • Danica Pension: DKK 30bn in green assets by 20231), member of
     KPIs and targets                        Group KPIs                                                                           Net Zero Asset Owners’ Alliance
                                                                     sustainable financing by 2023
                                                                   • Paris-aligned corporate lending book;                      • Asset mgmt.: DKK 400bn in art. 8 by 2023 and 150bn in art. 9 by
                                                                     setting climate targets by 2023                              20302), member of Net Zero Asset Managers’ Initiative

                                            Align societal and business                       Enable our customers’                          Measure and improve                          Engage and partner with
     Guiding principles
                                                       goals                                  sustainability journey                               impact                                      stakeholders

     Key execution levers                                         Advice                                              Products & solutions                                             Risk Management

                                                                                        Training &                                                                                                 Communication &
     Critical enablers                            Governance                                                               IT enablement                        Data & insights
                                                                                      competencies                                                                                                   transparency

1)    Towards DKK 50bn in 2025 and 100bn by 2030. Danica Pension is also a signatory to the UN-convened Net-Zero Asset Owner Alliance, i.e. commitment to net-zero emissions by 2050 incl. intermediate targets.
                                                                                                                                                                                                                          23
2)    Article 8 covers investment funds that promote ESG, whereas article 9 covers funds with “sustainability objectives” according to the EU Sustainable Finance Disclosure Regulation. See Appendix for further info.
Debt investor update – Q1 2021

Progress is positive across focus areas – results Q1 2021

                        Sustainable finance                                              Sustainable operations                                               Impact initiatives

             Sustainable              Sustainable                  Governance &               Employee                    Environmental              Entrepreneur-       Financial
             investing                financing                    integrity                  well-being &                footprint                  ship                confidence
                                                                                              diversity

Target       DKK 400bn                Well above                   Over 95% of                More than 35%               Reducing our CO2           10,000 start-ups    2m people
2023         invested in funds        DKK 100bn in                 employees trained          women in senior             emissions by               & scale-ups         supported with
             that promote             sustainable                  annually in risk and       leadership                  10% vs 2019 and            supported with      financial literacy
             ESG – and DKK            financing – and              compliance with            positions                   75% vs 2010                growth and impact   tools and expertise
             30bn                     setting Paris                passed tests                                                                      tools, services     (since 2018)
             invested by              Agreement aligned                                                                                              and expertise
             Danica Pension           climate targets for                                                                                            (since 2016)
             in the green             our corporate
             transition               lending portfolio
Status       DKK 236bn               DKK 136bn 1)                  95%                        28%                         48% vs 2019                5,065               1.15 m
2020         in ESG funds (Q1-21)    (Q1)

             DKK 33bn 1)             23% of portfolio mapped                                                              86% vs 2010 2)
                                     for climate impact
             by Danica (Q1)

 1) Will be calibrated during H4 2021
 2) Reductions in 2020 were largely driven by reduced travel due to COVID-19. The 2023 reduction target is currently being considered for calibration.                                     24
Debt investor update – Q1 2021

Further highlights from include…

                                      •    #1 Nordic bookrunner for green, social and sustainable bonds in 20201)

                                      •    #1 Nordic mandated lead arranger of sustainability-linked loans in 20201)

                                      •    New solutions: Global Sustainable Future & Danica Balance Sustainable
                                           Choice
                                      •    DKK 9.4bn of treasury funds placed in green bonds in 2020

                                      •    Advancing reporting & disclosures e.g. on TCFD, PRB, SASB2)

                                      •    Progress on diversity & inclusion in terms of both results & transparency
                                      •    Updated policy, new expertise and strong organisational change efforts

1)   Bloomberg Global Green Capital Markets League Table
2)   Danske Bank has committed to reporting according to the SASB framework for FY2021                                 25
Debt investor update – Q1 2021

Our position statements are a key tool for aligning with societal goals and
communicating our approach to selected themes and sectors with elevated ESG risks

                                    Thematic statements                                   Sector specific statements

                                              Climate change                       Agriculture        Arms & defence        Forestry

                                               Human rights                                  Fossil fuels      Mining & metals

More information available at https://danskebank.com/sustainability/our-approach                                                       26
Debt investor update – Q1 2021

Danske Bank supports a range of international agreements, goals, partnerships and
standards relating to sustainability – some of these are listed below

 Principles for Responsible              Net-Zero Asset Owner                      Net-Zero Asset Managers              UN Guiding Principles on           Principles for Responsible
 Banking                                 Alliance                                  Initiative                           Business and Human Rights          Investment
 Provide the framework for a             Danica Pension joined the global          An international group of asset      Guidelines for states and          An international investor
 sustainable banking system.             UN-convened investor alliance             managers committed to                companies to prevent, address      network that supports the
 They embed sustainability at the        in 2020, thus committing to               supporting the goal of net zero      and remedy human rights            implementation of ESG factors
 strategic, portfolio and                transitioning its investment              greenhouse gas emissions by          abuses committed in business       into investment and ownership
 transactional levels, and across        portfolio to net-zero greenhouse          2050 or sooner, in line with         operations                         decisions
 all business areas.                     gas emissions by 2050.                    global efforts to limit warming to
                                                                                   1.5 degrees Celsius

 Task force on Climate-related           UN Global Compact                         Partnership for Carbon               UN Environment Programme -         The Paris Pledge
 Financial Disclosures                                                             Accounting Financials                Finance Initiative
                                         A multi-stakeholder initiative                                                                                    A pledge to support and act
 Has developed                           focusing on aligning business             Provides carbon accounting           A partnership between UN and       accordingly in regards to
 recommendations for more                operations with ten principles in         instructions for financial           the global financial sector with   the objectives of the Paris
 effective climate-related               the areas of human rights, labor,         institutions. Danske Bank joined     the aim of understanding           Agreement to limit global
 disclosures to promote more             environment and anti-corruption           in 2020 as the first major           societal challenges, why they      temperature rise to less than 2
 informed investment, credit, and                                                  Nordic bank.                         matter to finance, and how to      degrees Celsius
 insurance underwriting                                                                                                 address them
 decisions

More information available at https://danskebank.com/sustainability/our-approach                                                                                                             27
Debt investor update – Q1 2021

As we progress with execution, we will need to continually develop our key initiatives,
targets and analyse stakeholder expectations, market trends as well as our impact

                                                Target calibration

                       Ongoing development of                        Stakeholder insights, trends
                           key initiatives                               & impact analysis

                                                                                                    28
Debt investor update – Q1 2021

Strong footprint within retail lending

     Lending by segment1 Q1-21 (%)                                                      Credit exposure by industry Q1-21 (%)

            Personal Customers DK                                                             Personal Customers                                              38
            Personal Customer Nordic                                                          Public Institutions                       13
            Business Customers                                                                Commercial Property                      12
            Asset Finance                                                                     Co-ops & Non-Profit                  8
            Large Corporates & Institutions                                                   Financials                       4
                                                                3%                            Capital goods                3
            Northern Ireland
                                                                 0%                           Agriculture                 3
            Group Functions                               14%
                                                                         29%                  Consumer goods              3
                                                                                              Services                    3
                                                     3%
                                                                                              Infrastructure              2
                                                                                              Construction & Building     2
                                                                                              Pharma                      2
                                                                                              Shipping, Oil & Gas        2
                                                                                              Chemicals                  1
                                                                                              Automotive                 1
                                                      32%                                     Social services           1
                                                                        19%
                                                                                              Retailing                 1
                                                                                              Telecom & Media           1
                                                                                              Other Commercials         1
                                                                                              Transportation            1
                                                                                              Hotels & Leisure          1
                                                                      Total lending           Metals & Mining           0                    Total credit exposure
                                                                      of DKK 1,828 bn                                                        of DKK 2,710 bn

1.   Total lending before loan impairment charges.                                                                                                                 29
Debt investor update – Q1 2021

P&BC – Commercial momentum across Personal Customers Nordic; deposit repricing
partly mitigated NII effect
 Highlights

 Personal Customers DK saw                     Good traction in Personal                                                   Launched new green loans
                                                                                        Continued high inflow of low-
 a positive NII development,                   Customers Nordic; continued                                                 for all business customers
                                                                                        margin deposits from
 as deposit repricing more                     inflow from partnership                                                     and lowered threshold from
                                                                                        business customers’ liquidity
 than offset mortgage product                  agreements, especially                                                      DKK 100 m to DKK 30 DKK
                                                                                        management puts pressure
 mix effects and increased                     Norway, to counter continued                                                m for obtaining green loans
                                                                                        on NII
 repayment of bank loans                       margin pressure                                                             offered through RD

 Lending development across segments, index                                             NII as % of loans and deposits
                                                                                                                                       Personal Customers DK
                                                                    Q1/Q1      Q1/Q4
                                                                                         90   0.88                                     Personal Customers Nordic
                             114                                                                            0.86
                                                                                                                         0.84          Business Customers
                                                                                         85
                                                                                                                                                               0.79
                                                                                         80                                           0.82
                                                                                         75
                                                 103                                     70                 0.68         0.68                                  0.67
                                       102                                       102          0.66
                                                                       101                    0.63                       0.63
        99      99                                         99                            65                 0.67                      0.62
                                                                                         60
                                                                                                                                                               0.55
                                                                                                                                      0.59
                                                                                          0
        Personal DK          Personal Nordic   Business Customers       Asset Finance     Q120              Q220         Q320         Q420                  Q121

                                                                                                                                                                   30
Debt investor update – Q1 2021

P&BC –Profit before tax significantly up from diversified income streams in DK, lending
growth in other Nordic countries and lower impairments
Key figures (DKK m)

                                    Q1-21/      Q1-21/
                        Q1-21      Q1-20 (%)   Q4-20 (%)

                                                           Q1-21 vs Q1-20
Total income               5,975    -2%         +6%
                                                           •    PBT significantly up due to considerably lower impairments than the very high model-driven impairments in
                                                                Q1-20 related to the pandemic
Operating                                                  •    Total income slightly down against Q1-20:
                           3,638 +3%           -16%               •     NII tailwind from deposit repricing in Denmark, whereas other Nordic countries’ deposit margin trends
expenses                                                                drove NII slightly down
                                                                  •     Solid fee performance; high investment activity in Q1 almost fully offsetting the effect from the high
Loan                                                                    remortgaging activity in same period last year
                             435 -75%          +685%       •    Expenses up due to the significant spend on AML and compliance remediation throughout 2020
impairments
                                                           Q1-21 vs Q4-20
Profit before                                              •   PBT significantly up, driven by increasing total income and run-off of transformation costs
                           1,903 +126%         +36%
tax                                                        •   Total income up against Q4 driven by
                                                                  •    NII tailwind from deposit repricing in DK combined with positive commercial momentum outside DK.
                                                                       However, lending effects in DK and continued margin pressure drove NII for P&BC slightly down
 Lending                                                          •    positive development for investment activities in Q1 resulting in solid fee income for the quarter
                          1,529    +4%           0%
 (DKK bn)                                                              relative to Q4, even when excluding negative one-off in Q4
                                                           •   Operating expenses were lower than in Q4 mainly because Q4 saw high costs related to transformation and
                                                               seasonal bookings related to year’s end
 Deposits                                                  •   Impairments significantly up, as Q1 saw impairments against Corona related exposure, whereas Q4 saw net
                            696 +16%            +2%
 (DKK bn)                                                      reversal, driven by macroeconomic model updates

                                                                                                                                                                                 31
Debt investor update – Q1 2021

Personal & Business Customers

 Income statement (DKK m)                                                                    NII bridge (DKK m)
                                 Q1-21       Q1-20       Index       Q4-20       Index
                                                                                                                                                              24                44
 Net interest income              3,879       3,951         98        3,910         99         3,910
                                                                                                                11                                  74                                 45        3,879
                                                                                                                            33
                                                                                                                                         4
 Net fee income                   1,750       1,815         96        1,414       124

 Net trading income                150         162          93         153          98         Q4-20         Lending     Lending       Deposit    Deposit         FX           Days   Other     Q1-21
                                                                                                             volume      margin        volume     margin

 Other income                      196         194        101          164        120
                                                                                             Lending and deposit volumes by segment (DKK bn)
 Total income                     5,975       6,122         98        5,641       106
                                                                                                                                                                                         530
                                                                                                              Personal Customers DK                                                       535
                                                                                                                                                                                         527

 Expenses                         3,638       3,528       103         4,318         84                                                                                 308

                                                                                                Lending
                                                                                                           Personal Customers Nordic                                         345
                                                                                                                                                                              352
                                                                                                                                                                                                583
 Impairment charges on                                                                                           Business Customers                                                               604
                                         -           -           -           -           -                                                                                                       600
 goodwill                                                                                                                                    50
                                                                                                                       Asset Finance         49
                                                                                                                                             50
 Profit before loan impairment
                                  2,337       2,594         90        1,322       177                                                                         250
 charges                                                                                                      Personal Customers DK                            262
                                                                                                                                                               265

                                                                                                Deposits
                                                                                                                                                   127
                                                                                                           Personal Customers Nordic                143                                                 Q1-20
 Loan impairment charges           435        1,751         25          -73              -                                                           145
                                                                                                                                                                                                        Q4-20
                                                                                                                                                            225
                                                                                                                 Business Customers                                280                                  Q1-21
                                                                                                                                                                   286
 Profit before tax                1,903        843        226         1,396       136

                                                                                                                                                                                                                32
Debt investor update – Q1 2021

Realkredit Danmark portfolio overview: 71% of new retail lending in Q1 was fixed-rate
vs 48% of stock
C&I lending volume (DKK bn)                                                                                                             Retail loans, Realkredit Danmark, Q1 2021 (%)
Portfolio facts, Realkredit Danmark, Q1 2021                                                                                                           Fixed rate (10 yrs-30 yrs)                 Interest only
                                                                                                                                                       Variable rate (6m-10 yrs)                  Repayment
• Approx. 336,000 loans (residential and commercial)
• 849 loans in 3- and 6-month arrears (-10% since Q4 2020)
• 13 repossessed properties (-8 since Q4 2020)                                                                                                                                                                         24%
• DKK 9 bn in loans with an LTV ratio >100%, including                                                                                                48%                      47%
  DKK 7 bn covered by a public guarantee                                                                                                                                                               71%
• Average LTV ratio of 58%
• We comply with all five requirements of the supervisory diamond for Danish                                                                                                                                           76%
  mortgage credit institutions                                                                                                                        52%                      53%
                                                                                                                                                                                                       29%
LTV ratio limit at origination (legal requirement)
• Residential: 80%
                                                                                                                                                 Stock of loans(DKK 446 bn)                       New lending(DKK 31 bn)
• Commercial: 60%

Total RD loan portfolio of FlexLån® F1-F4 (DKK bn)                                                                                      Retail mortgage margins, LTV of 80%, owner-occupied (bp)

     165                                                                                                                                          Adjustable rate1
                   153           144           142
                                                             124
                                                                           110
                                                                                          95            89     84     75
                                                                                                                                                                                              143         138
                                                                                                                                                 111           106                                                   118
                                                                                                                                                                                                                              101
                                                                                                                                                                               86
                                                                                                                                                                                      68

      Q1     Q2     Q3     Q4     Q1     Q2     Q3     Q4     Q1     Q2     Q3     Q4     Q1     Q2     Q3     Q4     Q1
                                                                                                                                               1-2 yrs       3-4 yrs        5 yrs+   Fixed   1-2 yrs    3-4 yrs     5 yrs+ Fixed rate
              2017                         2018                     2019                           2020              2021                                                            rate
                                                                                                                                                           Repayment                                        Interest-only

 1   In addition, we charge 30 bp of the bond price for refinancing of 1- and 2-year floaters and 20 bp for floaters of 3 or more years (booked as net fee income).                                                                     33
Debt investor update – Q1 2021

LC&I – Strong activity in capital markets, supportive market conditions and good
traction in Asset Management
 Highlights

 Capital Markets sustaining
                                                               Customer activity was high                                                                 Good momentum in Asset
 the positive trend; supported                                                                                         High level of green bond
                                                               across the financial markets,                                                              Management; trend
 customers in a large number                                                                                           issuance in Q1, in which we
                                                               and with supportive market                                                                 continued in Q1-21 with
 of transactions during the                                                                                            maintained our position as a
                                                               conditions, this resulted in                                                               positive net sales, driven
 first quarter across loan,                                                                                            leading bank within
                                                               high seasonal income from                                                                  primarily by the retail
 debt and equity capital                                                                                               sustainable finance in Europe
                                                               Markets                                                                                    segment
 markets

 L&CI income breakdown                                                                                                  Asset Management AuM stock development

                     General Banking     xVA                           Asset management ex. performance fees                           Institutional         Retail
                     Markets ex. xVA     Inv. Banking & Securities     Performance fees

                                                                                                                          Q1-20            387                   244         632
    Q1-20     -344              1,467                  566      151 486 9 2,335

                                                                                                                          Q4-20               465                      288         753    +22%
    Q4-20                        1,598                       761       143   557          505        628       4,192

   Q1-21                         1,564                         1,096         94    610          530 24 3,918             Q1-21                 477                     295          772

                                                                                                                                                                                             34
Debt investor update – Q1 2021

LC&I: Good start to the year with commercial momentum and low impairment levels

Key figures (DKK m)

                                             Q1-21/      Q1-21/
                              Q1-21         Q1-20 (%)   Q4-20 (%)

                                                                    Q1-21 vs Q1-20
Total income                      3,918 +68%             -7%
                                                                    •   PBT significantly up against Q1-20, as we saw a recovery in the financial markets and significantly lower
                                                                        impairments related to oil exposure
Operating                                                           •   Total income significantly up, driven by all income lines, particularly from two trends:
                                  1,851      +2%        -13%              •     Strong recovery for fee and trading income from Q1-20, which was highly affected by difficult market
expenses                                                                        conditions and customer activity
                                                                    •   Operating expenses flat as effects from cost focus mitigated the increasingly higher AML and compliance related
Loan                                                                    costs throughout 2020
                                      69    -94%        -90%
impairments
                                                                    Q1-21 vs Q4-20
Profit before tax                 1,998 +210%           +46%
                                                                    •   PBT significantly up driven by lower impairments, especially related to oil exposure, continued commercial
                                                                        momentum, favourable market conditions and run-off of transformation costs
                                                                    •   Reported total income is down against Q4-20, in which we saw record high performance fees. The underlying
Lending*                                                                positive performance of Q1 stems from:
                                      233    -3 %       +3.8%
(DKK bn)                                                                  •     a continuation of strong capital markets fee performance seen in the latter part of 2020
                                                                          •     supportive financial markets and customer activity allowed for a good trading result
                                                                    •   Asset Management business gained momentum on the back of increased AuM during last year and this
AuM                                                                     continued into the first quarter of 2021
                                      772 +22%           +3%
(DKKbn)
*Lending volume for General Banking
                                                                                                                                                                                      35
Debt investor update – Q1 2021

Large Corporates and Institutions

 Income statement (DKK m)                                                                    NII bridge (DKK m)
                                 Q1-21       Q1-20       Index       Q4-20       Index
                                                                                               1,267
                                                                                                          5         2         11
 Net interest income              1,216       1,143       106         1,267        96                                                   42
                                                                                                                                                0    16             1,216
                                                                                                                                                             1
 Net fee income                   1,599       1,347       119         2,176        73

 Net trading income               1,102        -154       -716         750        147          Q4-20   Lending    Lending   Deposit   Deposit   FX   Days   Other   Q1-21
                                                                                                       volume     margin    volume    margin

 Other income                        1               -           -      -1               -
                                                                                             ECM Nordic League Table, (Source: Dealogic April 22)

 Total income                     3,918       2,336       168         4,191        93           Rank     Bookrunner                                  Deal value EUR (m)
                                                                                                  1      Danske Bank                                                3,760
 Expenses                         1,851       1,812       102         2,119        87
                                                                                                  2      Morgan Stanley                                               3,163
 Impairment charges on                                                                            3      Carnegie                                                     1,576
                                         -           -           -           -           -
 goodwill                                                                                         4      ABG Sundal Collier                                           1,431
 Profit before loan impairment                                                                    5      Pareto Securities                                             975
                                  2,067        523        395         2,072       100
 charges                                                                                          6      Nordea                                                        879
                                                                                                  7      SpareBank 1 Markets AS                                        594
 Loan impairment charges            69        2,328          3         703         10             8      DNB Markets                                                   528
                                                                                                  9      SEB                                                           485
 Profit before tax                1,998      -1,804              -    1,368       146             10     Arctic Securities AS                                          405

                                                                                                                                                                            36
Debt investor update – Q1 2021

Positive result at Danica Pension driven by improved life insurance result; Northern
Ireland held up well despite subdued economic activity and interest rate drop
 Danica Pension, key figures (DKK m)                                                                     Northern Ireland, key figures (DKK m)

                                                   Q1-21               Q1-21/Q1-20 (%) Q1-21/Q4-20 (%)                                      Q1 ‘21          Q1-21/Q1-20 (%) Q1-21/Q4-20 (%)

 Result, life                                                 784                +73%        +38%        Total income                                374            - 6%               -27%

 Result, H&A                                                 -290                     -6%   -245%
                                                                                                         Operating expenses                          275           -10 %                -8%

 Net income*                                                 491               +395%        +40%
                                                                                                         Loan impairments                              -7         -104%              -108%
 Asset under Management                               465,520                         16%      0%

 Premiums, insurance                                       8,599                      +6%    +12%        Profit before tax                           106         +116%              +960%

 Q1-21 vs Q1-20                                                                                          Q1-21 vs Q1-20
 Net income from insurance business significantly up from low levels in Q1-20, primarily                 Total income held up well; increasing lending and deposit volumes, but offset by lower
 driven by a positive result on life insurance due to an increase in fees from higher AuM                interest rates, low economic activity and lower trading income
 and positive investment results on life insurance                                                       Expenses down 8% as a result of tight cost control

 Q1-21 vs Q4-20                                                                                          Q1-21 vs Q4-20
 Net income from insurance business up, driven by an increase of 38% in the life
                                                                                                         NII up 2 % from higher lending and deposits, however, other income lines drive total
 insurance business result. Adjusted for one-offs** in Q1 and Q4, underlying income (in
                                                                                                         income down
 both quarters) saw positive effects from the increasing investment results

*Including 3 m which is booked in Group Treasury,
**Provision of -200 m related to pension yield tax in Q1, and Q4 one-offs of -418 m                                                                                                               37
Debt investor update – Q1 2021

Northern Bank

 Income statement and key figures (DKK m)                                        NII bridge (DKKm)
                                     Q1-21      Q1-20   Index   Q4-20    Index

                                                                                                                                             7
 Net interest income                  331        375     88      324     102                                       3                   12                           331
                                                                                                                           7                             1
                                                                                    324                    10
                                                                                                      3
 Net fee income                        60         83     72       66      91

                                                                                   Q4-20        Lending Lending Deposit Deposit        FX   Days      Other     Q1-21
 Net trading income                    -20        52        -      6        -                   volume margin volume margin

                                                                                 Currency-adjusted development Q1-21 vs Q1-20
 Other income                               3      4     75        4      75
                                                                                     Reported
                                                                                     Local currency
 Total income                         374        515     73      400      94
                                                                                                                                                   32%        28%
                                                                                                                       11%
 Expenses                             275        300     92      307      90                                                      2%

 Profit before loan impairment                                                                            -30%
                                       99        215     46       93     106
 charges                                                                                        -54%

 Loan impairment charges                -7       165        -     83

                                                                                              Profit before loan         Loan growth               Deposit growth
 Profit before tax                    106         49    216       10    1,060                impairment charges

                                                                                                                                                                          38
Debt investor update – Q1 2021

Danica Pension

 Income statement and key figures (DKK m)                                             Asset under management (DKKm)
                                             Q1-21     Q1-20 Index     Q4-20 Index
                                                                                                                 H&A       Life insurance
 Result, life insurance                        784       453    173      569    138
                                                                                       Q1-20                 386,567                    402,669
 Result, health and accident insurance         -290      -274   106       -84   345
 Return on investments, shareholders'                                                  Q4-20                   447,783                       464,605
                                                 0       -157    0        -76    0                                                                            +16%
 equity, etc.
 Goodwill impairment                             0         0               0
                                                                                      Q1-21                    449,037                       465,520
 Discontinued operations                         0         0               0

 Net income before tax at Danica Pension1      494        22 2245        409    121
                                                                                      Development in premiums, insurance contracts
 Included within Group Treasury                  -3       77      -       -59     -                                                               8,599
                                                                                                                                                          8,600
                                                                                                                                                          8,400
                                                                                          8,142
 Net income from insurance business            491        99    496      350    140                                                                       8,200
                                                                                                                                                          8,000
                                                                                                                                     7,708                7,800
 Premiums, insurance contracts                8,599     8,142   106     7,708   112                                                                       7,600
                                                                                                                                                          7,400
                                                                                                                                                          7,200
 Premiums, investment contracts                649       401    162      375    173                                                                       7,000
                                                                                                                   6,647                                  6,800
                                                                                                     6,460                                                6,600
 Provisions, insurance contracts            427,885   384,333   111   428,736   100
                                                                                                                                                          0
                                                                                         Q1-20      Q2-20         Q3-20             Q4-20          Q1-21
 Provisions, investment contracts            32,317    21,917   147    29,525   109

1Figures for   Danica Group                                                                                                                                       39
Debt investor update – Q1 2021

Non-core

 Non-core loan portfolio, Q1-21 (DKK bn)                                                           Non-core, Q1-21 REA (DKK bn)

             Allowance account   Non-performing credit exposure       Performing credit exposure                        Non-core conduits etc.   Non-core banking

                                                                                                         8

                                                                                                                    7
                                                                                                         2

                                                                                      4                             2               5
                                                                                                                                                 5
                                                                  4                                                                 2
                                                                                                                                                 1
                                                                                                                                                                    3
                                                                                                         5
                                                                                                                                                                    1     2
                                                                                                                    4
                                                                                                                                    4            3                        1
                             1                                                                                                                                      2
                                             0                                                                                                                            1
         0
      Retail           Commercial          Public         Conduits, etc.            Total             372019
                                                                                                     Q4          35
                                                                                                                 Q1 2020       Q2 2020
                                                                                                                              31        Q3 2020   Q4 2020               Q1 2021
                                                                                                                                       28       27
    customers          customers        institutions

                                                                                                                                                                                  40
Debt investor update – Q1 2021

 Credit quality: Low level of actual credit deterioration

  Breakdown of core allowance account under IFRS 9 (DKK bn)                                                   Allowance account by business unit (DKK bn)
                                                                                                                 P&BC         N.I.
           Stage 1          Stage 2          Stage 3
                                                                                                                 LC&I         Other (Non-core)

           24.1                   24.9                   23.6                                                       25.1                 25.9              24.6
                                                                                22.6                 22.5                                                                       23.5                23.3

                                                                                                                    7.1                   8.0               6.6                  5.8                 5.5
           15.2                   15.9                   14.2                   12.9                 13.4

                                                                                                                    16.2                 15.9              16.0                 15.8                15.9
            7.5                    7.5                     7.2                   7.4                  6.9
            1.5                    1.5                     2.2                   2.3                  2.2
        Q1 2020                Q2 2020                 Q3 2020                Q4 2020               Q1 2021       Q1 2020              Q2 2020           Q3 2020              Q4 2020            Q1 2021

  Breakdown of stage 2 allowance account and exposure (DKK bn)                                                Gross non-performing loans* (DKK bn)
                                                Allowance         Gross credit Allowance as %
                                                 account           exposure    of gross exposure                        Individual allowance account   Net exposure not in default     Net exposure in default

                  Personal customers                 2.2             1,029.1               0,21%                    37.2                 35.7             34.3
                                                                                                                                                                               31.8               30.9
                  Agriculture                        0.9               70.7                1,22%
                                                                                                                    15.2                 15.9             14.1
                  Commercial property                1.1              318.7                0,34%                                                                               12.9               13.2
                  Shipping, oil and gas              0.4               47.2                0,86%                    10.5
                                                                                                                                         13.7             13.9                 12.1               11.7
                  Services                           0.2                6.7                0,26%
                                                                                                                    11.5
                  Other                              2.2             1,199.0               0,18%                                          6.1              6.3                  6.7                6.0
                  Total                              6.9             2,732.0               0,25%                  Q1 2020             Q2 2020           Q3 2020             Q4 2020             Q1 2021

* Non-performing loans are loans in stage 3 against which significant impairments have been made.
                                                                                                                                                                                                                 41
Debt investor update – Q1 2021

Oil-related exposure: Q1 saw impairment charges at a lower level

 Key points, Q1-21

 •   The offshore segment, in which we see credit deterioration, makes up 36% of the exposure and accounts for 75% of expected credit losses. Uncertainty continues
     in the oil & gas industry
 •   Looking at oil-related exposures, the main risk lies with exposures other than oil majors. Since the end of 2019, these net exposures have been actively brought
     down 45%
 •   Furthermore, of the remaining net credit exposure of DKK 8.3 billion, 72% is covered by collateral

Group gross credit exposure                   Oil-related gross credit exposure
                                                                                         Development in oil-related net credit exposure (excl. oil majors)
(DKK 2,73 bn)                                 (DKK 17.8 bn)

                                                                                                                                                   Net credit exposure
                                                                            22%                                    -1%                             Covered by collateral

                                                                                                        8.4                    8.3

                              0.6%                  41%                            14%                                                                   5.9

                                                                             23%

                                                 Oil majors
                                                 Offshore - Rigs/FPSO
                                                 Offshore - Supply vessels, etc.                     Q4 2020                 Q1 2021             Of which covered
       Oil-related exposure      Other           Oil service                                                                                     by collateral (Q1)

                                                                                                                                                                           42
Debt investor update – Q1 2021

Credit exposure: Limited agriculture and directly oil-related exposure

  Agriculture exposure                                                                                                                      Oil-related exposure

   • African Swine Fewer (ASF), which spread to Germany in Q3 2020, continues to                                                            • Total oil-related exposure was more or less unchanged from the preceding quarter
     cause uncertainty for the industry. Therefore, the post-model adjustments applied
     remain in place. Milk and pork prices weakened slightly from levels of the preceding                                                   • Accumulated impairments at LC&I decreased to DKK 2.2 bn, driven by write-offs.
     quarter                                                                                                                                  However, some additional impairments were still made in the quarter, mainly in the
                                                                                                                                              offshore segment.
   • Total accumulated impairments amounted to DKK 2.5 bn in Q1-21 against DKK 2.4                                                          • Most of the oil-related exposure is managed by specialist teams for customer
     bn in Q4-20                                                                                                                              relationship and credit management at LC&I

  Agriculture by segment, Q1 2021 (DKK m)                                                                                                   Oil-related exposure, Q1 2021 (DKK m)
                                        Gross credit            Portion           Expected        Net credit       NPL coverage                                                                      Gross credit        Expected credit       Net credit
                                         exposure              from RD            credit loss     exposure             ratio                                                                          exposure                loss             exposure

    P&BC                                          56,794               36,475           2,360         54,434            95%                                    LC&I                                          17,714                 2,211           15,504

    Growing of crops, cereals, etc.               23,511               18,348             593         22,919            95%                                    Oil majors                                      7,370                       2         7,367

    Dairy                                         10,024                  6,735           930           9,094           95%                                    Oil service                                     3,924                   538           3,386
                                                                                                                                                               Offshore                                        6,420                1,670            4,751
    Pig breeding                                  10,468                  8,335           590           9,878           99%
                                                                                                                                                               P&BC                                             160                        5           155
    Mixed operations etc.                         12,791                  3,058           247         12,544            77%
                                                                                                                                                               Oil majors                                           15                     0            15
    LC&I                                           8,911                  1,654            48           8,863           45%
                                                                                                                                                               Oil service                                      139                        5           134
    Northern Ireland                               5,007                                   94           4,913           50%
                                                                                                                                                               Offshore                                              6                     0                6
    Others                                             0                                    0                 0          -
                                                                                                                                                               Others                                                2                     0                2
    Total                                        70,712               38,130           2,502          68,210            90%
                                                                                                                                                               Total                                         17,876                 2,216           15,661
                          Share of Group net exposure          Share of Group Share
                                                                                 Expected  credit
                                                                                    of Group net                  Share of Group net   Expected credit loss            Share of Group net exposure      Share of Group Share of Group
                                                                                                                                                                                                                          Expected    net
                                                                                                                                                                                                                                    credit          Share of Group net   Expected credit los
                                    2021Q1                    net NPL 2021Q1exposure
                                                                                  loss 2021Q1
                                                                                       2020Q4                       NPL 2021Q1              2020Q4                               2021Q1                net NPL 2021Q1exposure
                                                                                                                                                                                                                           loss 2021Q1
                                                                                                                                                                                                                                 2020Q4               NPL 2021Q1              2020Q4
                                        2.5%                         7.6%                  0.6%       2,447             4.1%                             325                      0.6%                       16.8%              0.6%        2,390               4.1%

* The credit exposure is reported as part of the shipping, oil and gas industry in our financial statements.
                                                                                                                                                                                                                                                                             43
Debt investor update – Q1 2021

Credit exposure: Limited exposure to transportation, hotels, restaurants and leisure

  Transportation exposure                                                                                                           Hotels, restaurant and leisure exposure

   • Total gross exposure* increased DKK 1 bn to DKK 16.6 bn from the Q4-20 level due
     mainly to increased exposure to a few A-rated customers in passenger transport
                                                                                                                                    • Total gross exposure was down slightly from the preceding quarter. While exposure to
   • Demand for cross-border passenger transport remains dramatically reduced.                                                        leisure and restaurants increased, exposure to hotels decreased DKK 0.5 bn
     Danske Bank’s spending monitor of 22 April shows that even though airline spending
     has increased it is only around 30% of the level 2019. At DKK 0.9 bn, our exposure
     to passenger air transport remains limited

   • Accumulated impairments amounted to DKK 310 million in Q1, which is in line with                                               • Impairments increased to DKK 629 million from 552 million in Q4 2020
     Q4-20. Post-model adjustments for corona crisis high-risk industries remains in
     place

  Transportation by segment, Q1-21(DKK m)                                                                                           Hotels, restaurants and leisure by segment, Q1-21 (DKK m)
                                             Gross credit                                               Net credit                                                       Gross credit       Expected credit    Net credit
                                                                      Expected credit loss
                                              exposure                                                  exposure                                                          exposure               loss          exposure
   Freight transport                                       9,038                               112               8,925                   Hotels                                     6,832                228         6,604
   Passenger transport                                     6,589                               178               6,411                   Restaurants                                4,800                184         4,616
   - of which air transport                                  888                                 49               840                    Leisure                                    4,269                216         4,052
   Postal services                                           993                                 20               974                    Total                                   15,902                 629        15,272
   Total                                                16,620                                310            16,310

         Share of Group net              Share of Group netShare
                                                               Expected
                                                                 of Groupcredit
                                                                          net lossShare of Group net                             ExpectedShare
                                                                                                                                          creditofloss
                                                                                                                                                   Group net exposure Share of Group Share
                                                                                                                                                                                        Expected credit
                                                                                                                                                                                           of Group net        Share of Group net
         exposure 2021Q1                   NPL 2021Q1 exposure 2021Q12020Q4         NPL 2021Q1                                        2020Q4 2021Q1                   net NPL 2021Q1exposure
                                                                                                                                                                                         loss 2020Q4
                                                                                                                                                                                              2021Q1             NPL 2021Q1
                  0.6%                            4.1%                    0.6%                 325        4.1%                                          0.6%
                                                                                                                                                       325                   5.2%              0.6%      552           4.1%
* The numbers do not include exposure to businesses that are hit by a second wave impact, e.g. airports and service companies.
                                                                                                                                                                                                                              44
Debt investor update – Q1 2021

Credit exposure: Limited exposure to retailing and stable credit quality in commercial
real estate
 Retailing                                                                                        Commercial real estate

                                                                                                  • Gross exposure decreased to DKK 319 bn in Q1-21 from DKK 331 bn in Q4-20 - driven
 • Total gross exposure stayed at DKK 27.1 bn while the Q/Q changes in two subsegments
                                                                                                    mainly by single-name exposure
   was single-name driven. The share of Group net exposure remained at 1.0%.
                                                                                                  • Overall, credit quality was stable
 • In recent years, we have had a selective approach to this segment and have generally
   decreased exposure
                                                                                                  • Exposure is managed through the Group’s credit risk appetite and includes a selective
                                                                                                    approach to sub-segments and markets
 • Accumulated impairments did not change significantly in Q1-21
                                                                                                  • Commercial property exposure is managed by a specialist team

 Retailing by segment, Q1 2021 (DKK m)                                                            Commercial real estate by segment, Q1 2021 (DKK m)
                                  Gross credit        Expected credit      Net credit                                                      Gross credit     Expected credit    Net credit
                                   exposure                loss             exposure                                                        exposure             loss          exposure
                                                                                                        Non-residential                           170,656             1,947       168,709
     Consumer discretionary                 11,904                   999         10,905
                                                                                                        Residential                               137,065               751       136,314
     Consumer staples                       15,235                    79         15,157
                                                                                                        Property developers                        10,566               163         10,403
     Total                                 27,140                  1,077        26,062                  Buying/selling own property, etc              396               -             396
                                                                                                        Total                                    318,683              2,861      315,821

          Shareof
          Share ofGroup
                  Groupnet
                        netexposure
                                Share ofShare
                                         Groupofnet
                                                 GroupExpected
                                                       Share of credit
                                                                Group
                                                          Expected     loss
                                                                        net
                                                                    credit                Share of Group net of Group
                                                                                                       Share     Expected             Share of Group net NPL Share
                                                                                                                            credit loss
                                                                                                                      net exposure                                 of Group
                                                                                                                                                                 Expected   net loss Share of Group
                                                                                                                                                                          credit
          exposure2021Q1
                   2021Q1          NPLnet
                                       2021Q1
                                          NPL 2021Q1exposure
                                                           2020Q42021Q1
                                                           loss 2020Q4                      NPL 2021Q1           2021Q12020Q4                2021Q1          exposure 2021Q1
                                                                                                                                                                       2020Q4          NPL 2021Q
                                                                                                                      11.7%                       12.7%                 0.6%           2,628        4.1%
                  0.6%1.0%                  4.1% 5.6%                  0.6%     1,264
                                                                                  325            4.1%                                      325

                                                                                                                                                                                               45
Debt investor update – Q1 2021

Nordic macroeconomics
                                                                   Denmark   Sweden   Norway   Finland   EU

 Real GDP, constant prices (index 2005 = 100)   Inflation (%)

 Interest rates, leading (%)                    Unemployment (%)

Source: Danske Bank Macro Research                                                                            46
Debt investor update – Q1 2021

Nordic housing markets
                                                                 Denmark    Sweden    Norway   Finland   EU

 Property prices (index 2005 = 100)    House prices/nom. GDP (index 2005 = 100)

 Apartment prices (index 2005 = 100)   Apartment prices/nom. GDP (index 2005 = 100)

Source: Danske Bank Macro Research                                                                            47
Debt investor update – Q1 2021

Consumer behavioural metrics
                                                                                                                             Denmark       Sweden        Norway        Finland     EU

C&I lending volume (DKK bn)                                                                     Consumer spending, Denmark (same weekday 2019 = 100)
   290                                                                                           120
   285                                                                                           110
   280
                                                                                                 100
   275
   270                                                                                            90
   265                                                                                            80
   260                                                                                            70

                                                                                                      0
      0                                                                                                       Feb    Apr      Jun         Aug         Oct            Jan          Apr
            Q2 ’19      Q3 ’19       Q4 ’19   Q1 ’20   Q2 ’20      Q3 ’20   Q4 ’20     Q1 ’21                2020   2020     2020        2020        2020           2021         2021

Property prices (change y/y in %)                                                               Unemployment (%)

   20                                                                                            12
                                                                                                 10
   15
                                                                                                  8
   10
                                                                                                  6
     5                                                                                            4
     0                                                                                            2
    -5                                                                                            0
          Jan-20            Apr-20            Jul-20            Oct-20        Jan-21                      Jan-20    Apr-20      Jul-20          Oct-20            Jan-21

Source: Danske Bank Macro Research                                                                                                                                                      48
Debt investor update – Q1 2021

      2021 outlook – We confirm our net profit guidance for the rest of the year

                                                                We expect total income to be slightly higher than the level in 2020, subject mainly to
                           Total income
                                                                commercial momentum and broader economic developments

                                                                Expenses are expected to be no more than DKK 24.5 bn, driven by ongoing cost initiatives
                           Expenses
                                                                and lower costs for transformation and remediation

                                                                Loan impairments are expected to be no more than DKK 3.5bn, subject to a modest
                           Impairments
                                                                macroeconomic recovery based on a positive impact from COVID-19 vaccines

                           Net profit                           We expect net profit to be in the range of DKK 9–11bn

Note – The outlook is subject to uncertainty and depends on economic conditions, including government support packages.                                    49
Debt investor update – Q1 2021

Contacts

                    Kimberly Bauner            Mobile +46 73 700 19 39   Claus Ingar Jensen        Mobile +45 25 42 43 70
                    Head of Group Treasury     tag@danskebank.dk         Head of IR                clauj@danskebank.dk

                    Bent Callisen              Direct +45 45 12 84 08    Nicolai Brun Tvernø       Mobile +45 31 33 35 47
                    Head of Group Funding,     Mobile: +45 30 10 23 05                             nitv@danskebank.dk
                                                                         Chief IR Officer
                    Group Treasury             call@danskebank.dk

                    Thomas Halkjær Jørgensen   Direct +45 12 83 94
                                                                         Olav Jørgensen            Mobile +45 52 15 02 94
                    Chief Portfolio Manager,   Mobile +45 25 42 53 03
                                                                         Chief IR Officer          ojr@danskebank.dk
                    Group Treasury             thjr@danskebank.dk

                    Rasmus Sejer Broch         Direct +45 45 12 81 05
                                                                         Sofie Heerup Friis        Mobile +45 20 60 51 15
                    Senior Funding Manager,    Mobile +45 40 28 09 97
                                                                         Senior IR Officer         sofri@danskebank.dk
                    Group Treasury             rasb@danskebank.dk

                                                                         Patrick Laii Skydsgaard   Mobile +45 24 20 89 05
                                                                         Senior IR Officer         pats@danskebank.dk

                                                                                                                            50
Debt investor update – Q1 2021

Disclaimer

Important Notice
This presentation does not constitute or form part of and should not be construed as, an offer to sell or issue or the solicitation of an offer to buy or acquire securities of
Danske Bank A/S in any jurisdiction, including the United States, or an inducement to enter into investment activity. No part of this presentation, nor the fact of its
distribution, should form the basis of, or be relied on in connection with, any contract or commitment or investment decision whatsoever. The securities referred to
herein have not been, and will not be, registered under the Securities Act of 1933, as amended (“Securities Act”), and may not be offered or sold in the United States
absent registration or an applicable exemption from the registration requirements of the Securities Act.

This presentation contains forward-looking statements that reflect management’s current views with respect to certain future events and potential financial
performance. Although Danske Bank believes that the expectations reflected in such forward-looking statements are reasonable, no assurance can be given that such
expectations will prove to have been correct. Accordingly, results could differ materially from those set out in the forward-looking statements as a result of various
factors many of which are beyond Danske Bank’s control.

This presentation does not imply that Danske Bank has undertaken to revise these forward-looking statements, beyond what is required by applicable law or applicable
stock exchange regulations if and when circumstances arise that will lead to changes compared to the date when these statements were provided.

                                                                                                                                                                                  51
You can also read