Corporate Presentation - Rheinmetall AG, November 2017 - Home
←
→
Page content transcription
If your browser does not render page correctly, please read the page content below

Corporate Presentation

Rheinmetall AG, November 2017

Rheinmetall Group

Rheinmetall Group:
Serving the need for mobility and security

                           Sales             €5,602m                              Organic growth
   Key                     EBIT               €353m                    Strategy
   Performance                                                                    Internationality expansion
                           Operating FCF      €161m                    roadmap
   Indicators              EPS
                           Headcount
                                                €4.69
                                         20,993 (FTE)
                                                               2016               Leading by innovations
                                                                                  Targeted acquisitions

                           €2,656m                   48%     Sales      52%            €2,946m
                            €223m                    60%     EBIT       40%              €147m
                    10,820 (FTE)                     52%                48%        10,002 (FTE)
                                                           Headcount
FTE: Full time employees

 © Rheinmetall AG / Corporate Presentation Q3 2017                                                             2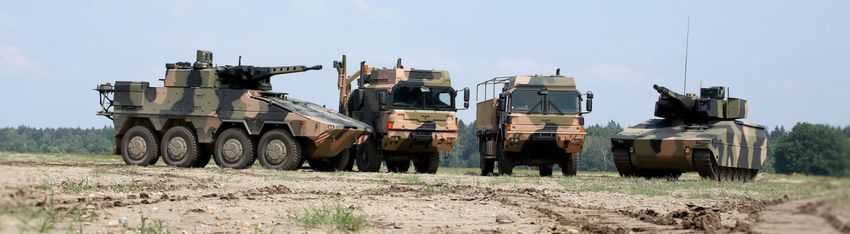
Rheinmetall Group

Rheinmetall Group:
Products and divisions

                     Automotive                                                                     Defence

 Focus: Engine efficiency,                           Risk balanced structure based on   Established long term supplier of
 NOx- and CO2 - reduction                            >125 years of enterprise history   ground force equipment
      Mechatronics: Provider of cleaning             Clear management focus: growth        Vehicle Systems: Successful
      technologies like exhaust gas                  and profitability                     formation of a military vehicle
      recirculation                                  Both segments on right                producer with wide product range
                                                     performance track                     Weapon & Ammunition:
      Hardparts: Casting products like                                                     International market leader
      pistons, engine blocks and structural                                                position
      parts
                                                                                           Electronic Solutions: Strong
      Aftermarket: Supporting repair shops                                                 product basis for electronic and IT
      with a comprehensive assortment of                                                   based equipment
      spare parts
 © Rheinmetall AG / Corporate Presentation Q3 2017                                                                               3
Rheinmetall Group

Rheinmetall Group:
Business Model

         Rising individual mobility                   Market      Increased number of conflicts and threats
         Regulatory push for cleaner cars             drivers     Higher defence spending

         Tier 1 supplier of OEMs                                 Leading provider of innovative products
         Expansion in global markets based on high-              primarily to ground forces
         tech products                                Business
                                                                 High order potential in home markets
         Focus on combustion engines with chances      model
                                                                 Internationalization by cooperation
         for hybrid and e-engines
         Strong pillar through non-LV business

 © Rheinmetall AG / Corporate Presentation Q3 2017                                                         4
Rheinmetall Group

Rheinmetall Group:
More than 100 production sites and offices on all continents
                                                                Germany      UK
Defence                                                                                      Russia
                        USA                                   Netherlands    Norway
                                                                                                                     Singapore
Sites                Canada                                   Switzerland    Sweden South        Saudi Arabia        Malaysia
                     Mexico                                       Austria    Poland Africa       UAE                             Australia
                                                                     Italy

                  USA
                Mexico                                                                                          Japan
                                                                                                                China
                                                              Germany                                            India
                                                                France    Spain
Automotive                                           Brazil
                                                                  Italy   Czech Republic
Sites                                                            Malta    Turkey
                                                              Romania     UK

 © Rheinmetall AG / Corporate Presentation Q3 2017                                                                                       5
Rheinmetall Group

ESG with high importance for Rheinmetall
       Environment                                      Social                                       Governance
    • Reduction of the ecological footprint          • Clear statement against cluster munition   • Transparency towards customer,
          • Decrease of energy needed                                                               investors and other stakeholder
          • Selective use of raw materials
                                                     • Promoting education and training
                                                     • Support of gender diversity                • Non-compliant business behavior is
    • „Road to 95“ and E-mobility                                                                   unacceptable
          • Our products increase fuel efficiency          • Women in management
          • New ebike, e-motor and battery pack      • Workforce                                  • Zero tolerance of corruption and fraud
    • Support of conservation                              • Integration of refugees via
                                                                                                  • Central Compliance Management System
                                                             apprenticeships
                                                                                                        • Employee awareness initiative
    • Development of the former production                 • Support of employee families
      site in Düsseldorf

 © Rheinmetall AG / Corporate Presentation Q3 2017                                                                                           6
Rheinmetall Group

 Corporate Presentation: Rheinmetall Group Q3 2017

 © Rheinmetall AG / Corporate Presentation Q3 2017   7
Rheinmetall Group

Highlights Rheinmetall Group Q3 2017
Solid quarter with strong result contribution from Defence

                                                     Sales increased by 4.7% to €1.366 bn or
                                                     5.4% currency adjusted

                                                     Operating result improved by 23% to €97 m

                                                     Group margin gained 100bp advancing
                                                     from 6.1% to 7.1%

                                                     Automotive optimized global footprint with

                           Q3                        an EBIT impact of €22 m

                                                     FY guidance affirmed

 © Rheinmetall AG / Corporate Presentation Q3 2017                                                8
Rheinmetall Group

Operational margin improvement continues in Q3

     Sales                                           Operational result in EUR million
     in EUR million                                  Operational margin in %
                                    5%
                                           1,366
                                                                           23%
                                                                                 97
                           1,305
                                                                   79            7.1

                                                                   6.1

                                                                    Q3            Q3
                            Q3              Q3                      2016          2017
                            2016            2017

 © Rheinmetall AG / Corporate Presentation Q3 2017                                       9
Rheinmetall Group

Cash flow affected by working capital buildup in Defence

     Operating Free Cash Flow                        Earnings per share   Headcount
     in EUR million                                  in EUR               in capacities

                -86%                                                                       3%
          36                                                     1.18          20,982           21,552

                                                      0.97       0.35

                                                                 0.83

                           5

         Q3              Q3                           Q3        Q3            30.09.2016        30.09.2017
         2016            2017                         2016      2017

 © Rheinmetall AG / Corporate Presentation Q3 2017                                                           10
Rheinmetall Group
Solid financial status further improved
Net debt Equity ratio
in EUR million in % of total assets
-46% +5pp
445 31%
26%
242
30.09.2016 30.09.2017 30.09.2016 30.09.2017
© Rheinmetall AG / Corporate Presentation Q3 2017 11Rheinmetall Group
Highlights Rheinmetall Automotive Q3 2017
Market outperformed, margin improved
Sales rose by 6% to €684 m, FX adjusted 7.3%
Operating result grew by 12% to €57 m
Operating margin increased by 40bp to 8.3%
Quarterly free cash flow improved by €34m to €81 m
Restructuring impact on reported EBIT of €22 m
Solenoid valve
© Rheinmetall AG / Corporate Presentation Q3 2017 12Rheinmetall Group
Operational leverage in Mechatronics and Hardparts drive the quarter
Sales Automotive Operating result Automotive Reasons for result development
in EUR million in EUR million
6%
684 12% Mechatronics
643 57 Strong demand for fuel
51 optimization as main driver;
emission reduction on solid level
382
355 +8%
+14% 40
35
Hardparts
Higher demand for Large Bore
Pistons and good development for
232 European LV pistons
225
+3% 11 +18% 13
Aftermarket
82 +16% 95 9 0% 9 Recovery of sales in East European
-19 -25 -4 -5 countries
Q3 2016 Q3 2017 Q3 2016 Q3 2017
Restatement of 2016 reported figures in Mechatronics and Aftermarkets related to change in plant assignment
© Rheinmetall AG / Corporate Presentation Q3 2017 13Rheinmetall Group
Markets in better shape than anticipated, outperformance intact
Regional sales development Automotive Regional sales growth Q3 2017
in EUR million in % (IHS October 2017)
6%
684 Global 6.4
643 2.2
27 4
Row 3
21
South America 95
84
RoW 21
Asia -10
105 113
North America Asia 13
(incl. China) 4
Germany 138 142 10
China 0
North America 8
67% 65% -8
Europe South America 29
292 303 25
(excl. Germany)
Germany 3
1
Rheinmetall
Europe 3
Q3 2016 Q3 2017 (incl. Germany) 5 IHS LV production
© Rheinmetall AG / Corporate Presentation Q3 2017 14Rheinmetall Group
Chinese entities stronger than the market
China LV production Sales in million Operating result in million / in %
in million units +7% +8%
1,845 146 Strong growth and operating
1,717 134
-0.4% earnings
1,514 1,610 CNY 119
6.3 6.3 116
JVs: Hardparts sales up;
0 204 -2 236 18 27
operating margin slightly lower
7.7% 7.2%
8.7% 11.6%
WFOEs: High demand for
+2% +3% Mechatronics products, rising
232 236 18 19 profitability
EUR
Q3 2016 Q3 2017 204 206 16 15
JVs (100% figures of 50/50 JV, consolidated at equity)
28 30 2 4 WFOEs (Wholly Foreign-Owned Enterprises)
0 0
Q3 2016 Q3 2017 consolidation
Q3 2016 Q3 2017
© Rheinmetall AG / Corporate Presentation Q3 2017 15Rheinmetall Group
Hardparts streamlined its global footprint
Closure of pistons plant in Thionville (Lorraine/France) Financial impact
Strategic step to improve the One time cost of around €22 m,
cost basis of Hardparts thereof:
Concentration of European €17 m for severance payments
LV pistons production and site remediation (cash-
in Ustí (CZ) effect in 2018)
Reduction of around 140 Rheinmetall Automotive, Thionville, France €5 m asset impairment (non-
headcount in a consensual way cash effect)
by support of post-employment
Hardparts site Annual savings of around €10 m
development plans
expected mid-term
Production will cease in H2 2018
© Rheinmetall AG / Corporate Presentation Q3 2017 16Rheinmetall Group
Highlights Rheinmetall Defence Q3 2017
Strong momentum in earnings and order intake
Order intake rose by €296 m to €870 m
Sales gained 3% to €682 m
Operating result increased by 53%
from €30 m to €46 m
Operating margin went up from 4.5% to 6.7%
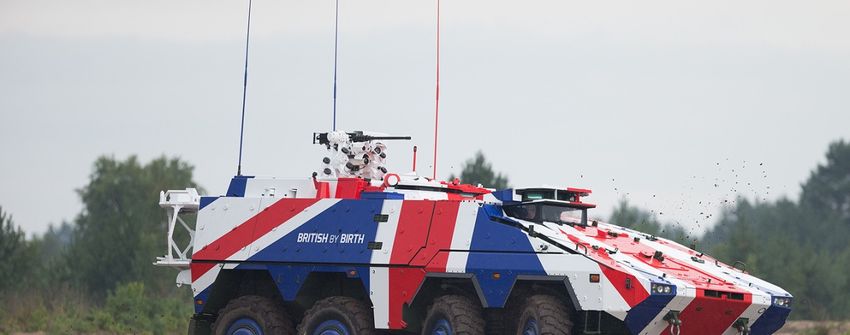
Boxer „UK edition“ for DSEI fair 2017
© Rheinmetall AG / Corporate Presentation Q3 2017 17Rheinmetall Group
Rheinmetall Defence
Margin and order intake trend positively towards FY guidance
Quarterly sales and margins development Comments on quarterly performance
Strong increase of German orders (i.e. vehicles and ammunition)
1,034
661 731 682 Moderate sales growth of 3% as anticipated
11.2 612
4.5 3.3 6.7 Profitability improved materially, supported mainly by Vehicle
-1.6 Systems
Q3 Q4 Q1 Q2 Q3 Cash flow impacted by working capital build up
in EUR million Q3 2016 Q3 2017 Δ % 9m 2016 9m 2017 Δ %
Order intake 574 870 51.6% 2,325 2,292 -1.4%
Sales 662 682 3.0% 1,912 2,025 5.9%
Operating result 30 46 53.2% 32 60 88.9%
Operating margin in % 4.5 6.7 220 bp 1.7 3.0 130 bp
EBIT 30 46 53.8% 32 57 79.2%
Operating Free Cash Flow 5 - 52 n.a. - 216 - 157 27.3%
Operating FCF / Sales in % 0.8 - 7.6 -838 bp - 11.3 - 7.8 354 bp
© Rheinmetall AG / Corporate Presentation Q3 2017 18Rheinmetall Group
Operational strength in Vehicle Systems as well as Weapon and Ammunition
Sales Defence Operating results Defence Reasons for result development
in EUR million in EUR million
+3% +53% Weapon and Ammunition
662
682 46 Good sales development leads
to higher earnings
227 248
+9% 30
28 Electronic Solutions
172 -4% 165 +12% Stable results development despite
25
softer sales
6
361 +3% 370 +20% Vehicle Systems
5 13 Sales driven by high order execution in
>100%
4 tactical and logistical vehicles
-1
-98 -101 -4
Q3 2016 Q3 2017
Q3 2016 Q3 2017
Weapon a. Ammunition Vehicle Systems
Electronic Solutions Consolidation/Others
© Rheinmetall AG / Corporate Presentation Q3 2017 19Rheinmetall Group
German contracts essential for high order intake in Q3
Order intake by division Order backlog profile
in EUR million in EUR billion
6.9
+52%
6.7
2.5
870
284 1.8
574
1.5
173
Major German
197
orders with total
185 value > €460 m 0.9
included
434
288
-72 -45
30.09. 30.09. 2017e 2018e 2019e 2020e ff
Q3 2016 Q3 2017
2016 2017
Weapon and Ammunition Vehicle Systems
Electronic Solutions Consolidation/Others
© Rheinmetall AG / Corporate Presentation Q3 2017 20Rheinmetall Group
Rheinmetall will modernize German logistical fleet
2017 2018 2021
First lot Second lot
Bundeswehr
Truck Order
558 trucks ~1.600 trucks
Framework
agreement signed
Framework agreement
HX2 family replaces the existing fleet of military trucks
Net value: €760 m for ~2.200 vehicles
First lot delivered between 2018-21
Second lot delivery schedule yet to be specified
© Rheinmetall AG / Corporate Presentation Q3 2017 21Rheinmetall Group Q2 2017
Outlook
Guidance affirmed for 2017
AU TO M OT I V E DEFENCE
M a c ro v i ew Global LV production growth ~2%* Further demand increase in key markets
Chinese LV production growth ~1% Germany and other allies have stepped up
investment budgets
R h e i n m eta l l Automotive expected to outperform markets Strong back end loading of Defence performance
Important step of cost base improvement Single digit sales growth expected for 2017
achieved with closure of French piston Stronger sales momentum 2018
production
Updated Sales growth expected at the upper range of Sales growth expected at the lower range
Outlook 2017 the guidance of 6-7% and operating margin of the guidance of 5-6% and operating margin
level confirmed around 8.4% at upper end of the guidance of 5-5.5%
Group expected to grow around 6% at an operating margin slightly above 6.5%
incl. efforts for New Technologies
*Source: IHS October 2017
© Rheinmetall AG / Corporate Presentation Q3 2017 22Rheinmetall Automotive Corporate Presentation: Rheinmetall Automotive © Rheinmetall AG / Corporate Presentation Q3 2017 23
Rheinmetall Automotive

Automotive with leading technology and market positions
     Key Figures                          Structure                                       Sales by region                            Sales by division
  Sales:                       €2.7 bn                                                              RoW                           Aftermarket
                                         Hardparts                                       ASIA
                                                                                                      3%
  EBIT:                        €223 m                                                           13%                                       11%
                                              Pistons       Large-bore Pistons                                     Europe                        33%     Hardparts
  EBIT margin:                   8.4%                                                        17%            47%       w/o
                                             Bearings           Castings             NAFTA                        Germany
  R&D:                          €74 m                                                           20%                                     56%

                                         Mechatronics                                     Germany
  Capex:                       €149 m                                                                                                  Mechatronics
                                                              Automotive
  Headcount:                   10.820    Pump Technology
                                                            Emission Systems
                                                                                         Sales by customer                          EBIT by division
                                                            Commercial Diesel                              >10% Ford, VW,        Aftermarket Other
                                          Solenoid Valves                             Other                     Renault/Nissan              -2%
                                                               Systems
                                                                                                                                         12%     26%
                                                                                                            34%                                          Hardparts
                                             Acuators                                         38%

                                         Aftermarket                                            8%     20%                                64%
                                                                                 2-3% DAF,                   4-6% GM, Fiat,
All figures refer to FY 2016                                                          Volvo, PSA                  Daimler, BMW          Mechatronics
  © Rheinmetall AG / Corporate Presentation Q3 2017                                                                                                        24
Rheinmetall Automotive
Growing and changing markets
Traditional drive technologies: Alternative drive technologies:
Optimization of combustion engines Hybrid
Electric vehicles
Global light vehicle production: Digitalization:
Rising number of vehicles Autonomous driving
Integrated data
Market growth
© Rheinmetall AG / Corporate Presentation Q3 2017 25Rheinmetall Automotive
Rising global light vehicle production
Light vehicle production 2016-2020 CAGR in % / in million units
Europa
Germany
NAFTA
Asia*
+1.3%
+1.2% -0.6%
+4.5%
Japan
+2.2%
China
Global
-0.5%
101
93 +2.7%
NAFTA 19
18
Europe 16 17
6 6
Germany
Asia 50 55
* without China und Japan
ROW
** without Deutschland
4 5 Source: IHS Automotive Feb 2017
2016 2020
© Rheinmetall AG / Corporate Presentation Q3 2017 26Rheinmetall Automotive
Governments will continue to demand reduction of CO2 emissions
CO2 emission in g/km
India 113
122
117
Europe 95 97
*Note that Japan has already exceeded its 2020 statutory target, as of 2013 Source: ICCT
© Rheinmetall AG / Corporate Presentation Q3 2017 27Rheinmetall Automotive
Electric drive will not replace combustion engines until 2025
Market share development
in % of total LV production
2016 Assumptions 2025
Total LV production 91m +2%* 110m
in units
1%
Electric vehicles 20% 25%
99%
80% -0.3%* 75% -1%*
Light vehicles:
combustion & hybrid
*ICE CAGR 2016-2025 Stable scenario Aggressive scenario
Source: IHS Automotive (September 2016), own estimates
© Rheinmetall AG / Corporate Presentation Q3 2017 28Rheinmetall Automotive
Rheinmetall Automotive is well-prepared for the challenges of tomorrow
Importance of internal combustion engines:
Basis for the majority of vehicles
For cars built with hybrid system technologies
For commercial and off-road vehicles (for the long-term)
Alternative drive systems:
Increasing share of hybrids, electric vehicles, and fuel-cell
Innovative solutions for future drive systems:
Demonstrator for electric drive and battery systems
Electrified pumps
E-engine housing and battery boxes
Thermal Management
Fuel-cell Components
© Rheinmetall AG / Corporate Presentation Q3 2017 29Rheinmetall Automotive
Strategic goals of Rheinmetall Automotive
Strategic goals
Increasing content per car Optimizing global footstep
More products at higher value as Further internationalization of our
emission reduction, hybridization and Mechatronics business
electrification will require innovative Continuously focus capacity
solutions management, especially in Hardparts
Gaining powertrain neutrality
Minimize dependence on certain types of drives
Increase “electrified products” to around 50% sales share by 2020
© Rheinmetall AG / Corporate Presentation Q3 2017 30Rheinmetall Automotive
Solutions for combustion engines to reduce NOx- and CO2- emissions
130 g 95 g
CO2/km CO2/km
2015 2020
Description vehicle model
(Basis)
1.4L 4-cylinder gasoline engine
with DI-injection and single- -2g CO2/km
stage turbocharging (115kW) -2 g CO2/km
-7 g CO2/km Light-weight
structural
El. low-press. parts
-3 g CO2/km
Var. valve train EGR
-3 g CO2/km
Var.
Rheinmetall Automotive: -1 g CO2/km
Tribo-system
cool. pump
Innovative products will lead to Variable oil
pump
higher value per car
© Rheinmetall AG / Corporate Presentation Q3 2017 31Rheinmetall Automotive
LV Diesel exposure limited; powertrain independence is the strategic target
Combined global engine production forecast* Automotive sales distribution by engine type**
100 30
LV Non Diesel units
25 Core Diesel
80
20 Others
60 LV Diesel share in % 7%
15 17%
40 Fuel
10
25% independent
20 LV Diesel units 5 products
0 0
2000 2005 2010 2015 2020 2025 36%
13%
Gasoline Truck
2%
Further regulatory pressure expected
Large-Bore
Next regulation deadline approaching in 2020
Pistons
Real driving emission(RDE) testing will create further Positive short term effect, driven by OEM’s effort to
pressure to reduce emissions by hardware installation reduce emissions and to avoid penalties
First city ban for diesel engines announced in Germany * IHS: Combined Engine Production Forecast April 2017
** Rheinmetall Automotive sales FY 2016
© Rheinmetall AG / Corporate Presentation Q3 2017 32Rheinmetall Automotive
Broad product range for alternative drive systems
Enlarging the traditional product portfolio for combustion engines …
+ … by products for hybrid and electric engines
Solenoid valves
Actuators Structural components
Electric throttle bodies Engine bearings Battery boxes
(as from 2018)
E-engine housing
(as from 2018)
Pistons
Electrical coolant pumps
EGR valves
Electrical vacuum
pumps
Engine blocks Electrical coolant
valve
Mechanical coolant Electrical oil pumps
pumps Oil pumps
Heat Pump Range Extender
(Predevelopment) (Predevelopment)
Hardparts products, non-shaded: Mechatronics
© Rheinmetall AG / Corporate Presentation Q3 2017 33Rheinmetall Automotive
E-mobility competence underlined by contracts and by initiatives for new solutions
Contract volume for electric vehicles (EV)* New products for the International Motor Show (IAA)
in Frankfurt, September 2017:
Product Volume Contract duration (Ø)
E-traction motor
Battery EV €~300 m 6 – 8 years
High voltage motor
(Plugin) Hybrid EV €~200 m 4 – 8 years
Designed for smaller sized vehicles,
but scalable in size
E-mobility competencies
Thermo-management, including pump and valve Modular battery pack
technology Underfloor design with advantages
Know-how in aluminum die-casting, e.g. for engine for weight and space distribution
housings and battery packs Aluminum structure, protected
Long term in-house e-motor competence with a composite-fiber structure
Well-established market access to OEMs developed by Rheinmetall Defence
* Rheinmetall Automotive and Joint Ventures
Integrated thermo-management
© Rheinmetall AG / Corporate Presentation Q3 2017 34Rheinmetall Automotive
Complexity of e-engines creates potential for further applications
Efficient
distribution of
heating and cooling
requires innovative
pump technology
Drive Unit Circuit
Thermal management
circuit – heating,
ventilation, interior
temperature control
© Rheinmetall AG / Corporate Presentation Q3 2017 35Rheinmetall Automotive
Automotive network in China - Mechatronics
Multi-channel approach of Mechatronics in China: Joint venture for the production of modules
for cooled exhaust-gas recirculation
New: Pierburg Yinlun Emission Technology (51%) • Headquarter: Shanghai region
• Customers: Chinese market
• Founded: December 2016
Pierburg China Ltd. (100%, founded 2009)
EGR Compact
EGR valve
Pierburg Huayu Pump Technology (50%, founded 2014) cooler
module
Pierburg Mikuni Pump Technology (51%, founded 2010 )
Mechatronics in China Partner: Zhejiang Yinlun Machinery Co.
Sales in EUR million EBIT in EUR million • Leading manufacturer of automobile radiators in
2016 106 China, renowned brand
8
• Production of heat exchangers and components
2015 72 2 for emission reduction
36
• Sales 2016: CNY3.2 bn* (~EUR400 m)
2014 -2
* Source: Bloomberg
© Rheinmetall AG / Corporate Presentation Q3 2017 36Rheinmetall Automotive
Summary:
Automotive is well prepared
Markets and Customers:
• We expect a stable market with moderate growth rates in the medium term
• China will be the growth driver; Europe and NAFTA might weaken
• Brazil seems to have left the worse behind
Performance and Products:
• Mechatronics will be the growth driver in the next years
• Hardparts will streamline the global footprint to optimize assets and cost structure
• Aftermarket will return to former profitability after ramp-up own production facilities
New Mobility Concepts:
• Hybrid cars and e-cars offer chances for new products and higher content per car
• Refocus of R&D spending to enlarge the product portfolio
• Product pipelines are filled for every type of power trains in the coming years
© Rheinmetall AG / Corporate Presentation Q3 2017 37Rheinmetall Defence Corporate presentation: Rheinmetall Defence © Rheinmetall AG / Corporate Presentation Q3 2017 38
Rheinmetall Defence

Defence is a leading supplier with an increasing international presence
   Key Figures                     Structure                                 Sales by region                      Sales by division
 Sales:               €2.9 bn   Weapon and Ammunition                             RoW                           Vehicle
                                                                                                  Germany       Systems                    Weapon and
                                    Weapon and           Protection                                                                        Ammunition
 EBIT:                €147 m                                                        16%
                                    Ammunition            Systems         NAFTA             26%
                                                                                  6%                                                 34%
                                     Propulsion                                                                      43%
 EBIT margin:           4.9%
                                      Systems
                                                                                             16%
 R&D:                 €184 m                                                        36%
                                                                           AMEA                    Europe                      23%
                                Electronic Solutions
 Capex:                €95 m                                                                                        Electronic Solutions
                                   Air Defence &         Mission
 Headcount:           10,002       Radar Systems        Equipment           Order backlog by division             EBIT by division
                                   Simulation and        Technical                                                          Other
                                      Training          Publications      Vehicle                 Weapon and   Vehicle                 Weapon and
                                                                          Systems                 Ammunition   Systems                 Ammunition
                                                                                                                          -10%
                                                                                            26%
                                                                                            34%                        20%
                                Vehicle Systems
                                                                                  51%
                                                                                                                      17%            73%
                                  Logistic Vehicles   Tactical Vehicles                     23%
                                                                                    8%    20%   Electronic
                                                                                                 Solutions     Electronic
                                                                                                               Solutions
 © Rheinmetall AG / Corporate Presentation Q3 2017                                                                                              39
Rheinmetall Defence
Growing and changing markets
Change of international Rising defence/
responsibilities security budgets
Increasing number of conflicts Global security
combined with new threats environment changing
Market growth
© Rheinmetall AG / Corporate Presentation Q3 2017 40Rheinmetall Defence
Deterioration of global security triggers higher defence spending
UN Peacekeeping
Mission
5%
Open conflict
High tension
* Regional average based on IHS Janes
IS Terror May 2017
© Rheinmetall AG / Corporate Presentation Q3 2017 41Rheinmetall Defence
EU member states en route to comply with NATO 2% target
Europe: Defence budget development in % 2017e* NATO equipment expenditure in % of total expenditure *
30%
60.00% NATO Goal Germany NATO Europe NATO North America
50.00%
40.00%
30.00%
20%
20.00%
10.00%
0.00%
-10.00% 10%
Denmark
France
Spain
Turkey
Hungary
Poland
Germany
Norway
Italy
Romania
Latvia
Croatia
Lithuania
Albania
Czech Republic
Slovak Republic
Slovenia
Estonia
UK
Netherlands
Belgium
Montenegro
Luxembourg
Portugal
Bulgaria
Greece
2010 2011 2012 2013 2014 2015 2016 2017e
* NATO 06/2017: Equipment expenditure as a share of defence expenditure based on
2010 prices and currencies
© Rheinmetall AG / Corporate Presentation Q3 2017 42Rheinmetall Defence
GLOBAL
+1,3%
Defence is at the beginning of long lasting market growth
Defence budgets development 2016 – 2020 in % p.a.
Europe
North America
+1.2%
+
MENA
Asia/Pacific
+3.0%
+4.0%
Latin America
Global
+2.7% +1.3%
Global military expenditures
in bn USD
2016: 1,563 2020: 1,649
Source: IHS Janes March2017
© Rheinmetall AG / Corporate Presentation Q3 2017 43Rheinmetall Defence
Germany is one of 22 NATO states increasing defence budgets
Enhanced future profile of German Bundeswehr German defence budget 2016-2021 in EUR billion*
“Anchor army” for smaller neighbors
Leading role in the “enhanced Forward 62
23% 2%
Presence” in Lithuania
40 41 42
34 37 39
Framework nation in the “Very High Readiness 1.2%
Joint Task Force” as of 2019
Increasing number of international mandates,
e.g. Mali 2016 2017 2018 2019 2020 2021 2% NATO target
on estimated
German 2016
GDP of €3.1tr
© Rheinmetall AG / Corporate Presentation Q3 2017 44Rheinmetall Defence
Strategic goals of Rheinmetall Defence
Strategic goals
Benefiting from home markets Enlarging internationalization
Business opportunities by increasing Form partnerships with local suppliers to
budgets in Germany and neighboring provide local content
countries
Entering new markets Creating innovations
Strategic partnerships to gain Armored vehicles and their weapons
access to new markets New technologies, e.g. laser technology
Target markets close to traditional IT-based networking
markets, e.g. public security
© Rheinmetall AG / Corporate Presentation Q3 2017 45Rheinmetall Defence
Down-selection in major programs
Germany: Scandinavia:
Canada: Military trucks Military trucks
Modernization: Leopard
Netherlands: Poland: Lithuania:
Boxer Modernization program Boxer
UK: Romania:
Challenger life extension; Wheeled vehicles
MIV Boxer
Singapore: Indonesia:
Military trucks Upgrade Leopard/Marder
Peru:
Military trucks
Australia: Australia:
Land 121 Land 400
Booked
Down-selected
© Rheinmetall AG / Corporate Presentation Q3 2017 46Rheinmetall Defence
Strategic partnerships create business potential for Weapon and Ammunition
United Kingdom
United States, Defense Munitions International (DMI) Partnering agreements with Defence Equipment and
50:50-JV with General Dynamics Ordnance and Support (DE&S) and with BAE Systems
Tactical Systems
Netherlands
New: United States RDZM Partnering agreement
50:50-JV with Day & Zimmermann (RDZM)
State-of-the-art ammunition for the US market
New: Germany
Partnering agreement with German government on
a regular supply of large- and medium-ammunition
© Rheinmetall AG / Corporate Presentation Q3 2017 47Rheinmetall Defence
Various opportunities in Australia
AUSTRALIA
Australian Defence Programs Investments and possible CAPEX
Land 121 5b (Australian trucks) Equity investment in Supashock
Customer is finalizing vehicle specifications Acquisition of 49% equity stake in Supashock
New offer under preparation Target: Integration of Australian technology in
Tender process design not yet decided tactical and logistical vehicles
Land 400 (Australian Boxer) Queensland selected as industrial base
Trials completed to our full satisfaction Subject to acquisition of the Land 400 order,
Best and final offer to be presented in August Rheinmetall and Queensland agreed on joint
investment approach
Decision expected H1 2018
Potential creation of 400-500 jobs
© Rheinmetall AG / Corporate Presentation Q3 2017 48Rheinmetall Defence
Rheinmetall integrates components to systems
Battle MoTaKo
Management
Network
Network-
capability
Air
Combined Systems Defence
System house
Armored Infantryman
Digitization
HX Lynx Gladius
Systems / Platforms
Integration
Key Components Lance
Ammunition Weapon Laser opto-sensoric turret
Innovation &
Manufacturing
Excellence
© Rheinmetall AG / Corporate Presentation Q3 2017 49Rheinmetall Defence
Three major partnering agreements mark next step for potential growth
Bid for the planned rifle Potential areas of cooperation: Future digital communication
procurement of the Bundeswehr Air defence (Patriot-replacement) and battle management system
Plan: Technology partnership Weapon & Munition of the German ground forces:
Objective with 60% value creation in Combat vehicles MoTaKo
Germany Training MoTIV
Cyber security
Cooperation agreement Signing of “Strategic collaboration Joint Venture agreement
Status January 2017 agreement“ end of June with August 2017
defined work share*
Exclusivity for German market
Trials have started after Further work groups assess Invite additional partners
submission of documents for additional fields of collaboration
Update special forces tender
*Tactical air defence systems
Tender for general assault and close /close-by range ballistic systems
rifle still open
© Rheinmetall AG / Corporate Presentation Q3 2017 50Appendix Rheinmetall Group Corporate Presentation: Appendix © Rheinmetall AG / Corporate Presentation Q3 2017 51
Appendix Rheinmetall Group

Selected key data: outlook 2017

 Rheinmetall Group                                                         Automotive       Defence

Holding cost                                   ~€20 – 25 m   Capex*         ~5.5 - 6.5%      ~3 - 4%

Tax rate                                             ~30%    D & A*         ~4.5 - 5.5%     ~3 - 3.5%

                                                             R & D*               ~4 - 6%    ~2 - 3%

Financing:              Bond €500 m (5.25% coupon) redeemed in September 2017
                        EIB loan €250 m (0.962% coupon) maturing in August 2023
Rating:                 Ba1 (positive outlook) Moody’s

                                                                                                  * as percentage of sales

 © Rheinmetall AG / Corporate Presentation Q3 2017                                                                     52
Appendix Rheinmetall Group
Group 2012 – 2016: Key figures
in EUR million 2012 2013 2014 2015 2016
Balance sheet Total assets 4,899 4,866 5,271 5,730 6,124
Shareholder‘s equity 1,465 1,339 1,197 1,562 1,781
Equity ratio (in %) 29.9 27.5 22.7 27.3 29.0
Pension liabilities 919 891 1,121 1,128 1,186
Net financial debt 98 147 330 81 -19
Net gearing (in %) 6.7 11.0 27.6 5.2 1.1
Income statement Sales 4,704 4,417 4,688 5,183 5,602
Operating result 268 211 160 287 353
Operating margin (in %) 5.7 4.8 3.4 5.5 6.3
EBITDA 490 315 299 490 581
EBIT 296 121 102 287 353
EBIT margin (in %) 6.3 2.7 2.2 5.5 6.3
EBT 216 45 22 221 299
Net income after minorities 173 29 18 151 200
Earnings per share (in EUR) 4.55 0.75 0.47 3.88 4.69
Dividend per share (in EUR) 1.80 0.40 0.30 1.10 1.45
ROCE (in %) 11.5 4.7 3.9 10.1 12.3
Cash flow statement Free cash flow from operations 125 20 -182 29 161
Headcount Employees (Dec 31) according to capacity 21,767 20,264 20,166 20,676 20,993
2013 figures adjusted according to IFRS 5 (Discontinued Operations) with regard to the formation of the ATAG JV and according to IFRS 11 (Joint Arrangements)
© Rheinmetall AG / Corporate Presentation Q3 2017 53Appendix Rheinmetall Group
Segments 2012 – 2016 Key figures
AUTOMOTIVE DEFENCE
2012 2013 2014 2015 2016 in EUR million 2012 2013 2014 2015 2016
2,378 2,270 2,466 2,621 2,670 Order intake 2,933 3,339 2,812 2,693 3,050
418 392 416 445 459 Order backlog (Dec. 31) 4,987 6,050 6,516 6,422 6,656
2,369 2,262 2,448 2,592 2,656 Sales 2,335 2,155 2,240 2,591 2,946
139 158 184 216 223 Operating result 146 60 -9 90 147
5.9 7.0 7.5 8.3 8.4 Operating margin (in %) 6.3 2.8 -0.4 3.5 5.0
243 225 295 332 356 EBITDA 262 96 17 175 239
139 124 184 216 223 EBIT 173 4 -67 90 147
5.9 5.5 7.5 8.3 8.4 EBIT margin (in %) 7.4 0.2 -3.0 3.5 5.0
148 142 158 167 174 Capex 90 62 76 96 95
12,003 10,927 10,830 10,934 10,820 Employees (Dec 31) according to capacity 9,623 9,193 9,184 9,581 10,002
1,091 1,171 1,322 1,450 1,527 Mechatronics Sales Weapon & 1,136 1,027 977 881 1,112
69 66 96 119 142 EBIT Ammunition* 102 31 -4 74 108
6.3 5.6 7.3 8.1 9.3 EBIT margin 9.0 3.0 -0.4 8.4 9.7
1,087 889 934 952 921 Hardparts Sales Electronic 748 710 705 759 745
57 27 72 73 62 EBIT Solutions 97 11 -53 26 25
5.2 3.0 7.7 7.7 6.7 EBIT margin 13.0 1.5 -7.5 3.4 3.4
265 268 269 285 305 Aftermarket Sales Vehicle 567 539 667 1,195 1,392
25 27 26 27 27 EBIT Systems** -25 -35 -9 3 29
9.4 10.1 9.7 9.5 8.9 EBIT margin -4.4 -6.5 -1.4 0.3 2.1
2013 figures adjusted according to IFRS 5 (Discontinued Operations) with regard to the formation of the ATAG JV and according to IFRS 11 (Joint Arrangements)
* Combat Platforms until 2014 54
© Rheinmetall AG / Corporate Presentation Q3 2017
**Wheeled Vehicles until 2014Rheinmetall Group
Income statement Group
In EUR million Income Statement
Q3 '16 Q3 '17 Δ Q3 '16 Q3 '17 Δ
Total operating performance 1,385 1,407 22 Net operating income (EBIT) 79 75 -4
Net interest income 1 3 2
Interest expenses - 15 - 13 2
Other operating income 26 19 -7 Earnings before tax (EBT) 65 65 0
Cost of materials 774 730 -44 Income tax - 19 - 22 -3
Personnel expenses 346 384 38 Net income 46 43 -3
Amortization, depreciation and impairment
52 59 7 of which:
Other operating expenses 164 179 15 Minority interest 4 7 3
Income from companies carried at equity6 7 1 Rheinmetall shareholders 42 36 -6
Other financial results -2 -6 -4
Net operating income 79 75 -4 EBITDA 131 134 3
© Rheinmetall AG / Corporate Presentation Q3 2017 55Rheinmetall Group
Cash flow statement Group
In EUR million Cash Flow Statement
9m 2016 9m 2017 Δ 9m 2016 9m 2017 Δ
Net Income 99 122 23 Capital payment to/ capital contribution by non-controlling interests-8 -10 -2
Amortization, depreciation and impairment 161 171 10 Increase in shares in consolidated subsidiaries 0 0 0
Dotation of CTA -30 -30 0 Dividends paid out bei RHM AG -47 -62 -15
Changes in pension provisions 1 -6 -7 Capital contributions by non-controlling interests 0 4 4
Income from disposal of non-current assets 0 0 0 Shares issued 4 4 0
Changes in other provisions 43 80 37 Borrowing of financial debts 69 401 332
Changes in inventories -174 -142 32 Repayment of financial debts -53 -537 -484
Changes in receivables, liabilities(w/o Cash flow from financing activities -35 -200 -165
financial debts) -217 -201 16
and prepaid & deferred items
Pro rata income from investmenst carried at equity -18 -12 6 Changes in financial resources -382 -232 150
Dividends received from investments carried at equity 8 3 -5 Changes in cash and cash equivalents due to exchange rates 0 -14 -14
Other non-cash expenses and income -1 -5 -4 Total change in financial resources -382 -246 136
Cash flows from operating activities -128 -20 108 Opening cash and cash equivalents January 1 691 616 -75
Investments in assets -174 -155 19 Closing cash and cash equivalents September 30 309 370 61
Cash receipts from the disposal of assets 1 2 1
Payments for the purchase of liquid financial assets -152 -213 -61
Cash receipts from the disposal of liquid financial assets 117 363 246
Investments in consolidated companies and other financial assets -13 0 13
Payments for investments in consolidated companies and other financial assets 2 -9 -11
Cash flow from investing activities -219 -12 207
© Rheinmetall AG / Corporate Presentation Q3 2017 56Rheinmetall Group
Balance Sheet Group
In EUR million Balance Sheet
31.12.'16 30.09.'17 Δ 31.12.'16 30.09.'17 Δ
Non-current assets 2,762 2,715 -47 Equity 1,781 1,811 30
Intangible assets 819 798 -21 Share capital 112 112 0
Property, plant and equipment 1,378 1,340 -38 Additional paid-in capital 532 540 8
Investment property 53 55 2 Retained earnings 1074 1082 8
Investments carried at equity 240 249 9 Treasury shares -32 -25 7
Other non-current assets 36 52 16 Rheinmetall AG shareholders' equity 1686 1709 23
Deferred tax assets 236 221 -15 Minorities 95 102 7
Current assets 3,388 3,210 -178 Non-current liabilities 1,629 1,948 319
Inventories (net) 1,098 1,218 120 Provision for Pensions and similar obligatinos 1186 1104 -82
Trade receivables 1,306 1,353 47 Other provisions 135 170 35
Other financial assets 43 41 -2 Financial debts 220 584 364
Other receivables and assets 125 142 17 Other liabilities 56 70 14
Income tax receivables 10 46 36 Deferred tax liabilities 32 20 -12
Cash and cash equivalents 806 410 -396
Current liabilities 2,740 2,166 -574
Other provisions 516 551 35
Financial debts 567 68 -499
Trade liabilities 766 791 25
Other liabilities 838 650 -188
Income tax liability 53 106 53
Total assets 6,150 5,925 -225 Total liabilies 6,150 5,925 -225
© Rheinmetall AG / Corporate Presentation Q3 2017 57Rheinmetall Group
Quarterly development Group
Sales Operational results
in EUR million in EUR million
1,698 171
1,459
1,349 1,366
1,305
1,034 115
612 731 95 97
682
662
79
45 46
30 50
664 737 728 684
643 60 62 57
51 56
-2 -4 -10 -6 -6
Q3 2016 Q4 2016 Q1 2017 Q2 2017 Q3 2017 -2
Q3 2016 Q4 2016 Q1 2017 Q2 2017 Q3 2017
Defence Automotive Consolidation/Others
© Rheinmetall AG / Corporate Presentation Q3 2017 58Rheinmetall Group
Cash Flow Statement Group
Q3 9m Q4 Q1 Q2 Q3 9m Δ Q3 Δ 9m
in EUR million
2016 2016 2016 2017 2017 2017 2017 2016/2017 2016/2017
Group Net Income 46 99 116 28 51 43 122 -3 23
Amortization / depreciation 52 161 67 57 55 59 171 7 10
Change in pension accruals - -14 - -34 -3 1 -36 1 -22
Cash Flow 98 246 183 51 103 103 257 5 11
Changes in working capital and other items -1 -374 389 -207 -34 -36 -277 -35 97
Net cash used in operating activities 98 -128 572 -156 69 67 -20 -31 108
Cash outflow for additions to tangible
-62 -174 -109 -43 -50 -62 -155 - 19
and intangible assets
Free Cash Flow from Operations 36 -302 463 -199 19 5 -175 -31 127
© Rheinmetall AG / Corporate Presentation Q3 2017 59Appendix Rheinmetall Group
Equity and pension liabilities
Financial solidity materially improved
Drivers Equity and Equity ratio
EUR m %
1,500 40%
29% 31%
28% 27% 29%
30%
1,000 23%
Confidence increased by delivery on our targets 20%
500
Capitalizing on our restructuring efforts 10%
0 0%
Achievement of a solid equity ratio 2013 2014 2015 2016 H1 2017 9m 2017
Pension stabilized on further CTA funding Equity Equity Ratio
Pension liabilities and German discount rate
Supportive market environment in both segments EUR m
%
1,500 4%
3.3%
1,000 3%
2.0% 2.2%
2.0%
1.8% 2.0%
Credit rating Ba1 with 500 2%
outlook positive since August 2017 0 1%
2013 2014 2015 2016 H1 2017 9m 2017
Pension German discount rate
© Rheinmetall AG / Corporate Presentation Q3 2017 60Appendix Rheinmetall Group
Net-financial debt considerably improved on positive cash development
Net-financial debt Debt composition and maturity profile of instruments
in EUR million at quarter end in EUR million
652
-19 20 Other & Leasing 2017 2018 2019 2020 2021 2022 2023ff
139 29
Bank loan
35
81 58
182
122
245 242 243 Promissory notes 250
330
362
EIB Loan 279
445 250
485 -46%
12/14 12/15 3/16 6/16 9/16 12/16 03/17 06/17 09/17 09/17
© Rheinmetall AG / Corporate Presentation Q3 2017 61Appendix Rheinmetall Group
Moderate headcount increase to accompany growth
Headcount per segment Headcount per region
in capacities at year end in capacities at year end
1.5%
20,676 20,993
20,166 RoW
Mexico 7%
4%
10,934 10,820 15%
10,830 Brazil
5%
Americas
5% Asia 48% Germany
Europe
9,184 9,581 10,002
73%
152 161 171
2014 2015 2016
Automotive Defence Group
© Rheinmetall AG / Corporate Presentation Q3 2017 62Appendix Rheinmetall Group
First orders for public security and e-mobility
Public Security Electromobility
Survivor vehicles Pump technology for
for German police forces electric vehicles
Drone detection systems Aluminum battery boxes
for Swiss prisons for German premium OEM
Innovative body armor Electric engine housing
for German police forces in for German premium OEM
several states to serve the Chinese market
© Rheinmetall AG / Corporate Presentation Q3 2017 63Rheinmetall Group
Quarterly development Automotive
Sales by division Operational results by division
in EUR million in EUR million
737 728 67
684
664 62
643 60
57
51
425 407
380 382 47
355 35 43
40
35
249 251 232 22
225 222 16
11 17 13
82 85 83 93 95 9 8 7 9 9
-19 -23 -20 -23 -25 -4 -5 -5 -5 -5
Q3 2016 Q4 2016 Q1 2017 Q2 2017 Q3 2017 Q3 2016 Q4 2016 Q1 2017 Q2 2017 Q3 2017
Mechatronics Hardparts Aftermarket Consolidation/Others
© Rheinmetall AG / Corporate Presentation Q3 2017 64Rheinmetall Group
Cash flow statement Automotive
Q3 9m Q4 Q1 Q2 Q3 9m Δ Q3 Δ 9m
in EUR million
2016 2016 2016 2017 2017 2017 2017 '16/'17 '16/'17
Net income 36 116 49 46 50 25 121 -11 5
Amortization / depreciation 29 93 40 32 32 37 101 8 8
Change in pension accruals -1 -1 -1 - - - - 1 1
Cash Flow 64 208 88 78 82 62 222 -2 14
Changes in working capital and other items 18 -146 129 -172 20 61 -91 43 55
Net cash used in operating activities 82 62 217 -94 102 123 131 41 69
Cash outflow for additions to tangible
-35 -103 -71 -24 -33 -42 -99 -7 4
and intangible assets
Free cash flow from operations 47 -41 146 -118 69 81 32 34 73
© Rheinmetall AG / Corporate Presentation Q3 2017 65Appendix Rheinmetall Automotive
Automotive in China
50/50 joint ventures Wholly Foreign-Owned Enterprises JV subsidiary
with HASCO (SAIC group) (100% Rheinmetall Automotive)
Castings (ATAG) Pistons (KSSP) Castings (KPSNC) Pumps (PHP) Aftermarket Pierburg Large-bore pistons Pumps (PMP Ch.)
2014 1997 2001 2012 2008 2009 2013 2012
Engine blocks and Pistons Engine blocks, cylinder Electrical and Spare parts EGR modules and electric Large-bore pistons Electrical and
structural body parts heads and structural mechanical pumps throttle bodies mechanical pumps
body parts
Germany/
Europe China China China
Sales China in EUR m EBIT China in EUR m
+7% WFOEs +34%
86 109 9
53 JVs 1 4
29 (100%)
8 13 628 785 825 52 49 62
388 499 0 31 39
298 22
-5
2011 2012 2013 2014 2015 2016 2018e -1
2011 2012 2013 2014 2015 2016 2018e
© Rheinmetall AG / Corporate Presentation Q3 2017 66Appendix Rheinmetall Automotive
Electrification and downsizing require more sophisticated products
Coolant pump Exhaust gas recirculation
Valve, cooler, bypass and
Mechanical
>6x Electrical Valve
>3x bypass actuator
Oil pump Piston
Mechanical
>3x Variable Aluminum
>3x Steel
© Rheinmetall AG / Corporate Presentation Q3 2017 67Rheinmetall Group
Quarterly development Defence
Sales by division Operational earnings by division
in EUR million in EUR million
115
1,034
63
391
46
662 731 682
613 25
227 305 248 30
244 191 28
24
172 138 165
141 25 12
483 30 6
361 351 337 370
5 14 13
4 0
1
-98 -84 -67 -52 -101 -4 -3 -4 -1 -1 -1
-7
Q3 2016 Q4 2016 Q1 2017 Q2 2017 Q3 2017
-10
Weapon & Ammunition Vehicle Systems
Q3 2016 Q4 2016 Q1 2017 Q2 2017 Q3 2017
Electronic Solutions Consolidation/Others
© Rheinmetall AG / Corporate Presentation Q3 2017 68Rheinmetall Group
Cash flow statement Defence
Q3 9m Q4 Q1 Q2 Q3 9m Δ Q3 Δ 9m
in EUR million
2016 2016 2016 2017 2017 2017 2017 '16/'17 '16/'17
Net income 13 -4 78 -16 8 32 24 19 28
Amortization / depreciation 22 66 26 24 22 21 67 -1 1
Change in pension accruals 1 4 1 -3 -6 2 -7 1 -11
Cash Flow 36 66 105 5 24 55 84 19 18
Changes in working capital and other items -8 -221 248 -61 -38 -88 -187 -80 34
Net cash used in operating activities 28 -155 353 -56 -14 -33 -103 -61 52
Cash outflow for additions to tangible
-23 -61 -34 -16 -19 -19 -54 4 7
and intangible assets
Free cash flow from operations 5 -216 319 -72 -33 -52 -157 -57 59
© Rheinmetall AG / Corporate Presentation Q3 2017 69Appendix Rheinmetall Defence
Defence industry in Europe
Governmental shareholding restricts room
for cross-border consolidation
Big common armament programs as
Nammo Patria catalyst for further consolidation are not
Saab at European mid-term horizon
Cobham
BAE Systems Chemring Rheinmetall CH PL TUR RO
Rheinmetall’s approach:
Airbus
KMW/Nexter
Thales RUAG
JV partnerships with companies in different
DCNS Oto Melara nations instead of “putting all eggs in one basket”
DCI
Aselsan
Sufficient organic growth potential, but
suitable M&A transactions are possible
>25% state-ownedRheinmetall Automotive Management Structure © Rheinmetall AG / Corporate Presentation Q3 2017 71
Rheinmetall Group

Next events and IR contacts
     Events 2017                                                                     IR Contacts
     Q3 Earnings call                                                    7 Nov
                                                                                   Franz-Bernd Reich
     Capital Markets Day 2017                        Bremen        21 – 22 Nov     Head of IR
     Berenberg Conference                            Pennyhill       4 – 5 Dec     Tel: +49-211 473-4718
                                                                                   Email: franz-bernd.reich@rheinmetall.com
                                                                                   Dirk Winkels
                                                                                   Senior Investor Relations Manager
     Events 2018                                                                   Tel: +49-211 473-4749
                                                                                   Email: dirk.winkels@rheinmetall.com
     Commerzbank Conference                          New York        8 – 10 Jan
                                                                                   Rosalinde Schulte
     Kepler Cheuvreux Conference                     Frankfurt      15– 16 Jan     Investor Relations Assistant
                                                                                   Tel: +49-211 473-4718
                                                                                   Email: rosalinde.schulte@rheinmetall.com
     Quick link to documents
       Corporate Presentation                                    Interim Reports                       Annual Reports

 © Rheinmetall AG / Corporate Presentation Q3 2017                                                                            72
Rheinmetall Group Disclaimer This presentation contains “forward-looking statements” within the meaning of the US Private Securities Litigation Reform Act of 1995 with respect to Rheinmetall’s financial condition, results of operations and businesses and certain of Rheinmetall’s plans and objectives. These forward-looking statements reflect the current views of Rheinmetall’s management with respect to future events. In particular, such forward-looking statements include the financial guidance contained in the outlook for 2017. Forward-looking statements are sometimes, but not always, identified by their use of a date in the future or such words as “will”, “anticipates”, “aims”, “could”, “may”, “should”, “expects”, “believes”, “intends”, “plans” or “targets”. By their nature, forward-looking statements are inherently predictive, speculative and involve risk and uncertainty because they relate to events and depend on circumstances that will occur in the future. There are a number of factors that could cause actual results and developments to differ materially from those expressed or implied by these forward-looking statements. In particular, such factors may have a material adverse effect on the costs and revenue development of Rheinmetall. Further, the economic downturn in Rheinmetall’s markets, and changes in interest and currency exchange rates, may also have an impact on Rheinmetall’s business development and the availability of financing on favorable conditions. The factors that could affect Rheinmetall’s future financial results are discussed more fully in Rheinmetall’s most recent annual and quarterly reports which can be found on its website at www.rheinmetall.com. All written or oral forward-looking statements attributable to Rheinmetall or any group company of Rheinmetall or any persons acting on their behalf contained in or made in connection with this presentation are expressly qualified in their entirety by factors of the kind referred to above. No assurances can be given that the forward-looking statements in this presentation will be realized. Except as otherwise stated herein and as may be required to comply with applicable law and regulations, Rheinmetall does not intend to update these forward-looking statements and does not undertake any obligation to do so. This presentation does not constitute an offering of securities or otherwise constitute an invitation or inducement to any person to underwrite, subscribe for or otherwise acquire or dispose of securities in Rheinmetall AG or any of its direct or indirect subsidiaries. 171107 Corporate Presentation Q3 © Rheinmetall AG / Corporate Presentation Q3 2017 73
© Rheinmetall AG / Corporate Presentation Q3 2017 74
You can also read