ELECTRICITY PRICING METHODOLOGY - 1 APRIL 2020 - 31 MARCH 2021 - Powerco
←
→
Page content transcription
If your browser does not render page correctly, please read the page content below
ELECTRICITY PRICING
                      METHODOLOGY

     1 APRIL 2020 – 31 MARCH 2021

Powerco Limited | Electricity Pricing Methodology 1 April 2020-31 March 2021   1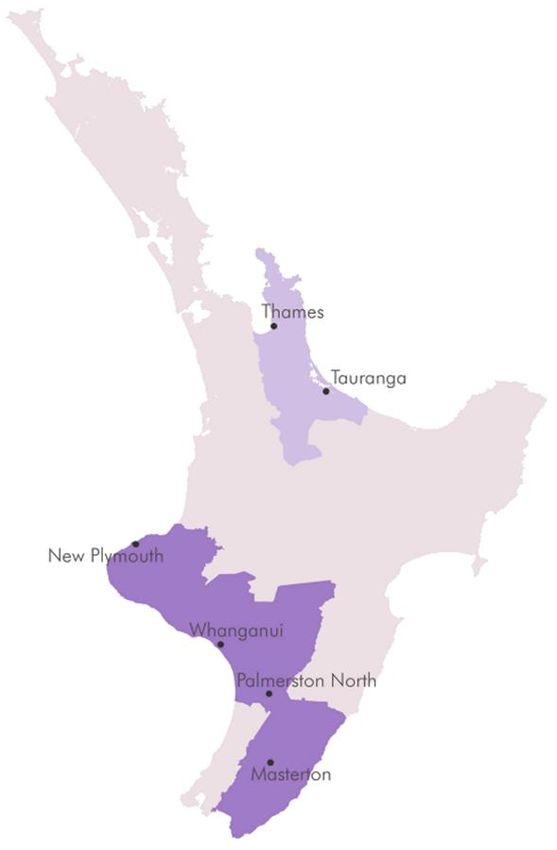
CONTENTS

1.        About Powerco .......................................................................................................... 3

2.        Helping you understand how we set electricity prices ................................................ 4

3.        Current pricing approach and plans to evolve our pricing .......................................... 8

4.        Changes to our pricing approach and prices in 2020-21 .......................................... 13

5.        How prices are set for each customer group ............................................................ 16

6.        How we group customers ........................................................................................ 21

7.        Calculating and allocating costs across customer groups ........................................ 26

8.        Assessing customer impacts and preferences ......................................................... 30

9.        Alignment with Electricity Authority Pricing Principles .............................................. 33

10.       How we meet the Commerce Commission Information Disclosure requirements ..... 35

11.       Directors’ certification .............................................................................................. 37

Definitions ........................................................................................................................... 38

Appendix A: Allocation of costs across customer groups and price zones........................... 42

 Powerco Limited | Electricity Pricing Methodology 1 April 2020-31 March 2021                                                          2
1.       ABOUT POWERCO

  Powerco’s electricity network supplies electricity to about 340,000 customer connections
  across two regions of the North Island. In terms of both supply area and network length, our
  network is the largest of any single distributor in New Zealand. The two network regions are
  referred to as Eastern (Valley and Tauranga) and Western (Taranaki, Whanganui,
  Manawatu and Wairarapa). Both regions contain a mix of urban and rural areas.

                Figure 1 Powerco's Eastern and Western network regions and key statistics 1

                                                                             Eastern region
                                                                             160,655 connections
                                                                             10,699 km of line/cable
                                                                             2,762 GWh of energy conveyed

Western region
179,724 connections
17,623 km of line/cable
2,402 GWh of energy conveyed

  1   As at 31 March 2019.

      Powerco Limited | Electricity Pricing Methodology 1 April 2020-31 March 2021                          3
2. HELPING YOU UNDERSTAND HOW WE SET ELECTRICITY PRICES
The purpose of this document is to help you understand how Powerco sets prices for its
electricity distribution services. It demonstrates to customers and interested people how our
electricity pricing methodology (our approach) recovers the costs of supplying distribution
services in an efficient and fair way.
• Section 2 (this section) describes the role of distribution pricing and the main factors we
consider when developing prices
• Section 3: our current pricing approach and plans to evolve it
• Section 4: changes to our pricing approach and prices in 2020-21
• Section 5: how standard and non-standard prices are set
• Section 6: the customer groups we use
• Section 7: how we calculate and allocate costs across customer groups
• Section 8: how we assess the customer impact of price changes
• Section 9: how the pricing approach and prices align with the Electricity Authority pricing
principles
• Section 10: compliance obligations
WE SET PRICES TO RECOVER COSTS AND HELP CUSTOMERS MAKE
DECISIONS ABOUT USING OUR NETWORK
We set prices to recover the cost of supplying electricity distribution services to each
customer or group of customers connected to our network. For many customers, our prices
are part of one of several components of a retail bill. Retailers package our prices in different
ways, which can impact on the degree you can ‘see’ our prices.
The distribution services we supply are:
• Access to the network. Customers take electricity to power their homes and businesses
or to inject electricity they generate
• New connections or reduced/expanded capacity. New customers wanting access or the
ability to take or inject more/less electricity than they currently do.
The Commerce Commission regulates and sets the revenue (which sets the ‘cost’) we can
recover through our prices in each year. These regulations also require us to include other
costs in our prices, such as transmission prices and regulatory levies.
Our approach to setting prices can inform customer decisions about connecting to, and
using, our network by signalling the cost of supply. These costs are affected by a range of
factors influencing the network infrastructure required to supply the distribution service. We
want our prices to reflect these costs so we can plan and operate our network assets
efficiently, reliably, and safely.
We review our pricing approach annually (at a minimum) so prices give customers the best
possible information about the costs of supplying them. This is increasingly important as
Powerco Limited | Electricity Pricing Methodology 1 April 2020-31 March 2021 4customers and their agents use our network in new ways by adopting technology and
services like solar panels, electric vehicles, electric heating and cooling, and energy
management systems.
FACTORS WHICH INFLUENCE OUR PRICING APPROACH AND PRICES
The factors which influence our pricing approach and pricing can be grouped into three
areas:
• Customer characteristics including consumption patterns at different locations, uptake
of solar panels, electric vehicles, energy efficient devices
• Network characteristics including topography, growth, system reliability and security,
customer density, network use, data availability
• Regulatory requirements for example requirements imposed by legislation about the
structure of prices
Customer characteristics
Customer characteristics such as load profiles and connection type affect the cost of
supplying the distribution service. Our pricing approach considers the following
characteristics:
• Load profiles: Your electricity consumption can vary across the day and year for a
range of reasons eg weather or lifestyle. We allocate costs based on consumption
profiles because it is the most important driver of fixed cost investment in network
infrastructure.
• Connection type / network use / capacity requirements: A higher capacity connection
typically requires more assets and therefore higher fixed costs. For example, a new dairy
connection may need a dedicated transformer which cannot be utilised by other
customers.
• Location: Customers in the Eastern and Western regions are supplied using separate
networks with their own cost characteristics. Another key factor is the relevant Grid Exit
Point connecting our network to the national transmission grid, because this impacts the
Transpower’s charges which we reflect in our prices.
• Density: Customer density2 varies across the network and impacts on cost allocation.
For example, the cost of supplying distribution services can be higher in lower density
areas (typically rural areas) because the costs are shared across fewer customers.
• Emerging customer preferences and technology choices: Customer uptake of new
technology offerings such as solar panels and battery storage are changing in the way
energy markets operate. Distributors play a key role in facilitating these changes. We try
to keep our prices technology-neutral, so the pricing is aligned with the impact on
network costs.
2
A measure of customer density is the number of customers per km of network length.
Powerco Limited | Electricity Pricing Methodology 1 April 2020-31 March 2021 5Network characteristics
Powerco operates around 28,000 km of electricity distribution network across the North
Island of New Zealand. Our network is split into two regions, with the Eastern region
covering Tauranga and Thames Valley and the Western region spanning across Taranaki,
Manawatu, and the Wairarapa. These regions contain a range of urban and rural areas.
Differences in the network requirements, population and load characteristics mean the cost
of supply varies between and within our network regions.
Our regions have been experiencing sustained population and economic growth in recent
years and, as a result, we have experienced strong demand growth across parts of our
networks. Some specific areas of growth include:
• Bay of Plenty – population growth and horticulture processing volumes
• Taranaki – population growth and dairy intensification
• Other regions – population growth and changing land-use patterns
Because of this we are investing in our network to support residential and industrial growth
while addressing security and reliability needs. More detail of our investment plans and day
to day asset management priorities across out network regions is in our Asset Management
Plan, available at https://www.powerco.co.nz/Publications/Disclosures/Electricity/.
Regulatory requirements
Our pricing approach is influenced by a range of regulatory requirements from Government,
the Commerce Commission and the Electricity Authority. The main obligations are:
• Setting prices over 2019-2023 to recover the allowable revenue the Commerce
Commission approved for Powerco so we can invest in our network to improve reliability
and quality of supply. Sections 5-7 describe how we do this.
• Setting prices for distributed generation connected to and using our network according to
Part 6 of the Electricity Industry Participation Code 2010, relating to the pricing of
distributed generation. Section 5, and our Distributed Generation Policy, describe how
we do this.
• Setting efficient and cost-reflective prices consistent with the Electricity Authority’s
Distribution Pricing Principles of August 2019.3 Section 9 describes how our pricing
approach aligns with these.
• Disclosing information about our pricing approach, and price–setting for the year ahead
by the Commerce Commission’s Electricity Distribution Information Disclosure4 and CPP
requirements. Section 10 describes how we meet these, along with information on our
website at: http://www.powerco.co.nz/publications/disclosures/.
3 The Electricity Authority Pricing Principles are available at: https://www.ea.govt.nz/development/work-
programme/pricing-cost-allocation/distribution-pricing-review/development/summary-of-submissions-and-
decision-paper/
4 The Commerce Commission Information Disclosure requirements are available at
https://comcom.govt.nz/regulated-industries/electricity-lines/information-disclosure-requirements-for-electricity-
distributors.
Powerco Limited | Electricity Pricing Methodology 1 April 2020-31 March 2021 6• We are required to offer household customers a low fixed charge tariff option (of 15
cents/day) by the Electricity (Low Fixed Charge Tariff Option for Domestic Consumers)
Regulations 2004 (the low fixed charge regulations). The Electricity Authority monitors
and enforces the regulations. The Low Fixed Charge Regulations prevent us from setting
prices which reflect the cost of supply.
OTHER SOURCES OF PRICING INFORMATION
Other sources of pricing information are available on our website.
• Information for customers connecting distributed generation to our network about the
connection process, connection charges and our approach to procuring distributed
generation for network alternatives, is available in our Distributed Generation Policy here
• Information for commercial and industrial customers about new connections and
upgrades is available in our Capital Contributions Policy here
• Technical information for retailers on our pricing is available in our Pricing Policy here
• Information for customers about how our annual price and revenue changes due to our
Customised Price Path is available in our Annual Price-Setting Compliance Statements
here
• Information about pricing changes from 1 April 2020 is available in our Reasons for
pricing changes factsheet here
Powerco Limited | Electricity Pricing Methodology 1 April 2020-31 March 2021 73. CURRENT PRICING APPROACH AND PLANS TO EVOLVE OUR PRICING
Prices are set taking account of the network, customer and regulatory characteristics
relevant to each of our networks. As such, we recognise the importance of pricing to reflect
evolving customer expectations, technology choices, and use of the network.
PRICING IN THE EASTERN REGION – TAURANGA AND THAMES VALLEY
For the Eastern region our prices are set and measured at a customer’s metering point. The
resulting line charge is passed to the retailer. This is referred to as an Installation Control
Point (ICP) approach to set prices.
An overview of the current price structure and price components for each customer group is
provided in Table 1 and Table 2. More detail on each customer group is provided in
Section 6.
Residential Price Structures (up to 60Amps)
Prices for most residential customers in the Eastern region have a fixed daily price plus
several volume-based prices which can vary depending on the type of meter and controlled
load arrangement you have.
Table 1: Eastern region residential pricing structures
Variable price options
Customer Price Fixed All Off-
Meter type Uncontrolled Controlled Night Peak
group categories price inclusive Peak
PEAK/ OFPK/
24UC CTRL NITE AICO
PKIN OPIN
$/day $/kWh $/kWh $/kWh $/kWh $/kWh $/kWh
V05/T05
Non-TOU
V06/T06
Residential
TOU V05S/T05S
and small
commercial
(exemption) V06S/T06S
V05S/T05S
TOU
V06S/T06S
Fixed and variable TOU off-peak prices
The fixed and variable off-peak prices are set to largely recover Powerco’s distribution costs
(excluding Transpower’s charges). The fixed price does not fully recover fixed distribution
costs for T05/V05 and T05S/V05S due to the restriction of the Low Fixed Charge
Regulations.
Uncontrolled, Controlled, and Night-rate prices
We offer a price differential between controlled and uncontrolled load. We use load control to
manage network security. This can also support efficient grid utilisation and reduce the need
for network investment. Customers who accept controlled load benefit from lower distribution
prices. The options differ based on type and duration of control: Controlled (17 hrs/day),
Powerco Limited | Electricity Pricing Methodology 1 April 2020-31 March 2021 8Uncontrolled (24 hrs/day), and Night Only (23:00 – 07:00). The NITE tariff is also a form of
controlled load and is a separately metered supply to permanently wired appliances. No
uncontrolled appliances are connected to the NITE supply meter.
The variable TOU peak price
The variable TOU peak price recovers part of the distribution cost and all recoverable costs
such as Transpower’s connection, interconnection and new investment charges as well as
council rates and statutory levies. This difference between Peak and Off-peak prices largely
reflects transmission interconnection charges which are based on demand at peak times.
Commercial and industrial price structures (200 – 1499 kVA)
Commercial and industrial pricing has components which adjust to reflect the connected
capacity of each customer group. The fixed component is cost-reflective, as it’s based on the
level of demand that customers place on different elements of our network such as sub-
transmission, high voltage (11kV) and low voltage (400V).
Table 2: Eastern region commercial and industrial pricing structures
Power
Fixed price Variable charge
Customer Meter Price Factor
group type categories DIST TRAN PFC 24UC CTRL TOU
$/day $/kW $/kW $/kVAr/mth $/kWh $/kWh $/kWh
T22 / V24
Non-TOU
Medium V24N / V28N
commercial T24 / V28
TOU
T41
Large
TOU V40 / T50
commercial
Medium commercial and industrial customers
Prices for medium commercial and industrial customers have a two-part structure comprising
of a daily fixed price component and a consumption-based kWh variable price. The daily
fixed price recovers fixed distribution costs. The variable capacity component recovers
variable distribution and transmission costs. Customers with a substandard power factor are
subject to a power factor price.
Large commercial and industrial customers
Prices vary according to the location, kW capacity, and the peak demands of the individual
connection. These custom prices support efficient capacity utilisation because they reflect
the capacity used. If a customer’s capacity requirements change, they can request to
upgrade or downgrade capacity. Customers with a substandard power factor are subject to a
power factor price.
Powerco Limited | Electricity Pricing Methodology 1 April 2020-31 March 2021 9PRICING IN THE WESTERN REGION – TARANAKI, WANGANUI, RANGITIKEI,
MANAWATU, TARARUA, AND WAIRARAPA
For customer on the Western region, the network service is priced at the point electricity
enters the distribution network from the national grid rather than at the customer’s
connection to the distribution network. Retailers decide how to on-charge their share of the
cost of the distribution service to their customers. This is known as a Grid Exit Point (GXP)
approach to pricing.
Like the Eastern region, pricing in the Western region is influenced by local network and
customer characteristics. The network has significant variations in network density reflecting
the relative number of customers to the length of wires. This network density has an impact
on the cost of supply, which we reflect using two different (density) zones. Within these
zones, customers are grouped according to capacity Prices in the Western region are set for
three customer groups:
• Residential and small commercial - capacity less than or equal to 100kVA
• Commercial - capacity between 100-300kVA
• Large commercial and industrial - capacity greater than 300kVA
An overview of the current price structure and price components for each customer group is
provided in Table 3 and Table 4. More detail on each customer group is provided in
Section 6.
Residential and Small Commercial pricing structures (Peak pricing The peak price is set to recover part of the distribution cost and all recoverable costs such as Transpower’s connection, interconnection and new investment charges as well as council rates and statutory levies. The difference between the peak and off-peak prices is set to reflect Transpower’s interconnection charges which are based on the 100 regional peak periods 1 September and 31 August the previous year. Commercial and industrial price structures (>100kVA &
As a first step, we plan to replace the GXP approach to pricing in the Western region with an
ICP methodology (as used in the Eastern region) in the coming years. ICP pricing more
closely reflects retailer prices and consequently makes it possible to provide a greater
number of targeted price signals to specific regions, customer groups, or individual
customers to promote efficient use of the network. The transition involves significant system
changes and requires access to consumption data so we can set prices accurately. It will
require us to work with retailers to ensure a manageable transition between methodologies,
including assessment of customer impacts.

Longer term pricing direction

From 1 April 2018 Powerco has operated under a revenue cap. A benefit of this approach is
that it removes potential barriers for us to move to more cost-reflective pricing structures.
Powerco’s roadmap reflects the removal of these barriers and includes initiatives that will
improve the alignment between costs and prices.

Issues we will continue to investigate and monitor over the medium-term are:
•      Improving the alignment of fixed price components with fixed costs.
•      the impact a stronger peak demand pricing signal would have on different types of
       customers’ electricity usage.
•      the benefits and consequences of greater alignment of the pricing approaches used in
       the Eastern and Western regions.
•      the needs of customers when we are making price adjustments.
•      customer preferences towards the way costs are allocated and reflected in prices.

    Powerco Limited | Electricity Pricing Methodology 1 April 2020-31 March 2021              12
4. CHANGES TO OUR PRICING APPROACH AND PRICES IN 2020-21
The Pricing Schedule for 2020-21 sets out the specific prices for customers connected to our
networks. It is available on our website here. The prices reflect a total average decrease in
forecast revenue of 12.6%5 compared to last year.
The change in forecast revenue for the Eastern and Western regions is shown in Table 5.
Table 5: Changes to Powerco's total forecast revenue
Forecast Revenue ($000):
2019/20 2020/21 Change
Eastern region 197,294 174,510 -22,784 (-11.5%)
Western region 204,996 177,079 -27,917 (-13.6%)
Total 402,290 351,589 -50,701 (-12.6%)
The reasons for changes to forecast revenue are described in Table 6.
Table 6: Reasons for changes to forecast revenue
Specific Description
Variation
WACC On 25 September 2019, the Commerce Commission published the Weighted
reduction Average Cost of Capital (WACC) rate at 4.57% to apply to all EDBs from 1 April
2020 to 31 March 2025 (FY21-FY25). This was lower than assumed in Powerco’s
Customised Price Path. The impact of applying this lower WACC was to reduce
Powerco’s allowable revenue (net of pass-through and recoverable costs) by
$43.8m for the FY21 pricing year.
Reduction in Transpower’s WACC was also reset for the price year starting 1 April 2020. This
Transpower’s resulted in a reduction in transmission charges. Transpower’s interconnection rate
charges decreased by 10.0% from $109.38 /kW to $98.39/kW. Powerco’s Regional
Coincident Peak Demands (RCPDs), also decreased by 2.0% from 760.8 MW to
745.8 MW. This resulted in an 11.7% decrease in Transpower’s charges for the
FY21 pricing year.
Reduction in Avoided Cost of Transmission (ACOT) payments for FY21 have decreased by
ACOT $0.8m due to a drop in the interconnection rate and the generation that it applies to.
payments
Wash-ups The revenue wash-up amount increased by $7.3m, from +$0.3m in FY20 to +$7.6m
and in FY21. This increase was slightly offset by the Commerce Commission’s Opex
incentives IRIS and Quality Incentives. These incentives decreased allowable revenue by -
$1.77m in FY21, compared to a decrease of -$0.65m in FY20.
5
This reflects the change from the forecast for FY20 to the forecast for FY21. It may differ slightly from figures
published elsewhere, which compare the forecast for FY21 against the most recent estimate for FY20.
Powerco Limited | Electricity Pricing Methodology 1 April 2020-31 March 2021 13Figure 2 presents these to illustrate the positive and negative impacts for each change
relative to the overall change in allowable revenue.
Figure 2 Percentage contribution to change in allowable revenue (FY20-FY21)
Prices have been adjusted to reflect this change, and there have been some other changes
to our pricing approach, as described and summarised in Table 7.
Table 7 Changes to pricing from 1 April 2020
Change Description
Decrease in Powerco has adjusted prices across the customer groups to reflect the lower
variable charge revenue required this year. The impact of changes to prices this year can be
elements for
summarised as:
most price
structures • Residential and small businesses (99% of connections). The forecast
revenue from this group falls by 13%. Variable prices have fallen by 14-17%
with no change to fixed prices. This increases the relative share of revenue
from fixed prices from 12% to 14%, improving the cost-reflectivity of the lines
charge for this customer group.
• Commercial and industrial customers. The forecast revenue required this
group falls by 12%. The impact on prices varies because the price structures
are different across the regions. In the Eastern region, the impact is largely a
reduction in variable price components. In the Western region, demand
prices are reduced, reflecting the lower cost of the network to meet a similar
level of peak demand.
E100 & E300 The minimum chargeable On Peak Demand (OPD) for E100 and E300 price
minimum OPD categories will be reduced to zero (was 100kW and 300kW, respectively. This will
reduced to zero
allow our prices to be more cost reflective as charges will reflect actual shares of
transmission and pass-through costs. We consulted with retailers regarding this
change and it was well received.
V40 and T50 Customers on price categories V40 and T50 will be subject to a minimum
minimum AMD chargeable Anytime Maximum Demand (AMD) of 100kW. The minimum
of 100kW
Powerco Limited | Electricity Pricing Methodology 1 April 2020-31 March 2021 14Change Description
chargeable AMD is introduced to align the pricing approach and prices of
comparable capacity connections.
T41 price Pricing for T41 now aligns with the T24 rice Category, which covers an identical
category closed connection capacity range. Future migration from T41 to T24 is planned.
to new
connections
Boost period for The boost period for CN9 and NB9 meters will be reduced to 30 minutes, covering
‘Night with the period between 14:00-14:30 each day. Previously it was 60 minutes (14:00-
Boost’ reduced
15:00). Eventually the period will be reduced to zero, as noted in the current and
previous Pricing Policies.
Powerco Limited | Electricity Pricing Methodology 1 April 2020-31 March 2021 155. HOW PRICES ARE SET FOR EACH CUSTOMER GROUP
Prices for customers in both the Eastern and Western regions are set three high-level ways:
• Standard pricing for residential and most commercial customers supplied according
to the price categories in the standard price schedule
• Non-standard customer specific asset-based pricing for large connections
(>1500kVA Western region and >300kVA Eastern region), although also some smaller
customers where asset-based pricing is appropriate
• Non-standard asset-based building block pricing for very large (>4MVA)
connections, typically requiring a capacity upgrade or large new connection. These
customers have a direct contractual relationship with Powerco for a defined term.
We also set prices for distributed generators, including payments to distributed generators
providing network support services.
When setting prices, we consider the opportunities to share the value of deferring planned
network investment. One way we do this is through a discount for controlled load.
STANDARD PRICING
We set standard prices using the following process:
Activity What’s involved
Determine
• Assign customers (connections) to groups for allocating total costs.
customer groups.
More detail on how we do this is in Section 6.
Calculate and
• Confirm the total forecast allowed revenue we can recover for the year.
allocate costs to
Forecast revenue is determined by the Commerce Commission to
customer groups
reflect efficient costs of supplying distribution services
• Calculate expected costs for the year. The main component costs are
operating costs (including administration costs), capital costs (including
return on investment) and transmission costs (including ACOT)
• Allocate costs to each customer group to as closely as possible align
benefit of access and use of the distribution service and cost of
supplying the distribution service
• Determine price structures for each customer group based on the
relevant cost allocations, and complying with the relevant legal
requirements
More detail on how we do this is in Section 7
Assess customer
• Check the impact on customers of pricing variations, and adjust pricing
impacts of pricing
as needed
variations
More detail on how we do this is in Section 8.
Powerco Limited | Electricity Pricing Methodology 1 April 2020-31 March 2021 16NON-STANDARD PRICING
Non-standard6 pricing and individual account management is offered to industrial and large
commercial customers to provide a tailored service. We offer this when the customer’s
needs are unique to their business need eg timing and scale of investment. Our approach to
non-standard pricing considers customers’ individual capacity and demand to ensure, to the
extent practicable, that the price is cost reflective.
We have two non-standard pricing approaches:
• Eastern region: Asset-based building block pricing (the T50/60 and V40/60 price
categories).
• Western region: Customer specific asset-based pricing (the SPECIAL price category)
The number, size and pricing characteristics of non-standard customers are available in
Appendix A. We disclose the number of new non-standard contracts each year on our
website here.
Customer-specific asset-Based pricing
Customer-specific asset-based pricing applies to large connections in both the Eastern and
Western regions and others that opt for an asset-based price. Asset-based pricing may also
apply to generation connections and special arrangements designed to mitigate the risk of
uneconomic asset bypass. Each price is set individually using this process.
6
A contract is considered non-standard if: (a) The price at which the electricity line services are to be provided is
not determined solely by reference to a schedule of prescribed terms and conditions that is publicly disclosed;
and (b) fewer than five people have such contracts with Powerco.
Powerco Limited | Electricity Pricing Methodology 1 April 2020-31 March 2021 17Table 8: Asset-based pricing process
Activity What’s involved
Measurement and A customer’s demand, measured by AMD (anytime maximum demand) or
forecasts of customer OPD (on peak demand) is used to calculate asset-based prices
demand and
connections
Calculate value of The assets used to supply the service are valued to calculate the asset-
assets supplying the based price. We use ORC or ODRC methods depending on the customer
connection, including load group. For price categories T50 and V40 the ODRC methodology is
allocating value of used while for price categories T60, V60 and SPECIAL, the ORC
shared assets methodology is used.
ORC (Optimised Replacement Cost) is an estimate of the current cost of
replacing the asset with one that can provide the required service in the
most efficient way and ORDC (Optimised Depreciated Replacement
Cost) is an estimate of the ORC value, less an allowance for depreciation
that reflects the age of the asset.
Assets are categorised as dedicated on-site assets or shared upstream
assets:
Calculate return of and An annual rate of return is recovered on the asset valuations attributed to
on capital each customer – this is based on Powerco’s prevailing weighted average
cost of capital (WACC).
• a 45-year annuity factor is used to obtain a return of and on the
capital invested for assets valued using ORC
• a WACC-based rate of return is used for those assets valued using
ODRC to calculate the return on capital invested. A straight-line
depreciation charge is used to obtain a return of capital.
Allocate maintenance Maintenance costs are allocated to the relevant load groups based on the
costs load group’s ODV relative to the applicable GXP’s total ODV7. These
costs are allocated among the customers within the load group based on
each customer’s AMD as a proportion of the aggregate AMD of the load
group.
Allocate indirect costs Indirect costs are allocated to load groups based on its total ODV as a
(fixed and variable). proportion of the applicable GXP’s total ODV. Indirect costs are all costs
of Powerco’s electricity business excluding transmission, asset-related
costs, maintenance, interest and tax.
Allocate transmission Transpower’s connection charge allocation is based on the customer’s
costs demand measured by AMD. Where a customer is both an offtake
customer and an injection customer at a connection location, connection
charges for that location are calculated separately for that customer as an
offtake customer and an injection customer.
• Interconnection charges are allocated based on the customer’s OPD
multiplied by Transpower’s interconnection rate.
• ACOT charges from distributed generators are also allocated to
customers on the same basis as connection and interconnection
charges.
7
Optimised Deprival Value (ODV) means the value attributed by applying the ODV methodology published by
the Commerce Commission in 2010.
Powerco Limited | Electricity Pricing Methodology 1 April 2020-31 March 2021 18More information on criteria applying when a customer enters an asset-based load group is
available in our Pricing Policy, available at: https://www.powerco.co.nz/publications/pricing-
schedules/.
Asset-based building block method (BBM)
The asset-based building block method is to set prices for very large (>4MVA) customers in
both regions. These customers have a direct contractual relationship with Powerco for a
defined term, typically for:
• a step change upgrade is needed but the increase in the customer’s demand may not be
as significant; and/or
• a new customer connection is required that involves significant investment.
BBM asset-based pricing comprises the following input components:
• return on capital investment, plus accounting depreciation in period or year;
• sub-transmission cost allocation of direct and indirect costs for sub-transmission asset
utilisation in period or year;
• operating and maintenance costs;
• tax adjustment; and
• recovery of pass-through costs and recoverable costs (e.g. transmission charges and
regulator levies).
CUSTOMERS ON NON-STANDARD CONTRACTS
Non-standard contracted customers are generally significant commercial or industrial loads,
and thus arrangements between the parties include provision for response to planned and
unplanned interruptions. For example, customers are given direct contact with Powerco’s
Network Operations Centre which enables them to liaise directly should a network event
occur and help co-ordinate restoration. Some non-standard agreements include operational
protocols detailing the management of load in the event of maximum demand levels being
reached, or load managed in the event of abnormal network configurations.
These arrangements have no direct effect on the determination of prices for these
customers.
PRICING FOR DISTRIBUTED GENERATION
Prices for distributed generation, and payments from Powerco to distributed generators for
avoided cost of transmission (ACOT) and network support services are set according to the
Distributed Generation Policy, available here. Powerco does not currently have any
electricity distribution services which receive prices from distributed generation.
We pay ACOT and charge each distributed generator prior to connection to the network
based on the conditions and fees set out in Part 6 of the Code. We do not charge distributed
generation for exporting electricity via our network.
Powerco Limited | Electricity Pricing Methodology 1 April 2020-31 March 2021 19SHARING VALUE OF DEFERRAL OF INVESTMENT
We see the potential for customers to help us defer network upgrades and improve quality of
supply by providing network support services. This could be from demand response or
distributed generation and could be directly (eg hot water load control) or indirectly (eg a
third-party provider).
We share the value of deferring investment with customers providing network support
services in several ways.
Load control
Our prices across both regions reflect the difference in long term costs associated with
investment in additional capacity in the distribution network.
• Residential customers in the Western region (the E1 customer group) offering control of
their hot water have the daily fixed price discounted by 15 cents/day to 0 cents/day.
• Residential customers in the Eastern region (the T-V05/06 customer groups) offering
control of their hot water receive discounts to the volume-based prices based on the
availability and duration of load control.
• NITE price option is also a form of controlled load and is a separately metered supply to
permanently wired appliances. No uncontrolled appliances are connected to NITE supply
meter. The Load Control Equipment when in operation must result in the reduction to
zero of all controllable loads and all load connected to the NITE supply meter.
Configured well, load control systems are highly effective at reducing demands at peak times
by deferring non-time-critical power usage. The benefits of load-control systems include
more predictable peak demand magnitudes, fewer peaking generation plants and deferred
transmission and distribution capacity augmentations. The benefits accrue across the entire
electricity sector.
Demand price
Powerco’s demand prices in the Western region are applicable to larger commercial and
industrial customers. They are designed to reflect the relative costs of distribution and
transmission for those customers groups and are further split by GXP groupings. This pricing
method is an alternative to full asset-based pricing for each connection, while being more
reflective than using kWh-based prices.
Standalone power systems
We also support deferral and avoidance of investment through installation of standalone
power systems where the efficient option is to provide an alternative energy supply rather
than replacing network assets. In some cases, the cost of renewing these assets is greater
than the present value of the line charges that would be recovered over the lives of the
assets.
Powerco Limited | Electricity Pricing Methodology 1 April 2020-31 March 2021 206. HOW WE GROUP CUSTOMERS
Prices are set for specific customer groups because it is not practicable to set individual
prices, except for large commercial and industrial customers. Consequently, a key step of
the pricing approach is grouping connections across each network. We group connections
based on location and connection size or capacity. These criteria reflect the influence on
costs of network and customer characteristics such as geography, rural/urban network
density, mains size, protection rating and/or transformer capacity.
We use six groups of connections for the Eastern region and three groups for the Western
region. Table 9 describes each group.
Table 9: Customer groups used for the Eastern and Western regions
Eastern region Western region
T01/T02 and V01/V02 – for all unmetered
connections such as streetlights in the Valley
and Tauranga regions
The unmetered nature of the load and the
associated dedicated equipment, require
special consideration when allocating costs E1. All residential and most commercial
customers including unmetered
T05/T06, V05/V06, T05S/T06S – for all connections
residential customers and small commercial All connections with a connected capacity of
customers with a fuse size of 3 Phase 60 less than 100 kVA which represents all
Amps or less residential and most commercial customers.
Any customers with a fuse size of up to 3 The E1 price category has been limited to less
Phase 60 Amps are typically considered to be than 100 kVA to provide a relatively simple
residential or small commercial customers and, price structure for most customers while
as such, individually place minimal demands on excluding all connections which require
our network and require minimal investment in dedicated on-site and/or upstream assets
on-site and upstream assets. Providing specific
eligibility criteria8 are met, residential customers
can choose between the low user price
categories (V05/T05) and the standard price
categories (V06/T06)
T22/V24 – for medium commercial E100. Includes all connections with an
customers with a fuse size of greater than 3 installed capacity of greater than 100 kVA
Phase 60 Amps up to and including 3 Phase up to 300 kVA
250 Amps
all connections with a connected capacity of
Any connections with these fuse sizes are between 100 and 300 kVA, which equates to
typically commercial customers with higher medium-large commercial customers. This
average volumes than the T05/T06 and price category has been defined because
V05/V06 price categories. Therefore, this group connections with this level of capacity place
places increased demands on different different levels of demand on different
components of our network and requires a components of our network assets such as sub-
slightly larger investment in on-site and transmission, high voltage (11kV) and low
upstream assets voltage (400V) assets and typically require
8
For details on the eligibility criteria for the low user (also known as low fixed charge) prices please see the full
pricing policy here.
Powerco Limited | Electricity Pricing Methodology 1 April 2020-31 March 2021 21Eastern region Western region
T24/T41/V28 – for medium commercial dedicated on-site assets such as transformers
customers with an installed capacity of 200 – and associated switchgear.
299 kVA
Any connections with this level of installed
capacity are typically medium sized commercial
customers with significantly higher average
volumes than the T22/V24 price categories.
Therefore, this group places increased
demands on the upstream network assets and
requires a slightly larger investment in on-site
and upstream assets. The T41 price category is
available only for connections in this customer
group with half hourly (HH) metering.
T50/V40 – for large commercial customers
with an installed capacity of 300 – 1499 kVA
Any connections with this level of installed
capacity are typically large commercial
customers which require dedicated
transformers and associated switch gear to
meet their supply requirements
E300. Includes all connections with an
T60/V60 – for large commercial customers installed capacity of greater than 300 kVA,
with an installed capacity of 1,500 kVA and including non-standard connections and
greater connections with individually assessed pricing.
Any connections with this level of installed Connections with a connected capacity of
capacity are typically very large greater than 300 kVA are large commercial /
commercial/industrial customers which place industrial customers. This price category has
increased demand on upstream network assets been defined because connections with this
and require dedicated on-site transformers and level of capacity place different levels of
dedicated feeders to meet their supply demand on different components of our network
requirements assets such as sub-transmission, high voltage
Because connections in the V40, T50, T60 and (11kV) and low voltage (400V) assets and
V60 price categories typically require dedicated typically require a higher level of dedicated on-
on-site and upstream assets they are all site and up-stream assets (such as
individually priced based on their specific on- transformers, switchgear and feeders) than the
site and upstream assets and contribution to E100 price category.
peak demands. While these customers are
charged a constant daily price, it is reviewed
each year based on the customer’s previous
year’s peak demands (as detailed in Section
10). This ensures that their prices are regularly
updated to reflect their individual contribution to
network costs
Customers are assigned to a group based on the location of the GXP that is associated with
their connection and based on installed capacity of their connection. More detail on the
location and capacity criteria is provided below.
The granularity of the groupings for each category reflects a trade-off between practicality,
fairness and cost-reflectiveness. We have made several incremental improvements over
recent years to simplify our price structure while limiting price impacts on customers.
We use different Eastern and Western customer groups for historical reasons. The
difference is due to more capacity bands for customers on the Eastern region, which allows
Powerco Limited | Electricity Pricing Methodology 1 April 2020-31 March 2021 22prices to more closely reflect costs for each customer group. We will reassess the number of
customer groups in the Western region as part of the transition to ICP pricing.
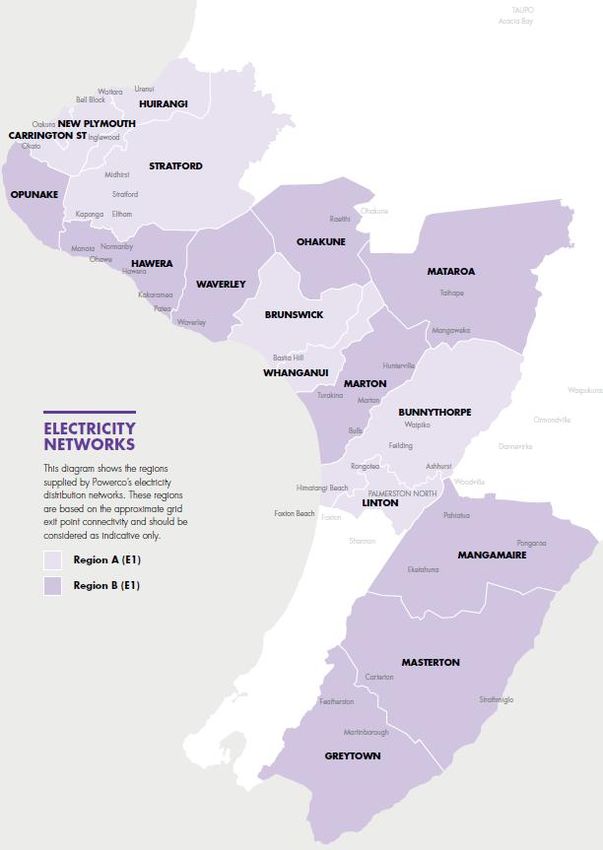
How location is factored into pricing
The location criteria reflect the underlying cost of supplying distribution services to
customers in specific locations. Figure 3 shows the pricing zones for the Eastern and
Western regions. Grouping customers by location assists in recognising the relative costs of
supplying customers within specific areas and allows a fairer allocation of costs.
Figure 3: Eastern and Western region pricing zones
Eastern region Western region
Powerco Limited | Electricity Pricing Methodology 1 April 2020-31 March 2021 23The Eastern and Western regions are split in to two zones, reflecting customer density within
each region (Figure 4).
Figure 4: Average network density (Eastern and Western regions)
Eastern region
Customers are grouped based on connection to either the Tauranga or Thames Valley sub-
regions. The Tauranga part of the network has a higher density than Thames Valley. Prices
for residential customers on the Valley network are typically higher than in the Tauranga
network because the lower network density and greater average system length means the
costs of supply are allocated across fewer customers.
Western region
Customers are grouped by GXPs which have a similar network density:
• Zone A includes customers connected to GXPs supplying the high-density urban centres
of New Plymouth, Whanganui and Palmerston North.
• Zone B includes customers connected to GXPs supplying the remaining low density and
typically rural areas.
For residential and small commercial customers, prices for Zone B are typically higher than
Zone A because the lower network density and greater average system length means the
costs of supply are allocated across fewer customers.
Commercial and industrial customers are not grouped into regions A and B. Instead, there
are ten GXP zones with each zone representing a grouping of GXPs based on geographical
proximity and the structure of the network connecting them. For example, in Figure 3 the
GXPs of Huirangi, Carrington St, New Plymouth, and Stratford are grouped together into
Zone A. The number of zones represents Powerco’s preference for greater transparency of
costs within this price category because changes to individual customer behaviour within
these groups can have on the underlying cost structure.
Capacity criteria
Capacity criteria are used to group customers by capacity of their connection or the local
network (eg local transformer). Capacity is used to allocate costs because it is a significant
Powerco Limited | Electricity Pricing Methodology 1 April 2020-31 March 2021 24influence on network cost. Powerco’s prices in the Eastern and Western regions are structured to reflect different capacity bands. Eastern The six Eastern customer groups have similar load characteristics, such as demand, fuse size and installed capacity, as well as those which use specific sets of assets. Fuse size is used for some Eastern groups because for residential and smaller commercial connections, their available capacity is limited by the size of the fuses at their installation rather than the installed capacity of dedicated transformers. For this reason, connections typically have only one applicable price category. There are situations where customer preferences and metering can determine the price category, such as the low user (V05/T05) and the T24/T41 price categories. Western The three Western region customer groups have similar characteristics relating to their installed capacity and associated demand. They reflect the use by each customer group of components of the network, such as sub-transmission, high voltage (11kV), and low voltage (400V) assets, and the on-site assets at each connection such as transformers and associated switchgear. Most residential (E1) connections in the Western region make use of all the network assets but have limited on-site assets. Industrial connections (E300 price category) often have more on-site assets and make limited use of the low voltage (400V) network assets. The use of these customer groups means prices can reflect costs across these groups. Powerco Limited | Electricity Pricing Methodology 1 April 2020-31 March 2021 25
7.       CALCULATING AND ALLOCATING COSTS ACROSS CUSTOMER
         GROUPS

For the 2020/21 pricing year, Powerco’s total forecast revenue is $351m. We set prices to
recover this amount by calculating and allocating costs across each customer group. The
process involves:

•      Confirming the total forecast revenue allowed by the Commerce Commission for the
       pricing year

•      Identifying our major cost components, and whether the costs are fixed or avoidable

•      Allocating costs to specific customer groups

•      Checking alignment between cost types and price components

PRICES ARE SET TO REFLECT MAJOR COST COMPONENTS

We use three categories of cost: operating and maintenance costs; cost of capital; and
transmission and other pass-through costs, such as local authority rates. Table 6 details the
forecast costs for each of these categories for the 2020/21 pricing year.

        Table 6: Expected costs of supplying distribution services in the 2020/21 pricing year

                                                    Eastern region            Western region     Total
    Cost
                                                          ($000)                   ($000)        ($000)

    Operating and maintenance costs                             $95,720                $87,224     $182,944

    Transmission costs9                                         $44,785                $55,085      $99,870

    Cost of capital                                             $36,574                $32,201      $68,776

    Forecast Revenue                                          $174,510                $177,079     $351,589

More detail on each of these costs is provided below. Detailed information on Powerco’s
forecast and historical costs are available in Powerco’s disclosures to the Commerce
Commission. These disclosures include Powerco’s Asset Management Plan, which contains
forecasts of demand and costs for the next 10 years.10

Operating costs

Operating costs are the day-to-day costs of providing the distribution service, including:
•      Network operation costs

9   This includes and other pass-through and recoverable costs (around 4% of total).
10
     Our disclosures, including Asset Management Plans are available here

    Powerco Limited | Electricity Pricing Methodology 1 April 2020-31 March 2021                          26
• Network planning and asset management costs
• Network management and dispatch costs
• The cost of support services such as billing, record management, planning, contract
administration, regulatory compliance and resource costs
• Statutory charges and levies (excluding those that are pass through costs)
• Depreciation on electricity lines business assets
• Tax
Transmission costs
The transmission component includes recovery of all recoverable costs such as
Transpower’s connection, interconnection and new investment charges as well as council
rates and statutory levies, and any avoided cost of transmission (ACOT) payments made by
Powerco to distributed generators.
Transpower’s charges are set according to the transmission pricing methodology determined
by the Electricity Authority and ‘passed through’ to customers in our prices. Detailed
information on the transmission charges is available on the Transpower website.
Capital costs
The capital cost component includes recovery of the cost the debt and equity invested in
Powerco. Powerco requires large amounts of capital to maintain and develop network
assets. Historical capital expenditure by drivers (e.g. system growth, replacement and
renewal) is available on Powerco’s website. Powerco’s asset management plan provides a
large amount of detail on the drivers of capital expenditure for the network.
ALIGNING COSTS AND PRICES ACROSS CUSTOMER GROUPS
Firstly, costs are allocated to customer groups and pricing zones. The allocation is a function
of the load characteristics of the customer groups, network use, and cost of supply. When
costs are directly attributable to a group or zone, they are allocated directly to them. When
they aren’t, we allocate more broadly. In summary:
• Operating costs: allocated to GXPs where attributable, spread broadly otherwise.
• Transmission costs: allocated to GXPs. Within each GXP, allocated based on demand.
• Cost of capital: allocated based on the value of assets in each network region
Pricing structures for each customer group are intended to marry the cost components with
the attribute that drives it. Our intention is to recover fixed costs using fixed price
components and avoidable costs using avoidable cost components. For example, we want
the fixed daily price for residential customers to recover fixed costs. However, it is not
practicable to do so yet for several reasons, such as the LFC regulations and data quality.
Powerco Limited | Electricity Pricing Methodology 1 April 2020-31 March 2021 27Eastern region
Powerco’s price structure in the Eastern region has been designed so that customers with
higher connected capacity have a higher fixed component than those with lower connected
capacity. This benefits both Powerco and customers by making line charges more
predictable and more closely related to the actual cost of supply.
This approach also helps to ensure that customers have the right incentives to state their
capacity requirements. Larger capacity price categories have the bulk of their line charges
fixed, while lower capacity categories have fixed component varying between 14% to 66% of
the lines charge (as shown in Table 7).
Powerco’s ability to align the price structure with costs is restricted by Low Fixed Charge
Regulations which distort the balance between and levels of fixed and variable prices.
Powerco determines the proportion of fixed and variable charges by reference to existing
rates while recognising the largely fixed nature of the underlying costs. The regulations have
a large influence on the level of the fixed and variable components for residential groups.
Table 7: Eastern region target revenue requirement split by fixed and variable price
components for each customer group (2020/21 pricing year)
Revenue split
Customer
Zone Price Category Demand
Group Fixed Variable11
price
Tauranga Unmetered (T01/T02) 79.0% 21.0% -
Residential
(Including 10.7% 89.3% -
Low Usage (T05)
Unmetered
ICPs) 37.0% 63.0% -
Standard (T06)
3 Phase 60 – 3 Phase 250 Amps (T22) 37.6% 62.4% -
69 – 299 kVA 200 – 299 kVA (T24) 57.1% 42.9% -
200 – 299 kVA (T41) 37.6% 59.1% 3.2%
300 kVA + (incl. 300 – 1,499 kVA (T50) 96.8% - 3.2%
non-standard
customers) 1,500 kVA + (T60) 97.0% - 3.0%
Valley Unmetered (V01/V02) 95.0% 5.0% -
Residential
(including 10.9% 89.1% -
Low Usage (V05)
unmetered
ICPs) 28.6% 71.4% -
Standard (V06)
3 Phase 60 – 3 Phase 250 Amps (V24) 31.8% 68.2% -
69 – 299 kVA
200 – 299 kVA (V28) 43.1% 56.0% 1.0%
300 kVA + (incl. 300 – 1,499 kVA (V40) 96.2% - 3.8%
non-standard
customers) 1,500 kVA + (V60) 98.4% - 1.6%
11 Including power factor prices (where applicable).
Powerco Limited | Electricity Pricing Methodology 1 April 2020-31 March 2021 28Western region
As for the Eastern region, distribution costs are largely fixed rather than related to the
delivered energy volumes. Again, the Low Fixed Charge Regulations affect the balance
between fixed and variable prices and are exacerbated when applied to GXP pricing. As a
result, prices for residential and small commercial customers (E1 in Table 8) is mostly
variable despite most network costs being fixed.
Customers in the E100 and E300 price categories are typically very large commercial or
industrial businesses requiring dedicated on-site and upstream assets (such as dedicated
feeders and transformers) to meet their supply requirements. The fixed price component of
these price categories is typically higher than the other price categories to reflect the ensure
that an appropriate return on investment is earned by Powerco.
Table 8: Western region target revenue requirement by fixed and variable price components
for each customer group (2020/21 pricing year)
Target Revenue Split
Customer Group Zone
Fixed Variable Demand12
E1 – less than 100 kVA A 4.2% 95.8% -
B 3.1% 96.9% -
E100 (100 – 300 kVA) A 13.2% - 86.8%
B 8.4% - 91.6%
C - - -
D 10.7% - 89.3%
E 13.0% - 87.0%
F 9.8% - 90.2%
G 6.3% - 93.7%
H 8.9% - 91.1%
I 13.3% - 86.7%
J 10.2% - 89.8%
E300 (300 kVA+) A 27.9% - 72.1%
B 20.6% - 79.4%
C 9.3% - 90.7%
D 19.1% - 80.9%
E 28.9% - 71.1%
F 24.6% - 75.4%
G 16.5% - 83.5%
H 17.7% - 82.3%
I 24.0% - 76.0%
J 36.4% - 63.6%
Non-standard 98.55% - 1.5%
12
Including power factor prices (where applicable).
Powerco Limited | Electricity Pricing Methodology 1 April 2020-31 March 2021 29You can also read