Pricing Methodology 1 April 2021 - Marlborough Lines
←
→
Page content transcription
If your browser does not render page correctly, please read the page content below
Pricing Methodology
                                                  1 April 2021
Pursuant to Electricity Distribution Information Disclosure Determination 2012
Contents
1.     INTRODUCTION ....................................................................................................................................... 3

     1.1      OVERVIEW OF MLL .................................................................................................................................... 3

     1.2      PRICING CHANGES FOR DISCLOSURE YEAR 2022 ............................................................................................... 5

     1.3      PRICING METHODOLOGY ............................................................................................................................. 6

2.     CONSUMER ENGAGEMENT ...................................................................................................................... 6

     2.1      CONSUMER SATISFACTION SURVEY................................................................................................................. 6

     2.2      DISTRIBUTION PRICING SURVEY ..................................................................................................................... 7

     2.3      FURTHER CONSUMER ENGAGEMENT .............................................................................................................. 9

3.     PRICE SETTING ......................................................................................................................................... 9

     3.1      CONSUMER GROUPS ................................................................................................................................. 10

     3.2      NETWORK STATISTICS................................................................................................................................ 11

     3.3      FORECAST COSTS ...................................................................................................................................... 11

     3.4      ALLOCATION METHODOLOGY ...................................................................................................................... 13

     3.5      TARGET REVENUE BY PRICE COMPONENT....................................................................................................... 14

     3.6      NON-STANDARD CONTRACTS ...................................................................................................................... 16

4.     DISTRIBUTION PRICING ROADMAP (STRATEGY) .................................................................................... 17

     4.1      PRICING TO ALLOW AN APPROPRIATE COMMERCIAL RETURN ............................................................................. 17

     4.2      MOVE TOWARDS MORE COST REFLECTIVE PRICING .......................................................................................... 18

     4.3      OTHER PRICING REFORM CONSIDERATIONS .................................................................................................... 20

     4.4      PRICING REFORM TIMELINE (INDICATIVE) ...................................................................................................... 22

APPENDIX 1 – INFORMATION DISCLOSURE REQUIREMENTS.......................................................................... 24

APPENDIX 2 – CONSISTENCY WITH PRICING PRINCIPLES................................................................................ 26

APPENDIX 3 – TARGET REVENUE BY PRICE COMPONENT ............................................................................... 30

APPENDIX 4 – DIRECTORS’ CERTIFICATION .................................................................................................... 31

Marlborough Lines Limited
Pricing Methodology for Disclosure Year 2022                                                                                                                        2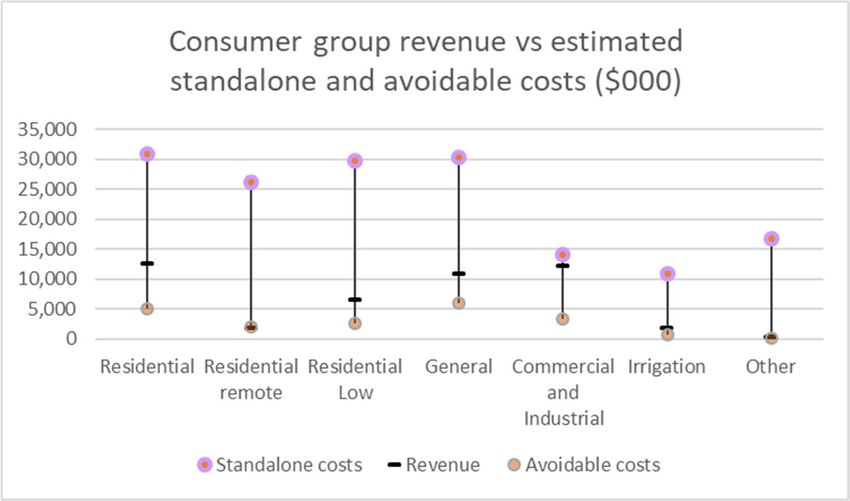
1.            Introduction
1.1           Overview of MLL
1.1.1         Ownership structure and regulatory regime

              Marlborough Lines Limited (MLL) is the electricity distribution business (EDB) connecting more
              than 26,000 consumers across the Marlborough region. It is owned by the Marlborough Electric
              Power Trust (MEPT), which holds shares on behalf of the consumers connected to MLL’s network.
              The MEPT has six elected trustees, with elections held biennially, the most recent elections were
              held in March 2020.

              MLL meets the criteria specified for a consumer owned EDB, under part 4 of the Commerce Act
              1986 and as a result is not regulated by the Commerce Commission’s default price-quality path
              (DPP) provisions. MLL is, however, required to comply with other regulations, including the
              Information Disclosure (ID) regime.

              The Electricity Authority also has regulatory oversight of the electricity industry. It also sets out
              several requirements for EDBs.

1.1.2         MLL’s business structure

              MLL has its own inhouse electrical contracting capability that undertakes capital and operational
              (maintenance) work, primarily for the network but also for other local customers. MLL has
              approximately 135 staff across both the network office and the contracting depot, both of which
              are in Blenheim.

              Outside of its core electricity distribution business, MLL has invested in other companies both
              within the distribution sector and outside of the electricity industry. MLL owns 50% of Nelson
              Electricity Limited, the EDB supplying consumers in urban Nelson, and 100% of Yealands Wine
              Group Limited, a large vineyard and winery business located in Marlborough.

1.1.3         Network characteristics

              MLL’s network has a particularly extensive 33kV (sub-transmission) network (owing to the single
              Transpower grid exit point, located in Blenheim), connecting 16 zone substations. In total there
              is approximately 3,400km of overhead lines and underground cables. Lines typically radiate out
              (there is some meshing in urban areas) to supply most areas of Marlborough. Significant extents
              of MLL’s network is in remote and rugged areas, including the outer Marlborough Sounds, upper
              Wairau, Waihopai and Awatere Valleys, the southern extent of Marlborough’s East Coast and its
              inland valleys, such as the Clarence Valley.

              These areas are very sparsely populated1, and as a result, MLL has many connections where the
              cost to supply far exceeds the recoverable revenue. Electrical infrastructure supplying these
              areas was typically constructed in the 1960s and 1970s from grant funding from the Rural
              Electrical Reticulation Council. Many of the connections in these areas are holiday homes, where
              there is typically very low occupancy rates and consequently low electricity consumption.

1   Across the network, there are on average 7.5 ICPs/km of line. In the remote areas, 1 to 2 ICPs/km of line is not uncommon.

Marlborough Lines Limited
Pricing Methodology for Disclosure Year 2022                                                                                3
The urban areas of the network (including their immediate surrounds) are typified by domestic
premises, small to medium businesses, and large commercial and industrial consumers. The
latter are concentrated at the Cloudy Bay and Riverlands industrial estates, and other wineries
around the outskirts of Blenheim.
A significant number of irrigation consumers are connected to the network. These typically
supply irrigation and/or storage water for irrigation or other agricultural/horticultural purposes.
Further information on MLL’s network (including demand forecasting and network capacity) is
included in the Asset Management Plan, available on MLL’s website2.
1.1.4 Electricity retailers (traders)
MLL has an interposed relationship with the consumers connected to its network, i.e. the
contractual relationship to deliver services is through the energy retailers trading on the network.
As such, MLL does not have a direct contractual relationship with the consumers connected to
its network.
At the time of writing, there are 18 electricity retailers trading on MLL’s network. MLL has an
agreement in place with each of these retailers (noting that some retailers have multiple brands).
Approximately 93% of consumers connected to MLL’s network are represented by six of the 18
electricity retailers.
1.1.5 Consumer connections
Of the approximately 26,000 consumers connected to the network, the vast majority are
domestic premises, or residential connections. Table 3 includes a breakdown of consumer
connection numbers on MLL’s network.
In addition to these (predominantly) load connections, there are a few distributed generation
connections on MLL’s network, including:
Weld Cone wind farm: 3 * 250kW wind turbines (0.75MW generation)
Lulworth wind farm: 4 * 250kW wind turbines (1.0MW generation)
Dominion Salt Limited’s wind turbine: single 660kW turbine; and
Kea Energy’s Wairau Valley solar farm: generation of up to 1.85MW.
MLL’s experience to date with distributed generation connection applications is that they involve
considerable work on MLL’s part in providing information requested by the applicant, and
significant resource to review the application and its potential impacts on MLL’s network (and
potentially, existing consumers connected to the network).
In addition to the above, Trustpower’s Waihopai hydro power station generates up to 2.4MW
and is connected to MLL’s 33kV network in the Waihopai Valley.
1.1.6 Annual discount payment
To recognise the benefits of being community trust owned, MLL makes an annual discount
payment (posted) from its line ownership and operations to eligible consumers connected to its
2
https://www.marlboroughlines.co.nz/About-us/Disclosures/Asset-Management.aspx
Marlborough Lines Limited
Pricing Methodology for Disclosure Year 2022 4network. Applicable discount payment rates for eligible price plans are included in MLL’s line
delivery price schedule. 3
In accordance with the Electricity Industry Act 2010, MLL, as a community trust owned EDB, must
apply income distributions (i.e. the discount payment) to at least 90% of its beneficiaries.
The amount of the discount payment for each consumer is dependent on the type of connection
(i.e. price plan the consumer is on) and the amount of energy consumed over the qualifying
discount period. The discount payment is funded from MLL’s return on investment (ROI) – refer
to section 3.3.6 for further detail.
The discount payment rate set for most applicable price plans is approximately 20%.
1.2 Pricing changes for disclosure year 2022
Price changes become effective for disclosure year 2022 (DY22), from 1 April 2021. The most
recent pricing changes prior to this took effect on 1 April 2020.
The following is a summary of the changes being introduced for DY22:
A minor increase of approximately $4.30, or 0.4% (pre-discount) for an “average”4 domestic
consumer, which mostly reflects the increase to MLL in transmission costs for the year;
A distinction in prices for remote vs non-remote residential consumers to more fairly reflect
the cost of supply;
A 1% increase in prices for Commercial and Industrial consumers (excluding the Regional
Coincident Peak Demand (RCPD) price which is treated separately as a pass-through cost);
A 2% increase in prices for Irrigation consumers;
A 1.5% increase for power factor prices, and street lighting prices; and
Adjustments from variable to fixed prices to improve cost reflectively for some consumer
groups.
A full copy of the line delivery price schedule applying from 1 April 2021 is available on the pricing
page of MLL’s website. The schedule includes price changes from the 2021 disclosure year, as
well as what components of the line delivery price are attributable to distribution and
transmission components.
1.2.1 Reasons for price changes
The price increases outlined above have been applied to recover additional costs from
Transpower ($6.9m in DY2021 to $7.0m in DY2022), as well as other forecast increased costs in
operational expenditure. Price changes have also been made in line with MLL’s distribution
pricing reform strategy.
Prices have been set to target revenue of $45.6m for DY22, which is based on applying proposed
prices to forecast connections, consumption, and demands across the DY22 year.
3 Available at https://www.marlboroughlines.co.nz/About-us/Disclosures/Pricing.aspx
4 As defined by MBIE’s Electricity (Low Fixed Charge Tariff Option for Domestic Consumers) Regulations 2004
Marlborough Lines Limited
Pricing Methodology for Disclosure Year 2022 51.3 Pricing Methodology
This pricing methodology provides detail on MLL’s pricing structure. The pricing structure (and
prices) are determined for the disclosure year, to recover sufficient revenue for MLL to cover its
costs and meet its objectives. Information on MLL’s costs, and how these costs are allocated to
various consumers connected to its network (via their electricity retailers) are included in this
pricing methodology.
MLL considers this pricing methodology to meet the requirements of Information Disclosure,
while giving due consideration to the Electricity Authority’s pricing principles. For reference and
completeness, these are included in Appendix 1 – Information Disclosure Requirements and
Appendix 2 – Consistency with Pricing Principles respectively.
Two separately published documents5 should be read in conjunction with this pricing
methodology:
MLL’s line delivery price schedule, which comprises a schedule of all prices for the various
consumer groups and price plans, including a breakdown of distribution and transmission
components, as well as applicable discount payment rates for the pricing year, and, the prior
year’s (DY21) line delivery prices for comparative purposes.
MLL’s line delivery price guidelines. The guidelines provide detail on the various consumer
groups, respective qualification criteria, and a breakdown of the prices for each consumer
group.
2. Consumer engagement
MLL undertakes regular consumer satisfaction surveys, to assess consumers’ views on MLL’s
performance. Included within the survey, are questions regarding the quality of the services
provided.
Separately, in December 2019, MLL conducted a distribution pricing survey of consumers
connected to its network.
2.1 Consumer satisfaction survey
The most recent consumer satisfaction survey was completed in August 2020. The survey
comprised 200 domestic consumers, and 30 commercial business managers. The surveys were
conducted over the phone with consumers by an external research firm.
The survey includes questions regarding consumers’ views on MLL’s performance regarding
service quality and reliability of the network. Key results from the survey include:
With respect to network reliability, the survey recorded a 95% satisfaction rate, which is
consistent with previous year’s results and the same as recorded in 2019. 2% of the
consumers surveyed were dissatisfied, up from 0% in 2019.
85% of consumers who could recall experiencing a fault were satisfied with the number of
faults that they had experienced, with 5% being dissatisfied.
5
Available on MLL’s website at https://www.marlboroughlines.co.nz/About-us/Disclosures/Pricing.aspx
Marlborough Lines Limited
Pricing Methodology for Disclosure Year 2022 6 Of the 64% of consumers surveyed who had experienced (or could remember experiencing)
an outage, 92% of those were satisfied with the duration of the outage (or length of time
taken to restore an electricity supply).
90% of consumers surveyed were satisfied with the annual discount payment, relatively
evenly spread across both the domestic and commercial consumers surveyed.
The survey results indicate that most consumers are satisfied with MLL’s performance,
particularly with respect to quality (reliability) and the discount payment made by MLL.
2.2 Distribution pricing survey
The purpose of this survey, undertaken in December 2019, was to:
Help MLL better understand the level of interest consumers had with respect to distribution
pricing, and their understanding of it; and
Assess whether the current pricing structure and prices were appropriate from the
consumers’ perspective, and whether there was a demand for a change to the existing
pricing structure.
2.2.1 Overview
In December 2019, MLL invited consumers to participate in a survey on electricity distribution
pricing. The survey comprised 11 short questions, allowing for selectable options (with
comments available to be made). Prior to issuing, the survey questions were passed to retailers
trading on MLL’s network for their review and to provide opportunity to raise any concerns. The
survey took on average five minutes for respondents to complete.
Information regarding the survey was included in MLL’s ‘Connections’ newsletter, which was
issued either via e-mail, or post, to all consumers6. Those who received the survey via e-mail,
simply needed to click a hyperlink within their email to access the survey. Those who received a
hard copy of Connections, were asked to visit MLL’s website and click on the distribution pricing
survey link on the homepage.
Table 1 presents a summary of the number of surveys issued (by means) and response rates.
Table 2 provides a breakdown of respondents by consumer type.
Table 1 – Summary of surveys issued and response rate.
Communications type Number sent Responses Response rate
E-mail 3,717 77 2.1%
Hard copy (posted) 17,640 35 0.2%
Total 21,357 112 0.5%
While the number of respondents was much lower than had been hoped for, a reasonable
sample size of responses has been obtained from the survey. Further, the lack of responses is
telling in itself – presented with an opportunity to comment on MLL’s distribution pricing, close
to 99.5% of consumers elected not to complete the survey.
6Noting that 21,257 individual persons (businesses or people) were issued a copy of the Connections newsletter – some
persons have multiple ICPs.
Marlborough Lines Limited
Pricing Methodology for Disclosure Year 2022 7Table 2 – Summary of respondents by consumer type
Consumer type Respondents (%)
Residential 88.3
Small to medium business 7.2
Large commercial/industrial 0.9
Irrigation 3.6
Information on the questions put to consumers, and the responses received are summarised in
the following sub-sections.
2.2.2 Views on quality with respect to prices
With regards to the power supply provided, consumers were asked whether they were satisfied,
dissatisfied, or had a neutral opinion on the reliability (number and duration of outages
experienced) of their electricity supply. 93% of responses were satisfied, with 7% neutral, and
0% dissatisfied.
82% of survey respondents were satisfied with the current pricing with respect to reliability. 16%
selected the option to pay less for decreased reliability, with 3% suggesting they would pay more
for increased reliability.
2.2.3 Understanding of cost of supply for remote consumers
Consumers were questioned whether they were aware that some of the areas of the network
cost more for MLL to supply than others. 71% of respondents were aware, 29% were unaware.
When asked whether they thought prices should reflect the cost of supply, i.e. should consumers
in remote areas, which typically have higher costs, pay more for those in urban areas, 61% of
respondents felt that there should be at least some sort of cost reflectivity in pricing (20% of
respondents felt that prices should be fully cost reflective for remote consumers).
2.2.4 Views on pricing structure
The survey asked consumers whether time of use pricing (i.e. a higher price during peak demand
periods, and lower price during low demand periods) would impact on their electricity
consumption. 8% of respondents were unsure, another 32% said that they would not adjust their
consumption behaviour, while 60% said that time of use pricing would at least have some
influence on their consumption behaviour.
One of the key survey questions was around the type of pricing preferred. Various types of pricing
– such as fixed price per day plus flat rate consumption vs TOU consumption, pricing based solely
on capacity, or pricing based on capacity – were listed along with explanatory notes. 40% of
consumers selected their preference as the existing pricing approach, i.e. fixed daily price with
flat rate consumption. Another 31% preferred a fixed daily charge with a price component that
varied by time (time of use), reflecting network demand.
2.2.5 Solar PV installation
Of the consumers surveyed, 17% indicated that they had solar panels installed at their premises.
A further 29% indicated that they were considering installing them in the future. The balance,
54%, had no intention of installing solar panels.
Marlborough Lines Limited
Pricing Methodology for Disclosure Year 2022 82.2.6 Summary
From the distribution pricing survey undertaken, MLL’s views formed are as follows:
a. While the response rate was disappointingly low, it is felt that the sample size is enough to
provide a representative view;
b. There is limited consumer understanding of distribution pricing, or certainly a lack of interest
in it;
c. Consumers are largely satisfied with MLL’s current pricing and quality;
d. Consumers believe that there should be an element of cost reflectivity based on the location
of a connection (i.e. that remote consumers should incur higher prices if it costs more to
supply them);
e. Some consumers feel that a time of use pricing option would be appropriate and influence
their electricity consumption; and
f. Many consumers’ views on solar installation are possibly misguided, for example 42% of
respondents thought that solar reduced their dependence on the network.
The survey responses are useful and for MLL, confirm that its current approach to pricing (both
structure and prices) is satisfactory to consumers connected to its network. However, consumers
views are only one of several considerations for MLL when determining its pricing.
2.3 Further consumer engagement
MLL is planning to again undertake its annual customer satisfaction survey during 2021. Prior to
doing so, MLL will review the content of the survey, particularly with respect to distribution
pricing and may ask questions more specific to prices.
Separately, MLL is considering other initiatives to engage with local consumers. MLL is intending
during the 2021 calendar year establishing a ‘stall’ at a local market or community event day,
whereby community members could participate in questionnaires relating to MLL’s
performance, particularly with respect to distribution pricing and quality (reliability) to confirm
whether there is broad support (or otherwise) for MLL’s distribution pricing strategy.
MLL will continue its approach of liaising with the larger Commercial and Industrial (and other)
consumers and offer those consumers the opportunity to speak about pricing to better
understand it and to raise any concerns.
3. Price setting
The setting of line delivery prices is multi-faceted. Existing (legacy) pricing structures need to be
considered, along with the nature of the network (cost to operate the network and network
capacity for example), the number and type of consumers connected, the assets servicing those
connections, the views of stakeholders including EDB peers, regulators and consumers for
example.
This section provides detail on how MLL sets its prices. Firstly, the splitting of consumers into
various consumer groups is summarised. Secondly, the costs forecast to be borne by MLL for the
pricing year are set out, along with the cost allocation methodology that is applied to the various
consumer groups. The target revenue for the year is also included in this section.
Marlborough Lines Limited
Pricing Methodology for Disclosure Year 2022 9To mitigate price shocks to consumers, MLL when making price changes, does so in an
incremental manner. The existing pricing regime has been in place for over ten years and
provides stability. For DY2022, however, MLL has introduced some pricing changes to be more
cost reflective, this is outlined in detail under Section 4.
3.1 Consumer groups
Typical of the electricity distribution sector, MLL separates consumers connected to its network
into the following categories:
Residential – those consumers that meet the definition of ‘domestic premises’ in relevant
legislation;
Residential (low fixed charge) – those consumers defined as ‘domestic premises’ in the Low
Fixed Charge Tariff Option for Domestic Consumers) Regulations 2004 (LFC regulations), who
consume 15kVA;
o Not located in areas deemed remote on MLL’s network7; and/or
o Not being a home that is serviced by a single line that serves few homes and no
other significant electricity consumers.
General – generally those consumers that do not meet criteria for other consumers groups.
These are typically small to medium businesses, but may also be residential dwellings used
for commercial accommodation purposes;
Commercial and Industrial – those consumers with installed capacity greater than 150kVA;
Irrigation – consumers where connections are to supply pumps for water irrigation or storage
purposes solely;
Unmetered – connections where metering is not installed to measure the volume of energy
consumed (due to its low volume and as it is cost prohibitive); and
Streetlights – connections supplying private or utility owned street lights.
These consumer groups are common throughout most EDB’s across New Zealand and have been
the basis of MLL’s pricing structure for many years.
Ambiguity can exist, particularly between the residential and general consumer groups. This is
particularly the case for holiday homes (of which there are many connected on MLL’s network,
particularly in the Marlborough Sounds), residential dwellings that are used to house workers,
and residential dwellings that are used primarily as a place of residence but from which also a
small business operates (and/or a bedroom is let out through ‘AirBnB’ for example).
In DY2021, MLL introduced remote price plan equivalents within the Residential group. This
allows MLL to more easily distinguish remote residential consumers who are ineligible for the
annual discount payment. For the first time, MLL has increased prices for these remote
residential consumers relative to the non-remote equivalents.
7A map showing remote areas is included on MLL’s website’s pricing page
https://www.marlboroughlines.co.nz/About-us/Disclosures/Pricing.aspx
Marlborough Lines Limited
Pricing Methodology for Disclosure Year 2022 10The method and way in which consumers are allocated to respective consumer groups is set out
in MLL’s Line Delivery Price Guidelines8.
3.2 Network statistics
Key network statistics for each consumer group is set out in Table 3. These statistics are used to
assist in the allocation of costs amongst these consumer groups. ICPs, billed units and kWh/ICP
are based on forecast amounts for the disclosure year. Capacity provided, peak demand, regional
peak demand (RPD) and assets are based on existing available information.
Table 3 – Summary of key network statistics by consumer group
RPD demand
Consumer group ICPs MWh/ICP Assets (%)
(MVA)*
Residential standard 11,038 16.9 8.5 23.7%
Residential remote 2,136 1.6 4.1 14.7%
Residential low user 9,093 8.7 5.3 12.0%
General 3,356 13.6 23.4 36.1%
Commercial and Industrial 129 19.1 1,100.0 8.4%
Irrigation 355 1.7 49.2 4.8%
Other (excl. MLL) 49 0.2 26.6 0.4%
TOTAL 26,156 61.8 - 100.0%
* Average from last three years
3.3 Forecast costs
3.3.1 Costs overview
Table 4 presents a summary of MLL’s regulated business costs for the disclosure year. Further
detail on each of these cost components is provided in the sub-sections that follow.
Table 4 – Summary of forecast costs for disclosure year with cost allocator type
DY2022 DY2021
Cost component Allocation type
($m) ($m)
Transmission (interconnection RPD) 6.1 6.0 Contribution to RPD
Transmission (connection and new investment) 0.9 0.9 Share of assets
Levies and Rates† 0.2 0.0 ICPs
Network operations, support and maintenance 12.0 10.9 Share of assets
Business support 4.2 4.2 MWh/ICP
Depreciation 9.6 9.9 Share of assets
Taxation 1.9 2.3 Revenue
Return on investment 11.8 11.2 Share of assets
TOTAL* 46.7 45.4 -
† included under Business Support in DY21
* Does not include forecast miscellaneous revenue of $0.6m, and, may not add due to rounding.
3.3.2 Transmission costs
Transmission costs comprise primarily the interconnection (regional coincident peak demand, or
RPD) charge, the connection charge, and new investment charges. The values charged to MLL by
8 Available at https://www.marlboroughlines.co.nz/About-us/Disclosures/Pricing.aspx
Marlborough Lines Limited
Pricing Methodology for Disclosure Year 2022 11Transpower vary due to their maximum allowable revenue (set by the Commerce Commission
through the ‘regulatory control period’ process).
3.3.2.1 Interconnection (RPD) charge
The interconnection, or RPD charge, which is clearly the most significant portion at $6.1m (up
from $6.0m from DY21), is dependent on MLL’s network load coincident with the 100 highest
half-hour upper South Island9 demands.
MLL’s approach to passing on the transmission charges to consumers is outlined as follows:
a. The aggregate demand during times of USI peaks by consumer group is determined. For mass
market consumers, this is averaged based on available consumption data.
b. A share of the RPD demand (percentage) is then allocated to each consumer group.
c. The average for this and the two preceding years share (i.e. three-year rolling average to
mitigate any year on year volatility) is then determined.
d. The RPD charge is then assigned to consumer groups based on the three-year average.
e. For non-Commercial and Industrial consumers, the costs are attributed typically to the
energy price components, to signal that the consumption has an impact on the total amount
of RPD charge borne by MLL.
f. For Commercial and Industrial consumers, whose direct impact on MLL’s network load
coincident with the 100 upper South Island half hourly peaks is known, an RPD value is
determined and applied from 1 April 2021.
g. The amount is calculated from averaging the half hourly demand between the months of
May and September (inclusive), on weekdays between 7.30am and 11am, and 4.30pm and
7.30pm. This is to signal that this is typically the time periods that upper South Island half
hourly peaks are set.
3.3.2.2 Connection and new investment charges
The connection and new investment charges are fixed, and for the disclosure year amount to
$0.9m (no change from DY21). These charges are allocated to consumer groups based on their
share of network assets.
3.3.3 Levies and Rates
A total of $0.2m for levies and rates has been forecast for DY22. This comprises local government
rates for properties owned by MLL, and Commerce Commission, Electricity Authority, and
Utilities Disputes levies. Note that within the DY21 Pricing Methodology, levies and rates were
included under Business Support.
Levy and rates costs are allocated by consumer group ICPs.
3.3.4 Network operations, support and maintenance expenditure
System operations and maintenance expenditure includes the types10 set as follows:
9 The current transmission pricing methodology splits RPD costs across four regions, the upper South Island being one of
these and comprises seven EDBs.
10 The operational expenditure types are in Commerce Commission’s ‘Electricity Distribution Information Disclosure 2012’.
Marlborough Lines Limited
Pricing Methodology for Disclosure Year 2022 12 Service interruptions and emergencies: Works relating to unplanned instantaneous events
impairing the normal operation of the network – i.e. work to rectify faults and ensure
electricity supply restored.
Vegetation management: Works involved with trimming or felling vegetation, including
inspections and liaising with landowners.
Routine and corrective maintenance and inspection: planned inspections, testing and
maintenance work schedules for assets.
Asset replacement and renewal: need to maintain network asset integrity to maintain safety,
security of supply and physical security of assets.
System operations and network support: management of the network, control room
operation and office-based system operations (asset management, customers, IT,
engineering, planning, asset related system management etc). comparative
As most of these costs are directly related to the assets servicing consumers, these costs have
been allocated based on each consumer groups’ share of network assets.
3.3.5 Business support expenditure
Business support activities, such as commercial, legal, finance, property and HR related work
(commonly referred to as administration and overhead costs) are related to MLL’s servicing of
all consumers and other company obligations. These shared costs are not directly attributable to
any consumer group, or consumer. As such, the number of ICPs and volume of energy consumed
has been combined for a cost allocator for business support costs.
3.3.6 Depreciation, taxation and return on investment
The depreciation expense relates to the annual estimated amount incurred, based on MLL’s
regulatory asset base. The taxation expense has been determined from the estimated revenue.
MLL has historically targeted an ROI lower than the weighted average cost of capital (WACC) rate
determined by the Commerce Commission for non-exempt EDBs. The post-tax WACC rate for
EBD’s for the five-year period to 31 March 2020 (at the 67th percentile) was 6.43%. DY2021 was
the first year of the new five-year DPP3 period, which has a post-tax WACC at the 67th percentile
of 4.23%.
This regulated WACC for DPP3 is lower than MLL’s cost of capital, as MLL targets a 5% post-tax
return on shareholders’ funds pre-discount payment and has no debt. Accordingly, MLL has
factored a post-tax 5% ROI into its costs. This approach to maintain a relatively consistent ROI
over time, assists MLL to maintain consistency with its prices across regulatory periods and avoid
price volatility to its consumers. MLL’s approach to targeted ROI is outlined further in section 4.1.
MLL’s forecast pre-discount ROI is 4.8%, reducing to 1.0% when the forecast discount payment
is allowed for. This is in line with previous years’ ROI, and well below the Commerce
Commission’s determined WACC value for non-exempt EDBs, when assessed net of posted
discounts.
3.4 Allocation methodology
3.4.1 Cost allocation by consumer group
Table 4 provides a summary of the costs by consumer group.
Marlborough Lines Limited
Pricing Methodology for Disclosure Year 2022 13Table 5: Summary of costs ($000) to recover through line delivery prices by cost component for each
consumer group
Residential
Comm &
Cost type General Irrigation Other Total
Industrial
Standard Remote Low
Transmission
interconnection 1,639 152 839 1,318 1,847 166 22 5,983
Transmission
connection & NIC 180 17 86 180 347 114 3 928
Fees and levies 84 16 69 26 1 3 0 199
Network Ops 2,809 1,742 1,425 4,277 991 569 42 11,855
Business Support 1,382 217 982 688 771 122 11 4,172
Depreciation 2,246 1,393 1,139 3,419 792 455 34 9,477
Taxation Expense 504 71 263 439 491 70 11 1,849
RoI 2,749 1,705 1,394 4,186 970 557 41 11,602
TOTAL 11,593 5,314 6,197 14,532 6,211 2,055 164 46,064
Note that miscellaneous revenue ($0.6m) has been netted off for the amounts included here.
3.5 Target revenue by price component
3.5.1 Prices overview
Revenue is typically recovered from consumer groups through a combination of fixed and
variable prices.
Fixed prices are generally set in $/day/connection, with the price varying based on the capacity
supplied for the connection. There will be variances between consumer groups for this (e.g.
Residential vs General), as the costs of supplying consumer groups can vary.
Variable prices are set in $/kWh of energy consumed. This is a flat rate and is not related to the
time of use (consumption). Different prices are available for controlled for uncontrolled energy,
with a night only rate (a form of time of use pricing) available for residential and general
consumers. For irrigation consumers, the variable prices vary seasonally. This is a longstanding
approach by MLL signalling that winter months are typically the time of year when network
demand is highest.
For Commercial and Industrial consumers, a peak demand-based price is the most significant
price component. As these consumers have time of use metering, and their electricity demand is
readily available, MLL can determine their maximum demand.
3.5.2 Price differentials
The setting of prices within consumer groups is subject to several considerations, are outlined as
follows.
Marlborough Lines Limited
Pricing Methodology for Disclosure Year 2022 14Table 6: Overview of price differentials applied to consumer groups
Consideration in price setting MLL’s approach
Existing/legacy prices Existing prices must be considered when changing prices. MLL carefully
considers the impacts on consumers of any price changes, and in doing so,
manages price “shocks”.
Price signalling For Residential and General consumers, MLL applies a price differential for
uncontrolled vs controlled energy. Controllable energy can assist in MLL
managing network peaks. MLL currently utilises load control to manage the
interconnection charge from Transpower, which is based on network peaks
coincident with Upper South Island grid peaks, rather than for managing any
local network constraints.
For an “average” domestic consumer, the difference (per annum) from
uncontrolled energy is $106.35 + GST ($492.75 vs $386.40).
MLL believes that the current price differential between uncontrolled and
controlled energy is appropriate. However, if in future MLL’s network
approaches capacity constraints, then MLL will consider if there is a higher
‘premium’ on controllable energy and whether further price separation may
be warranted.
Similarly, MLL believes that its price separation for various capacity options
offered within consumer groups is appropriate. Higher prices are applied
where a consumer requires greater capacity, reflecting that much of the
cost associated with the network is capacity related.
Retailer pass through While this does not influence MLL’s prices, MLL does have concerns that its
efforts to reform distribution pricing may somewhat be masked by the re-
bundling of distribution prices by electricity retailers.
3.5.3 Target revenue from prices
Table 7 provides a summary of target revenue vs costs by consumer group for DY22. Figure 1
then shows the breakdown in revenue by price type (fixed, variable, or capacity) and by
consumer group. Figure 2 highlights the change in the revenue from fixed pricing type from DY21
to DY22. Note the distinction in fixed vs variable for the low fixed charge residential consumer
group.
Table 7: Forecast costs vs target revenue by consumers group for DY2022
Target
Forecast Difference
Consumer group revenue ICPs
costs ($000) ($000)
($000)
Residential (excl. low fixed charge) 12,437* 11,593 845 11,038
Residential remote 1,753* 5,314 -3,561 2,136
Residential low fixed charge 6,459 6,197 262 9,093
General 10,788 14,532 -3,744 3,356
Commercial and Industrial 12,063 6,211 5,853 129
Irrigation 1,727 2,055 -328 355
Other 331 164 167 49
Total 45,557 46,064 -507 26,156
* Forecast revenue for Residential and Residential Remote approximated based on variable revenue price
components 10, 12 and 18 which are grouped across both consumer price plans.
Marlborough Lines Limited
Pricing Methodology for Disclosure Year 2022 15Figure 1 – Consumer group vs revenue type for DY22 forecast revenue.
Figure 2 – Comparative increase in percentage of fixed revenue by consumer group, DY22 vs DY21
In accordance with Clause 2.4.3 (8) of Information Disclosure, the proportion of target revenue
forecast to be collected through each price plan included in MLL’s pricing schedule for the
disclosure year, are set out in Appendix 3.
3.6 Non-standard contracts
MLL currently has one non-standard contract for the Waihopai hydropower station, which is
connected to and distributes energy through MLL’s network. The price is fixed under a contract
put in place in 1999 when MLL sold the generation assets to Trustpower. Price changes for each
disclosure year are recalculated based on CPI data and presented to Trustpower for review.
The target revenue for the year to 31 March 2022 is $72,319 (excluding GST).
MLL will consider non-standard contracts for consumers that do not readily meet the typical
criteria of consumers making up the consumer groups outlined in section 3.1, or, if the
Marlborough Lines Limited
Pricing Methodology for Disclosure Year 2022 16connection is one that is deemed to be higher revenue risk to MLL, and/or that could impart
significant additional cost on MLL.
If another non-standard contract was to be considered, MLL would set prices following detailed
financial analysis including a discounted cash flow, with due consideration of revenue risk. MLL
may consider other circumstances, at its discretion.
4. Distribution Pricing Roadmap (strategy)
MLL is cognisant of the drive for more cost reflective pricing, and the supporting rationale. MLL’s
view of cost reflective pricing is that a balance approached to this is needed, and that any reform,
needs to be carefully considered, and where implemented, transitioned in over time.
MLL is also aware of the Electricity Authority’s request for MLL to produce a distribution pricing
‘roadmap’, which effectively sets out MLL’s pricing strategy for relevant stakeholders, such as
electricity retailers and consumers. MLL first prepared a pricing roadmap in April 2017 and
provided an updated roadmap in the DY21 Pricing Methodology.
As has been highlighted in this pricing methodology, many of the connections on MLL’s network
are in areas that are rugged, and uneconomic to supply. As a result, there is considerable cross-
subsidy across consumers (both inter and intra group).
This year’s pricing sees a continuation of MLL’s pricing reform, through:
Where possible, shifting the balance of variable to fixed prices. MLL’s costs are generally
fixed for each additional unit of usage and therefore shifting the balance of pricing to fixed
is more cost reflective. As a proportion of total targeted fixed revenue, DY22 has increased
to 36.0% from 33.5% from DY21 (refer to Figure 1).
RCPD interconnection charges are treated as fixed, and have increased by $0.1m for DY22,
but this only represents 0.2% of total revenue.
The costs to supply MLL’s remote consumers is relatively high, both in terms of the capital
(assets) required to supply these consumers as well as ongoing operational costs, such as
fault and vegetation management, and maintenance inspections (particularly in single wire
earth return (SWER) networks which typically are in MLL’s remote areas).
The following sub-sections provide an overview of MLL’s pricing strategy, which in MLL’s view, is
essentially the roadmap towards distribution pricing reform that is appropriate for MLL and the
consumers connected to its network.
The pricing roadmap (objectives and timeline summary) that was included in the DY21 Pricing
Methodology is included in Section 4.4 and has been updated to reflect current status.
4.1 Pricing to allow an appropriate commercial return
One of the key strategic objectives of MLL’s pricing is that an appropriate commercial return is
made for MLL’s shareholder, the Marlborough Electric Power Trust. An appropriate return is one
that will consider:
The target return on shareholder funds set in MLL’s Statement of Corporate Intent;
The pre-discount returns set by the Commerce Commission for non-exempt EDBs; and
Marlborough Lines Limited
Pricing Methodology for Disclosure Year 2022 17 Smoothing across the end and beginning of five yearly regulatory periods. This is considered
important to mitigate the potential for significant step changes across regulatory periods,
and associated price volatility for consumers.
MLL is also duly aware of section 36 of the Energy Companies Act 1992, which requires that MLL,
as an EDB, has the principal objective of operating as a successful business. MLL interprets this
to mean that an appropriate return on its investment is therefore made. Making an appropriate
return on its investment underpins MLL’s pricing strategy.
4.2 Move towards more cost reflective pricing
MLL, subject to ongoing review of its pricing structure and prices, will continue its work in
reforming its distribution pricing. This will primarily be done through reducing existing inter and
intra consumer group cross subsidies, and through shifting the balance of prices from variable to
fixed. This is something that will be reflected over time, to minimise price shocks to consumers.
4.2.1 Variable to fixed (and ToU pricing)
As MLL’s costs are generally fixed in nature, MLL will look to shift the balance of its prices from
variable to fixed. This will be done over time to mitigate the potential for any price shocks. If
price increases are deemed appropriate when annually reviewed, where practicable increases
would be applied to the fixed price components. Conversely, if price decreases are applied, these
will generally be applied to variable price components.
For prices to apply from 1 April 2021, for an “average” domestic consumer, the proportion of
fixed revenue has increased from 45.5% to 48.0%.
Similarly, of the total targeted revenue to recover during DY22, the fixed proportion is 36.0%
which is an increase from 33.5% in DY21.
The LFC regulations, which limit MLL to recovering 15c/day for a low user residential consumer
(refer to Figure 1 and Figure 2 in section 3.5.3 for further detail).
4.2.1.1 ToU pricing
MLL considers that a variable price component is still appropriate, and during this disclosure year
will further review the way in which this is applied (i.e. moving from a flat to a time (of day and/or
time of year) based consumption variable price.
Many of New Zealand’s 29 EDB networks have moved or are moving to ToU based pricing. As a
provincial network, with minimal electric vehicle penetration, no significant network capacity
constraints, and an existing effective time of use controlled night price plan, MLL believes that
the urgency to introduce more complete time of use pricing is currently not present and that it
is better to observe outcomes from other EDBs who are implementing this pricing structure.
Of MLL’s approximately 26,150 connections, approximately 69% are AMI/HHR (advanced
metering/half hourly) metered with the balance non-half hourly (NHH).
4.2.1.2 Consideration for SSDG
Solar photovoltaic small-scale distributed generation (SSDG) is installed at approximately 2.5%
of MLL’s consumer connections as of March 2021 (up from 2.4% at March 2020). SSDG
Marlborough Lines Limited
Pricing Methodology for Disclosure Year 2022 18installations do not reduce MLL’s costs of operating its business and managing the network. The
reduction in electricity consumption at connections with SSDG, does reduce revenue generated
from variable price components (as revenue for variable price components directly relates to the
amount of electricity consumed). Shifting the balance of fixed to variable prices will help to
negate this impact, through minimising cross subsidy from consumers without SSDG to those
with SSDG.
The ability for MLL to negate this impact is restricted by the LFC regulations, as outlined in section
4.3.1.
Figure 3 illustrates the increased installed capacity of SSDG in recent years. While currently the
penetration levels of SSDG are not resulting in material revenue reduction for MLL, further
installations at current rates may impact MLL’s revenue materially. MLL is acting to address this
risk through shifting the balance of pricing from variable to fixed, for example.
Figure 3: SSDG capacity (kW) installed by calendar year (source: EMI website)
4.2.2 Location based pricing
Due to the nature of MLL’s network, there are many consumers connected that are uneconomic
to supply. Indeed, the variability in costs to supply an equivalent residential consumer (or other
consumer type) in urban Blenheim, is vastly less than those in areas such as D’Urville Island,
Forsyth Island, or the upper Wairau and Awatere Valleys.
Cost reflective pricing for MLL therefore should include an element of location-based pricing to
offset the effective cross-subsidisation that occurs.
For prices commencing 1 April 2021, MLL has introduced a price differential between remote
residential and non-remote residential consumer equivalents. Pre-discount line delivery price
amounts (excluding GST) per annum will be $1,058 and $1,027 for “average” remote and non-
remote residential consumers respectively.
MLL has, for now, only introduced a remote residential price plan (and not other consumer types
remote price plans) primarily because most connections in remote areas are residential. This will
Marlborough Lines Limited
Pricing Methodology for Disclosure Year 2022 19be reviewed over time, and particularly if Residential and General price plans are more closely
aligned, then a remote general price plan could be introduced.
4.2.3 A stable approach
MLL’s distribution pricing reform will include maintaining a degree of continuity/stability in
pricing, thus, any pricing reform proposed is cautiously considered, and if adopted, transitioned
incrementally over time to minimise impacts on consumers.
4.2.4 Transmission cost pass through
MLL will pass through transmission costs directly to consumer groups, based on consumer groups
consumption at coincident times of 100 USI peaks (rolling three-year average to smooth
volatility). Further detail on how the RPD allocations are determined is set out in section 3.3.2.1.
4.2.5 Alignment of Residential and General consumers
As part of its distribution pricing reform, MLL will further consider aligning the smaller (lesser
capacity) general price plan consumers, to the equivalent residential price plans (with respect to
the fixed price component).
4.2.6 Discount payments
Continue to use discount payments to demonstrate the benefits of consumer ownership. MLL
intends to continue its policy of making discount payments to eligible consumers connected to
its network.
For DY22, an eligible “average” domestic consumer would receive a discount payment of $236
(including GST).
The amount of the discount payment received by each consumer is dependent on eligibility, the
nature of the connection, the number of days connected, and, the amount of energy consumed
across the qualifying discount payment period.
MLL does not make a discount payment to consumers designated “remote”, for the reasons
outlined in this Pricing Methodology.
4.3 Other pricing reform considerations
Other industry and sector workstreams will have an impact on MLL’s (and other EDBs’)
distribution pricing reform.
4.3.1 Low fixed charge tariff
MLL eagerly awaits the final decision on the phasing out of the Electricity (Low Fixed Charge Tariff
Option for Domestic Consumers) Regulations 2004 (LFC regulations), which in MLL’s view has
been an impediment to more cost reflective pricing with its widely accepted unintended
consequences. MLL is encouraged by the outcomes of the Electricity Price Review, and
subsequent support from MBIE to commence a phase out of these regulations.
MLL believes that removal of this legislation will reduce intra-group subsidy for residential
consumers. By way of example:
Marlborough Lines Limited
Pricing Methodology for Disclosure Year 2022 20 Example 1 - A modern three-bedroom home is owned by a relatively high-income couple. It
has energy efficient lighting and appliances (including heating) and is well insulated. The
home has solar photovoltaic cells installed on their roof, reducing their daytime energy
consumption, particularly in summer months. Energy consumption is 6,000kWh per year and
the consumer is on the low fixed charge plan.
Example 2 – An older home is occupied by a large family (five children), who are dependent
on government financial assistance. The home is poorly insulated, has inefficient electrical
appliances (including heating) and lighting. Energy consumption is 10,000kWh per year.
In both instances, the connections are in the Blenheim township, and supplied by a three phase
30A connection, i.e. the costs for MLL to supply these connections is more or less the same –
MLL’s costs are not directly related to the amount of energy consumed by these two consumers.
The price comparison (based on prices for 1 April 2021) for the two examples is summarised in
Table 8.
Table 8: Cost comparison for a low fixed charge vs standard residential consumer
Example A – Low fixed charge Example B – standard residential
Price component consumer, 6.000kWh p.a. consumer, 10,000kWh p.a.
Rate Cost Rate Cost
Fixed charge $0.15/day $ 54.75 $1.35/day 492.75
Uncontrolled (60%) $0.1351/kWh $ 486.36 $0.0805/kWh 483.00
Controlled (40%) $0.1011/kWh $ 242.64 $0.0462/kWh 184.80
Total - $ 783.75 - $ 1,160.55
With the above example, the beneficiaries of the regulations are possibly not the consumers
intended, with the lower income family paying over $375 per annum more. While they consume
more energy (kWh), this does not necessarily mean an increase in costs to MLL, i.e., there is
disproportionate cost recovery between a low user vs standard residential consumer attributable
to the MLL’s adherence to the LFC regulations.
4.3.2 Other active workstreams in pricing
The Electricity Networks Association (ENA) has a current workstream that is developing a pricing
‘menu’, an approach to align price plans across EDBs. This work is currently in progress and has
sought input from ERANZ (Electricity Retailers Association of New Zealand). MLL will work with
other EDB’s and align its prices where practicable, if there can be demonstrable benefit to
electricity retailers and/or consumers, as well as EDBs.
The Electricity Authority’s Transmission Pricing Methodology (TPM) review work is ongoing. If
proposed changes to the TPM occur, this will impact the way in which Transpower recovers its
revenue from its customers, including MLL. Currently the majority of MLL’s Transpower costs
that are passed on to consumers are based on the RPD interconnection charge, it has been
signalled that this may be dissolved. This will have implications on the way in which MLL passes
on its transmission costs to its consumers and could result in price plan changes for irrigation
consumers for example.
Marlborough Lines Limited
Pricing Methodology for Disclosure Year 2022 214.3.3 Retailer pass through
While MLL acknowledges the importance of cost reflectivity, concerns remain that where prices
are set to influence consumers behaviour, consumers may not ultimately see this due to the re-
bundling of prices by electricity retailers, whom directly contract consumers.
As such, MLL is somewhat limited in its ability to ultimately influence consumers’ consumption
behaviour through its distribution prices.
4.4 Pricing reform timeline (indicative)
A summary of MLL’s distribution pricing reform timeline is presented in Table 9. This includes key
milestones targeted for discrete activities.
The DY21 pricing methodology committed that MLL would review and update the timeline. The
table has been updated to reflect progress to date on MLL’s pricing reform objectives.
Marlborough Lines Limited
Pricing Methodology for Disclosure Year 2022 22Table 9: Update to DY2021 timeline for discrete distribution pricing reform activities
Objective from DY21 Pricing Methodology Status Comments
Remote residential price plans introduced on 1 April
1 April 2020 – Introduction of remote residential consumer price plan.
2020.
Throughout DY2021 – undertake economic assessment of ‘remote’ consumers, including Analysis confirms significant under-recovery from
remote consumers.
Location based pricing
potential impacts on consumers of price changes.
Further consumer communications and engagement
Throughout DY2021 – formalise public strategy and communicate with consumers.
to be undertaken in DY2022.
1 April 2021 – confirm line delivery prices for DY2022 including price changes for remote Price changes notified to retailers, published to
consumers. newspapers, and effective from 1 April 2021.
DY2022 to DY2024, target alignment (subject to further analysis) of remote residential prices Further analysis to commence in DY2022.
with that of equivalent (capacity) general consumers prices.
DY2025 (to be confirmed), include remote General consumer price plan as per residential
Subject to further work, but for now, no change to objective.
consumer equivalents.
1 April 2021 – Commence discussions with electricity retailers regarding possibility of including
Discussions to commence Q2 DY22.
time of use pricing option in pricing from 1 April 2022.
Time of Use pricing
Reviewing findings from other EDBs’ experiences from introducing ToU pricing. Will seek out learnings from other EDBs Q2 DY22.
Engage with consumers, pending outcomes on discussions with retailers, to further determine Subject to discussions with Retailers but targeting early Q3
appetite for time of use pricing and to assist with their understanding of this pricing approach. DY22.
1 April 2022 - Introduce time of use price option for consumers (subject to above outcomes).
DY2023, monitor uptake of TOU pricing and change in consumption behaviour of consumers. Subject to achievement of above objectives/milestones.
1 April 2023, adjust TOU prices if and where appropriate following monitoring/analysis work.
Price changes from 1 April 2021 have seen an increase in fixed
As and when price changes are introduced, look to adjust prices such that fixed price components
Fixed
price components with a corresponding decrease in variable
increase relative to variable price components. prices. Refer Error! Reference source not found..
Objective/milestone achieved Yet to be actioned Objective/milestone partially complete and further work to do.
Marlborough Lines Limited
Pricing Methodology for Disclosure Year 2022 23You can also read