FULL-YEAR 2016 RESULTS - 8 March 2017 - Zonebourse
←
→
Page content transcription
If your browser does not render page correctly, please read the page content below
FULL-YEAR 2016 RESULTS
      8 March 2017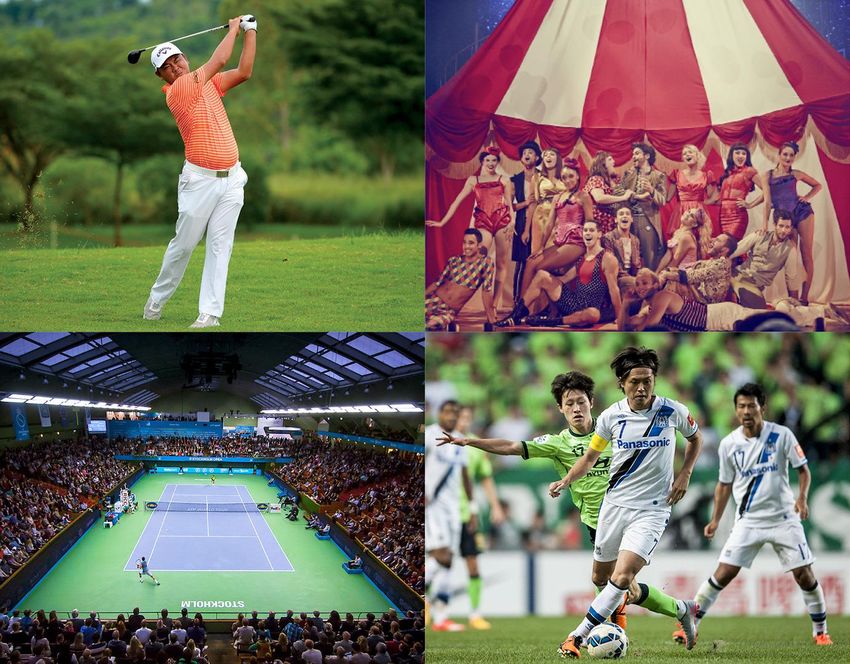
Full-Year 2016 Results / 8 March 2017

DISCLAIMER
Certain statements contained in this document are forward-looking statements (including objectives and trends), which address our
vision of the financial condition, results of operations, strategy, expected future business and financial performance of Lagardère SCA.
These data do not represent forecasts within the meaning of European Regulation No. 809/2004.
When used in this document, words such as “anticipate”, “believe”, “estimate”, “expect”, “may”, “intend”, “predict”, “hope”, “can”, “will”,
“should”, “is designed to”, “with the intent”, “potential”, “plan” and other words of similar import are intended to identify forward-looking
statements. Such statements include, without limitation, projections for improvements in process and operations, revenues and
operating margin growth, cash flow, performance, new products and services, current and future markets for products and services
and other trend projections as well as new business opportunities.
Although Lagardère SCA believes that the expectation reflected in such forward-looking statements are reasonable, such statements
are not guarantees of future performance. Actual results may differ materially from the forward-looking statements as a result of a
number of risks and uncertainties, many of which are outside our control, including without limitations:
• general economic conditions, including in particular growth in Europe and North America;
• legal, regulatory, financial and governmental risks related to the businesses;
• certain risks related to the media industry (including, without limitation, technological risks);
• the cyclical nature of some of the businesses.
No representation or warranty, express or implied, is made as to, and no reliance should be placed upon, the fairness, accuracy,
completeness or correctness of such forward-looking statements and Lagardère SCA, as well as its affiliates, directors, advisors,
employees and representatives accept no responsibility in this respect.
Please refer to the most recent Reference Document (Document de référence) filed by Lagardère SCA with the French Autorité des
marchés financiers for additional information in relation to such factors, risks and uncertainties.
Accordingly, we caution you against relying on forward-looking statements. The forward-looking statements abovementioned are made
as of the date of this document and neither Lagardère SCA nor any of its subsidiaries undertake any obligation to update or review such
forward-looking statements whether as a result of new information, future events or otherwise. Consequently neither Lagardère SCA
nor any of its subsidiaries are liable for any consequences that could result from the use of any of the above statements.

                                                                                                                                                2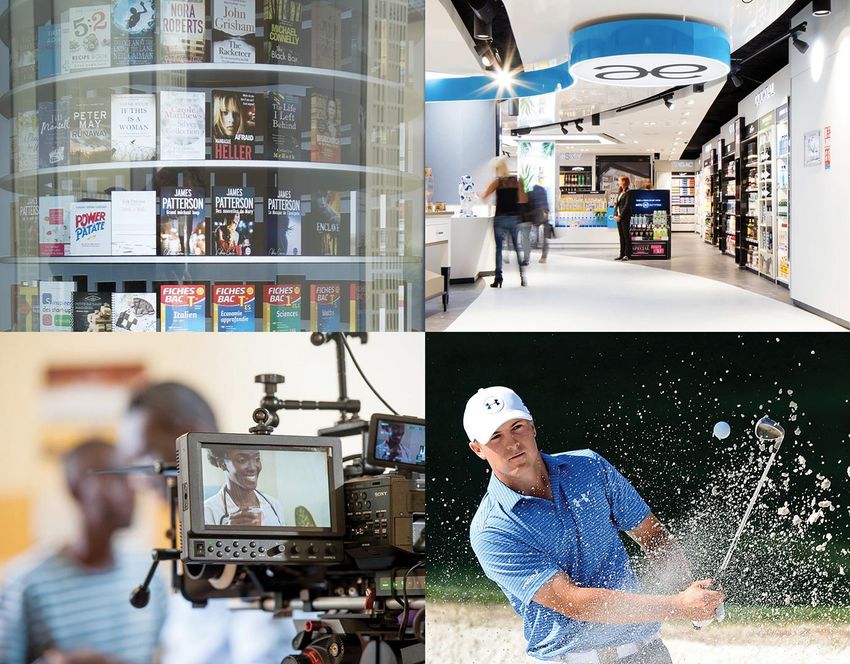
HIGHLIGHTS

Full-Year 2016 Results
     8 March 2017
Full-Year 2016 Results / 8 March 2017
HIGHLIGHTS
(€m) 2015 2016
+2.7% consolidated
Revenue 7,193 7,391 +2.5% like-for-like*
Continued strong Recurring EBIT of fully
organic growth 378 395 +4.6%
consolidated companies*
momentum in
Travel Retail Group operating margin 5.3% 5.3% ≈
Profit – Group share 74 175 +€101m
Solid performance
from Publishing
Adjusted profit – Group share 240 238 ≈
Free cash flow* 274 416 +€142m
Significant free
cash flow Net debt at end of the period (1,551) (1,389) +€162m
generation and
decrease in net Earnings per share (in €) 0.58 1.36
debt
Ordinary dividend per share (in €) 1.30 1.30**
*See definitions on slide 41.
**Ordinary dividend that will be recommended at the General Meeting of Shareholders on 4 May 2017.
4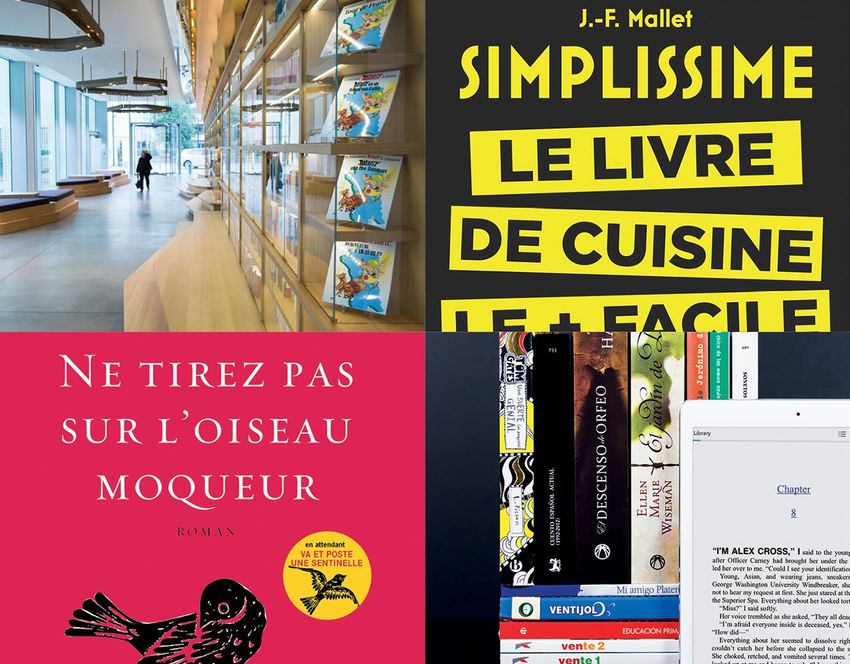
Full-Year 2016 Results / 8 March 2017

RECURRING EBIT
                                                                             +13.5%

             +€378m                                     +€353m                                   +€400m                  +€395m

                                    -€25m                                     +€47m                             -€5m

           2015 consolidated          LTR -               2015                Business              2016         FX    2016 consolidated
            Recurring EBIT         Distribution        Comparable            Performance         Comparable**            Recuring EBIT
                                   adjusment*

          *Effect of the disposals of the Swiss, US, Spanish, Canadian and Belgium activities.
          **Calculated using 2015 exchanges rates.                                                                                         5
2016
PERFORMANCE
 BY DIVISION

Full-Year 2016 Results
     8 March 2017
Full-Year 2016 Results / 8 March 2017
LAGARDÈRE PUBLISHING: ACTIVITY
2016 revenue by geographic area 2016 revenue by activity
Other Other Education
17% 15% 17%
17%* France 16%* 16%*
28%
Spain 29%* Illustrated
6% Partworks
Books
6%* 11%
13%
11%*
17%*
US & Canada UK & General
27% Australia Literature
25%* 22% 44%
23%* 40%*
€2,264m (up 2.6% on a consolidated basis and up 2.5% like-for-like).
Negative currency impact of €68m offset by a positive scope effect of €70m.
Robust performance driven by strong growth in General Literature in the UK and by the Education
segment.
*% of revenue in 2015. 7
Full-Year 2016 Results / 8 March 2017
LAGARDÈRE PUBLISHING: PROFITABILITY
Change in recurring EBIT (€m) and operating margin (%)
9.2%
9.0%
198 208
2015 2016
Profitability up by 0.2 points.
Disciplined cost management in the US produced higher profitability.
Partworks broke another record.
The huge success of Harry Potter and the Cursed Child more than offset the decline in digital revenue in
the UK.
The success of Astérix in 2015 created a challenging comparison effect.
8
Full-Year 2016 Results / 8 March 2017
LAGARDÈRE TRAVEL RETAIL: ACTIVITY
2016 revenue by geographic area 2016 revenue by activity
US & Canada Distribution
Asia- (Wholesale Distribution
21% Pacific & Integrated Retail)
9%* 10% 15%
10%* 27%*
Eastern
Europe Travel Retail
17%
France 85%
17%*
22% 73%*
23%*
Other
Western
Europe
Italy Belgium
8%
8% Spain 11%
11%* 3%
8%* 12%*
10%*
€3,695m (up 5.3% on a consolidated basis and up 5.0% like-for-like).
Negative currency effect of €21m offset by a positive scope effect of €50m.
Figures below are presented like-for-like.
Travel Retail activity up 7.1%, driven by network expansion, rollout of new concepts and a dynamic
commercial policy.
Distribution down 3.8%. Full disposal completed on 7 February 2017.
*% of revenue in 2015. 9
Full-Year 2016 Results / 8 March 2017
LAGARDÈRE TRAVEL RETAIL: PROFITABILITY
Change in recurring EBIT (€m) and operating margin (%)
2.9%
2.9%
2.7% 68 Travel Retail
95 3.0%
Distribution
3.5% 34
13 2.4%
2015 2016
Travel Retail profitability (excluding Distribution) up 0.3 points.
€27m increase at Travel Retail, which was buoyed by the integration of new activities and robust
momentum in North America, including historical activities. Growth in Italy, Romania, Czech Republic
and Iceland mitigated the impact of terrorist attacks in Europe.
€21m decrease in Distribution (mainly due to the disposal of the Swiss, US, Spanish, Canadian and
Belgian activities). 10Full-Year 2016 Results / 8 March 2017
LAGARDÈRE ACTIVE: ACTIVITY
2016 revenue by geographic area 2016 revenue by activity
Other
International Radio
17% 22%
13%* 21%*
Spain
7% Press
6%* France 38%
76% 41%*
81%*
TV
32%
32%*
Pure Players
& BtoB
8%
6%*
€915m (down 4.9% on a consolidated basis and down 5.4% like-for-like).
Positive scope effect of €6m. Negative currency effect of €2m.
Decline in Advertising and Circulation, in line with market trends.
Good momentum in Music Radio in France and internationally.
Unfavourable comparison effect for Lagardère Studios owing to strong rights sales in 2015.
*% of revenue in 2015. 11Full-Year 2016 Results / 8 March 2017
LAGARDÈRE ACTIVE: PROFITABILITY
Change in recurring EBIT (€m) and operating margin (%)
8.2% 8.5%
79 78
2015 2016
Profitability up 0.3 points.
Consolidation of Grupo Boomerang and cost efficiency plan offset the negative trend in Magazine
Publishing and unfavourable delivery phasing in TV Production, as well as financing organic growth
in e-health segment. 12Full-Year 2016 Results / 8 March 2017
LAGARDÈRE SPORTS AND ENTERTAINMENT: ACTIVITY
2016 revenue by geographic area 2016 revenue by activity
Rest of World France
21% 21% Media rights
25%*
21%
13%*
26%*
Other
35%
32%*
Asia &
Australia
18% Germany
17%* 18%
22%*
Marketing
rights
Rest of Europe UK 44%
14% 8% 42%*
14%* 9%*
€517m (up 0.3% on a consolidated basis and up 1.5% like-for-like).
Slight negative currency effect of €4m and negative scope effect of €1m.
Another year with robust performance.
*% of revenue in 2015. 13Full-Year 2016 Results / 8 March 2017
LAGARDÈRE SPORTS AND ENTERTAINMENT: PROFITABILITY
Change in recurring EBIT (€m) and operating margin (%)
3.9% 3.9%
20 20
2015 2016
Recurring EBIT stable, as anticipated.
Recurring EBIT stable at €20 million reflects the focus on the improvement of the portfolio of activities,
offset by a slightly less favourable mix of football events.
142016
GROUP RESULTS
Full-Year 2016 Results
8 March 2017Full-Year 2016 Results / 8 March 2017
CHANGES IN CONSOLIDATED REVENUE – 2016
(€m) +185
+2 7,391
-47
+58
7,193
2015 Lagardère Lagardère Lagardère Lagardère Sports 2016
Revenue Publishing Travel Retail Active and Entertainment Revenue
Revenue up 2.7% on a consolidated basis, up 2.5% like-for-like.
Top-line growth largely driven by Lagardère Travel Retail (up €185m) and Lagardère Publishing (up €58m).
Positive scope effect of €124m and negative currency effect of €95m.
16Full-Year 2016 Results / 8 March 2017
RECURRING EBIT TO EBIT
(€m) 2015 2016
378 395
314
194 174
11 10 20 0
(27)
(77) (62) (90) (69) (82)
(113)
Recurring
Income from Restructuring Gains (losses) Impairment Cricket litigation
EBIT of fully Amortisation** EBIT
equity-accounted costs on disposals losses in India
consolidated
companies*
companies
*Before impairment losses.
**Amortisation of acquisition-related intangible assets and acquisition-related expenses. 17Full-Year 2016 Results / 8 March 2017
EBIT TO PROFIT – GROUP SHARE
(€m) 2015 2016
314
174 175
74
3
(37) (21)
(66) (49)
(69)
Profit
EBIT Net interest Income tax attributable Profit – Group
expense expense to minority share
interests
18Full-Year 2016 Results / 8 March 2017
ADJUSTED PROFIT – GROUP SHARE
(€m) 2015 2016
Profit – Group share 74 175
Restructuring costs* +56 +76
Gains (losses) on disposals* (24) (149)
Impairment losses on goodwill, PP&E and intangible assets* +62 +84
Amortisation of acquisition-related intangible assets and other
+48 +47
acquisition-related expenses*
Cricket litigation in India (WSG) +19 -
Tax contribution on dividends paid to shareholders +5 +5
Adjusted profit – Group share 240 238
*Net of taxes.
19Full-Year 2016 Results / 8 March 2017
CONSOLIDATED STATEMENT OF CASH FLOWS
(€m) 2015 2016 Operating cash performance
significantly up:
Cash flow from operations before changes in working capital 447 557 +25% following +11% last year
Changes in working capital 180 26 Non-recurring items in 2015
Net interest paid and income taxes paid (103) (125) Higher taxes due to disposals
Net cash from operating activities 524 458 Continued investments
especially in Travel Retail
Purchases of property, plant & equipment and intangible assets (259) (253) (> 50% of total capex)
Disposals of property, plant & equipment and intangible assets 9 211 Disposal of property assets
Free cash flow 274 416
Purchases of investments (568) (108) Paradies acquisition in 2015
Disposals of investments (59) 133
Net cash from operating and investing activities (353) 441
Dividend paid and other (244) (279)
Positive cash generation
Change in net debt (597) 162 post dividend
Net debt (1,551) (1,389)
20Full-Year 2016 Results / 8 March 2017
CONSOLIDATED BALANCE SHEET
Assets* Liabilities
(€m) Dec. 2015 Dec. 2016 Dec. 2015 Dec. 2016
2,135
2,035 Shareholders’ equity
Intangible assets 3,322
3,109
1,551
1,389 Net debt**
Other assets 1,589 1,448 1,098 1,113 Other liabilities
Working capital 2,762 2,712 2,889 2,732 Working capital
7,673 7,269 7,673 7,269
*Excluding assets included in net debt.
**Net of cash, cash equivalents, short-term investments and derivative instruments documented as hedges of debt. 21Full-Year 2016 Results / 8 March 2017
FINANCING POLICY
Strong cash flow generation and tight rein … and preserving a stable dividend policy
on debt benefiting to leverage ratio…
Historical dividends (€/share)
Leverage ratio
Net debt/Recurring EBITDA*
Ordinary dividend per share (€)
€1,551m Extra dividend per share (€) 9.0
6.0
€1,389m 5.4%*
1.3 1.3 1.3 1.3 1.3 1.3 1.3 1.3 1,3 1,3
2.4x 2.2x 2007 2008 2009 2010 2011 2012 2013 2014 2015 2016
**
*Dividend yield based on €24.27 closing price on 06/03/2017.
Long-term stability of the ordinary dividend per share.
31/12/2015 31/12/2016
Friendly shareholder policy post exceptional disposals.
Attractive ordinary yield in the current interest rate
environment.
*See definition on slide 41.
**On a proforma basis (as per credit facility covenant), including 12 months
of Paradies’ recurring EBITDA. On a reported basis, the ratio is 2.6x. 22Full-Year 2016 Results / 8 March 2017 CONCLUSION In 2016, Lagardère outperformed its initial Group recurring EBIT growth target*. 2017 guidance “Group recurring EBIT growth is expected to be between 5% and 8% versus 2016, at constant exchange rates and excluding the impact from disposals of Distribution activities.” *As announced in March 2016. 23
APPENDICES TO
CONSOLIDATED
  ACCOUNTS

 Full-Year 2016 Results
      8 March 2017
Full-Year 2016 Results / 8 March 2017
CHANGES OF SCOPE: MAIN ITEMS
Lagardère Publishing
• Acquisition of the Perseus Books Group’s publishing business in April 2016.
• Acquisition of Neon Play in June 2016.
• Disposal of 51% of YenPress in May 2016 (equity-accounted since 1 June 2016).
• Disposal of Harlequin (joint venture) in March 2016.
Lagardère Travel Retail
• Disposal of the Spanish press distribution business SGEL in February 2016.
• Disposal of Canadian press distribution assets in May 2016.
• Disposal of the Belgian press distribution business in December 2016.
Lagardère Active
• Disposal of our 49% in S.E.T.C. (cable satellite TV magazine) in May 2016.
• Disposal of LeGuide.com Group in October 2016.
Lagardère Sports and Entertainment
• Disposal of the Endurance division in March 2016.
25Full-Year 2016 Results / 8 March 2017 CONSOLIDATED INCOME STATEMENT (€m) 2015 2016 Revenue 7,193 7,391 Recurring EBIT of fully consolidated companies* 378 395 Income from equity-accounted companies** 11 10 Non-recurring/non-operating items (215) (91) Total EBIT 174 314 Net interest expense (66) (49) Profit before tax 108 265 Income tax expense (37) (69) Total profit 71 196 Attributable to minority interests (3) 21 Profit – Group share 74 175 *Recurring EBIT of fully consolidated companies of the four operating divisions + other activities. **Before impairment losses. 26
Full-Year 2016 Results / 8 March 2017

ANALYSIS OF NON-RECURRING/NON-OPERATING ITEMS IN 2016
                                                                                      Lagardère
                                        Lagardère     Lagardère          Lagardère    Sports and      Other           Total        Total
 (€m)                                   Publishing   Travel Retail         Active    Entertainment   Activities       2016         2015

 Recurring EBIT of fully
                                              208             108              78              20          (19)           395         378
 consolidated companies

 Income from equity-accounted
                                                 1               5               4               /                /           10       11
 companies

 Restructuring costs                          (10)           (29)             (55)            (11)          (8)          (113)       (77)

 Gains (losses) on disposals                   21              55                3              1          100            180          20

 Fair value adjustment resulting
                                                 8                   /           3              3                 /           14           /
 from changes in control

 Impairment losses                               /           (31)             (53)             (6)                /       (90)       (62)

 Amortisation of acquisition-related
 intangible assets and acquisition-            (6)           (72)                /             (4)                /       (82)       (69)
 related expenses

 Cricket litigation in India (WSG)               /                   /           /               /                /            /     (27)

 EBIT                                         222              36             (20)              3            73           314         174
                                                                                                                                               27
Full-Year 2016 Results / 8 March 2017
GROUP PROFILE – 2016
Revenue by division Recurring EBIT of fully consolidated companies by division
Lagardère Sports and Entertainment Lagardère Sports and Entertainment
7% 5%
Lagardère Lagardère
Active Publishing Lagardère
12% 31% Active
19%
Lagardère
Publishing
50%
Lagardère
Lagardère Travel
Travel Retail
Retail 26%
50%
Revenue by geographic area 2015 Revenue by geographic area 2016
US & US &
Canada Canada
13% 20%
Eastern France
Europe France 30%
10% 32%
Eastern
Asia- Europe
Pacific 10%
8%
Other Asia-
3% Pacific
9%
Western Western
Europe Other Europe
34% 2% 29%
Emerging countries: 21% Emerging countries: 21% 28Full-Year 2016 Results / 8 March 2017
RECAP OF PERFORMANCE BY DIVISION
Revenue
Consolidated Consolidated
2016 Like-for-like change*
(€m) €m change change
Lagardère Publishing 2,264 +€58m +2.6% +2.5%
Lagardère Travel Retail 3,695 +€185m +5.3% +5.0%
Lagardère Active 915 -€47m -4.9% -5.4%
Lagardère Sports and Entertainment 517 +€2m +0.3% +1.5%
Total 7,391 +€198m +2.7% +2.5%
Recurring EBIT of fully consolidated companies
Consolidated Consolidated Change at constant
2016 exchange rates**
(€m) €m change change
Lagardère Publishing 208 +€10m +5.0% +7.1%
Lagardère Travel Retail 108 +€6m +5.6% +40.5%
Lagardère Active 78 -€1m -1.4% -0.8%
Lagardère Sports and Entertainment 20 +€0m +0.5% +1.6%
Other Activities (19) +€2m +12.3% +12.3%
Total 395 +€17m +4.6% +13.5%
*At constant scope and exchange rates. / **At constant exchange rates, excluding disposal of LTR Distribution. 29Full-Year 2016 Results / 8 March 2017
MAIN EQUITY-ACCOUNTED COMPANIES
Balance sheet Income statement*
2015 2016 2015 2016
(as of (as of (as of (as of
31/12/2015) 31/12/2016) 31/12/2015) 31/12/2016)
(€m)
Marie Claire (42%) 90 77 - (10)
Édition J’ai Lu (35%) 17 17 - 1
Société de Distribution Aéroportuaire (50%) 16 10 7 3
Inmedio (49%) 11 12 2 1
YenPress (49%)** - 10 - -
Société des Commerces en Gares (50%) 3 2 (1) (1)
Société d’Édition de Télévision par Câble (49%)*** 8 - - -
Saddlebrook 4 5 - -
Other associates 6 12 1 (2)
TOTAL 155 145 9 (8)
*Including impairment losses: €13m (Marie Claire), €5m (other associates) in 2016; €2m in 2015 (other associates).
**Equity accounted since June 2016 (previously fully consolidated by Hachette Book Group).
***Sale of SETC in May 2016.
30Full-Year 2016 Results / 8 March 2017
CASH FLOW STATEMENT DATA – LAGARDÈRE PUBLISHING
(€m) 2015 2016
Cash flow from operations before changes in working capital 202 234
Changes in working capital 3 50
Net interest paid and income taxes paid (32) (59)
Net cash from operating activities 173 225
Purchases of property, plant & equipment and intangible assets (50) (38)
Disposals of property, plant & equipment and intangible assets 2 11
Free cash flow 125 198
Purchases of investments (9) (90)
Disposals of investments 2 23
Net cash from operating and investing activities 118 131
31Full-Year 2016 Results / 8 March 2017
CASH FLOW STATEMENT DATA – LAGARDÈRE TRAVEL RETAIL
(€m) 2015 2016
Cash flow from operations before changes in working capital 161 194
Changes in working capital 50 7
Net interest paid and income taxes paid (42) (47)
Net cash from operating activities 169 154
Purchases of property, plant & equipment and intangible assets (122) (147)
Disposals of property, plant & equipment and intangible assets 7 7
Free cash flow 54 14
Purchases of investments (485) (3)
Disposals of investments (95) 47
Net cash from operating and investing activities (526) 58
32Full-Year 2016 Results / 8 March 2017
CASH FLOW STATEMENT DATA – LAGARDÈRE ACTIVE
(€m) 2015 2016
Cash flow from operations before changes in working capital 68 63
Changes in working capital 107 1
Net interest paid and income taxes paid (44) (40)
Net cash from operating activities 131 24
Purchases of property, plant & equipment and intangible assets (14) (14)
Disposals of property, plant & equipment and intangible assets - 2
Free cash flow 117 12
Purchases of investments (50) (5)
Disposals of investments 3 6
Net cash from operating and investing activities 70 13
33Full-Year 2016 Results / 8 March 2017
CASH FLOW STATEMENT DATA – LAGARDÈRE SPORTS AND ENTERTAINMENT
(€m) 2015 2016
Cash flow from operations before changes in working capital 32 84
Changes in working capital 28 (46)
Net interest paid and income taxes paid (15) (24)
Net cash from operating activities 45 14
Purchases of property, plant & equipment and intangible assets (72) (53)
Disposals of property, plant & equipment and intangible assets 0 0
Free cash flow (27) (39)
Purchases of investments (22) (7)
Disposals of investments 31 11
Net cash used in operating and investing activities (18) (35)
34Full-Year 2016 Results / 8 March 2017
CONSOLIDATED BALANCE SHEET
31 Dec. 31 Dec.
(€m) 2015 2016
Non-current assets 4,672 4,183
Investments in equity-accounted companies 155 145
Current assets 2,846 2,779
Short-term investments and cash 634 481
Assets held for sale - 162
TOTAL ASSETS 8,307 7,750
Stockholders’ equity 2,135 2,035
Non-current liabilities 800 794
Non-current debt 1,526 1,041
Current liabilities 3,187 3,022
Net debt decreased from
Current debt* 659 829
€1,551m to €1,389m
Liabilities associated with assets held for sale - 29
TOTAL LIABILITIES AND EQUITY 8,307 7,750
*Including €3m of derivative assets. 35Full-Year 2016 Results / 8 March 2017
OFF-BALANCE SHEET COMMITMENTS
(€m) 2015 2016
Commitments to purchase shares from third parties
1 3
(other than minority interests)
Commitments given in connection with ordinary activities:
- contract guarantees and performance bonds 288 301
- guarantees in favour of third parties or
115 133
non-consolidated companies
- other commitments given 21 6
Commitments received:
- counter-guarantees of commitments given 7 3
- other commitments received 20 2
Mortgages and pledges 1 0
36Full-Year 2016 Results / 8 March 2017
LAGARDÈRE SPORTS AND ENTERTAINMENT
GUARANTEED MINIMUM PAYMENTS
At 31 December 2016 entities forming part of Lagardère Sports and Entertainment had guaranteed minimum future
payments amounting to €1,326m under long-term contracts for the sale of TV and marketing rights.
These payments break down as follows by maturity:
Maturity 2022
2017 2018 2019 2020 2021 Total 2015
(€m) & beyond
Guaranteed minimum
payments under sports
182 163 158 154 90 579 1,326 1,456
rights marketing
contracts
At 31 December 2016 the amounts due under marketing contracts signed by these same entities with broadcasters
and partners amounted to €1,780m, breaking down as follows by maturity:
Maturity 2022
2017 2018 2019 2020 2021 Total 2015
(€m) & beyond
Sports rights marketing
contracts signed with
515 404 257 185 74 345 1,780 1,679
broadcasters and
partners
37Full-Year 2016 Results / 8 March 2017
LAGARDÈRE TRAVEL RETAIL
GUARANTEED MINIMUM PAYMENTS
At 31 December 2016 entities forming part of Lagardère Travel Retail had guaranteed minimum future payments
amounting to €1,859m under concession agreements.
These payments break down as follows by maturity:
Maturity 2022
2017 2018 2019 2020 2021 Total 2015
(€m) & beyond
Guaranteed minimum
payments under 339 297 258 224 197 544 1,859 1,405
concession agreements
38Full-Year 2016 Results / 8 March 2017
RECURRING EBITDA – OVER 12 ROLLING MONTHS
(€m) 2015** 2016
Total recurring EBIT of fully consolidated
378 395
companies*
Depreciation & amortisation of intangible assets and
+207 +225
property, plant and equipment
Dividends received from equity-accounted companies +13 +19
Total recurring EBITDA 598 639
Paradies adjustment 51 /
Total recurring EBITDA on a proforma basis* 649 639
*See definitions on slide 41.
**On a proforma basis (as per credit facility covenant), including 12 months of Paradies’ recurring EBITDA.
39Full-Year 2016 Results / 8 March 2017
OUTSTANDING DEBT & MATURITY PROFILE
Gross debt breakdown in 2016: Preservation of liquidity and well balanced debt
strong direct access to credit investors repayment schedule
11%
9% Bonds
Authorised
Bank loans & other
credit lines**
Commercial paper €1,250m €829m
€501m €514m
80% Cash*
€481m €6m €13m €7m
Cash 2017 2018 2019 2020 2021 2022 &
available beyond
*Short-term investments and cash.
**Group credit facility excluding authorised credit lines at divisions level.
40Full-Year 2016 Results / 8 March 2017
DEFINITIONS
Recurring EBIT of fully consolidated companies is defined as the difference between profit before finance costs and tax
and the following items of the profit and loss statement:
• income (loss) from equity-accounted companies;
• gains (losses) on disposals of assets;
• impairment losses on goodwill, property, plant and equipment and intangible assets;
• restructuring costs;
• items related to business combinations:
- expenses on acquisitions;
- gains and losses resulting from acquisition price adjustments and fair value adjustment resulting from changes in control;
- amortisation of acquisition-related intangible assets.
Like-for-like revenue is calculated by adjusting:
• 2016 revenue to exclude companies consolidated for the first time during the year, and 2015 revenue to exclude companies divested
in 2016;
• 2016 and 2015 revenue based on 2015 exchange rates.
Free cash flow is defined as: cash from/(used in) operating activities plus purchases/disposals of intangible assets and property,
plant and equipment.
Recurring EBITDA is defined as recurring EBIT of fully consolidated companies added with:
• depreciation and amortisation of property, plant and equipment and intangible assets;
• dividends received from equity-accounted companies.
41SIGNIFICANT
EVENTS
Full-Year 2016 Results
8 March 2017Full-Year 2016 Results / 8 March 2017
BACKGROUND AND OVERALL PERFORMANCE
Printed books market growing worldwide (in volume)…
• -1.8% in France.
• +2.3% in UK.
• +3.3% in US.
… as e-books decline.
Lagardère Publishing revenue up 2.6% to €2,264 million.
Recurring EBIT increased by €10 million to €208 million.
43Full-Year 2016 Results / 8 March 2017
FRANCE
First of two curriculum years puts revenue and margins of Education divisions back on track.
Fall fiction and non-fiction lists successful:
• Petit pays: 370,000 copies sold;
• Un Président ne devrait pas dire ça: 220,000 copies sold.
Ilustrated segment boosted by huge success of cook book as art therapy declines slowly
• Simplissime:
- 450,000 copies sold in France alone;
- 8 spin-offs bring total to 1.32 million copies in print in France;
- 12 translations;
- 15 countries.
44Full-Year 2016 Results / 8 March 2017
INTERNATIONAL MARKETS
United Kingdom
Hachette UK phenomenally successful with:
• Harry Potter and the Cursed Child: 4 million copies in print;
• Fantastic Beasts and Where to Find Them: 1 million copies in print;
• Famous Five for Grown-Ups: 1.5 million copies in print;
• Education (print & digital);
• Illustrated (Pokémon, Art Therapy).
United States
Hachette Book Group on its way back to high profitability thanks to:
• rigorous cost control;
• massive presence on best seller lists:
- 215 print titles on New York Times lists (up 18% vs. 2015);
- Hamilton: 475,000 copies at $40 retail price;
• Perseus integrated seamlessly and contributing as planned.
Spain & Latin America
• Solid year due to ongoing curriculum reform and tight cost control.
Partworks
• Outstanding performance across all geographies, especially Japan.
45Full-Year 2016 Results / 8 March 2017
DIGITAL
E-books revenue keeps falling.
• In US: market down by 16%.
- Hachette Book Group down by 6% (excl. Perseus).
• In UK: market down by 19%.
- Hachette UK down by 9%.
Slower decline in both countries vs. markets due to high % of best sellers in Hachette Book Group and Hachette UK lists.
Lagardère Publishing’s total exposure to digital now at 8%, vs. 9% in 2015.
Strong growth of audio books in both markets.
Acquisition of Neon Play and Brainbow, UK mobile gaming startups, for cross-fertilisation with all imprints.
Acquisition of Bookouture, Britain’s leading independant e-book publisher.
46SIGNIFICANT
EVENTS
Full-Year 2016 Results
8 March 2017Full-Year 2016 Results / 8 March 2017
A SUCCESSFUL TRANSFORMATION
IFRS consolidated revenue and recurring EBIT (€m at current rate, 2011-2016)
+58%
+10% CAGR
3,132
1,986
1,738
IFRS
consolidated 563 Distribution
revenue Travel Retail
2011 2016
+137 bps
+24% CAGR
95
72
33
Recurring
EBIT 13 Distribution
Travel Retail
2011 2016
Source: Lagardère Travel Retail internal data. 48Full-Year 2016 Results / 8 March 2017
STRONG GROWTH IN TRAVEL RETAIL OVER THE PAST FIVE YEARS
2016 2016 vs. 2011
€3.6bn
proportional revenue* +€1.5bn prop. revenue
€209m x2.5 prop. rec. EBITDA
proportional recurring
EBITDA**
32 countries +13 countries
232 airports
16,000 employees +112 airports
*Travel
Retail scope only, proportional revenue includes Lagardère Travel Retail share in joint ventures.
**Recurring
operating EBITDA after head office costs.
Source: Lagardère Travel Retail internal data. 49Full-Year 2016 Results / 8 March 2017
KEY DEVELOPMENTS
Successful integration and good performances of the new acquisitions, mainly Paradies and JFK T4 in North America.
New concessions start-up, mainly:
• New Zealand: Auckland Duty Free (late June 2015);
• China: Kunming master concession (August 2015);
• Poland: Warsaw T1 (May 2015), Krakow Duty Free (September 2015);
• Luxembourg Duty Free (November 2015);
• Iceland: Foodservice operations (March 2015).
New developments, mainly:
• EMEA: Abu Dhabi: 9 stores gained in Foodservice; Saudi Arabia: 3 Duty Free concessions awarded in Riyad, Dammam and Djeddah
in partnership with local partners; Poland: master concession won at Gdansk airport; acquisition of Duty Free business in Estonia (late
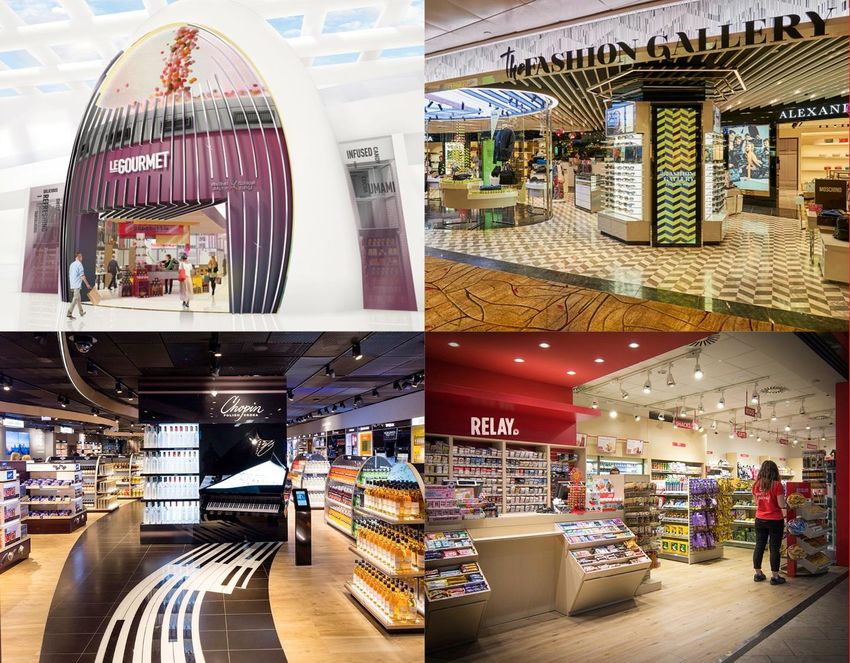
October 2016); Italy: opening of 5 Relay stores and gain of 3 concessions in Foodservice at Rome airport in the Avancorpo Terminal
(opening on 21 December); UK: London-Luton: renewal and expansion of the Duty Free concession (mid-April 2016);
• North America: gain of 3 packages at Phoenix airport and 1 Food & Beverage package at San Francisco airport;
• ASPAC: Singapore: gain of Fashion concession of Terminal 2; China: Foodservice master concession won at Kunming airport and
Retail master concession won at Wuhan airport; Pacific: Cairns Duty Free tender won.
Success of the new concepts and of the marketing and commercial initiatives.
Negative impact of the terrorist attacks in Europe (Paris in November 2015, Brussels in March, Nice and Germany in July).
Lower spend of BRICs passengers (FX volatility).
50Full-Year 2016 Results / 8 March 2017
KEY ACTIVITIES
IFRS consolidated revenue 2015-2016, €m at current rate
Source: Lagardère Travel Retail internal data.
Focus on EMEA
+23.0% +6.5%
€2,546m €3,132m €1,897m €2,020m
France
EMEA
Italy
Poland
Czech Republic
North America
Other
ASPAC
Pure player in Travel Retail, with Distribution divestment process completed: disposal of the Spanish, Canadian and Belgian activities
in 2016 and sale, on 7 February 2017, of the Distribution holding: LS Distribution (including the operating activities in Hungary).
At constant scope and exchange rates, the traffic evolution combined with the development of the network, the modernisation of the
concepts and successful commercial initiatives (including Paradies top-line synergies), generated sustained growth at Travel Retail
revenue (up 7.1%) despite a difficult geopolitical and macroeconomic situation.
Total like-for-like revenue increased by 5.0%, the strong performance of Travel Retail being partly absorbed by the decline of Distribution
(down 3.8%).
The growth in passenger traffic (up 5.5%)* remains solid but below last year’s growth (6.1%). Growth remains strong in Europe (up 4.5%),
North America (up 4.1%) and Asia-Pacific (up 9.3%). The trend in passenger traffic in France swung back since December 2016 after
the Paris terrorist attacks in November 2015.
*Source: ACI data: Europe: +4.5% vs. +5.2%, Asia-Pacific: +9.3% vs. +8.0%, and North America: +4.1 % vs. +5.3% (at 31 October 2016 vs. 31 December 2015). 51Full-Year 2016 Results / 8 March 2017
FRANCE
Travel Essentials and Foodservice
• 100% revenue up 1.6%:
- strong performance of the Foodservice activities: up 10.2% (dynamic network expansion with openings in railway stations, airports
and hospitals); compensating the lower revenue in gifts and souvenirs (down 9.9%), impacted by the decrease in traffic at the Eiffel
Tower and Paris airport souvenirs stores, following the terrorist attacks.
Duty Free & Fashion
• 100% revenue down 4.4% driven by a 4.5% decrease at Paris airports related to:
- less qualitative Pax (Japanese, Chinese, Brazilian, Indonesian and Russian) following the terrorist attacks;
- unfavorable euro exchange rate (against RMB/USD/Ruble/Pound);
- the decline of Chinese spend per passenger (fall of the Chinese stock market, biometric visa implementation, tax on imported goods,
on-going impact of anti-corruption measures).
• Offset by the modernisation of concepts (e.g. new walkthrough in Nice) and the positive impacts of commercial initiatives.
52Full-Year 2016 Results / 8 March 2017
EMEA
Italy
• Revenue up 6.7% with strong performances in the 3 business lines.
Poland
• Poland’s total revenue at 100% grew by 18%, with Duty Free activities up 34%, Travel Essentials up 12% and Foodservice up 19%.
• This positive trend is driven by the successful opening of Warsaw airport − Terminal 1 stores in May 2015 and the take-over of
the Duty Free concession at Krakow airport at the end of September 2015, as well as strong traffic growth in all Polish airports
(Warsaw: up 14.5% in 2016).
Czech Republic
• Revenue up 5.3%, with the continuing development of the Foodservice network (up 14%), along with a dynamic Travel Essentials
performance (up 4.4%). Duty Free is flat (down 0.5%), with the decrease in Russian passengers’ spend offset by the successful
commercial initiatives and growth from other nationalities.
Other EMEA countries posted vigorous growth with a 10.4% rise in revenues (UK: up 17%; Netherlands: up 10%;
Romania: up 20% and full impact of the new countries: Iceland and Luxemburg).
53Full-Year 2016 Results / 8 March 2017
NORTH AMERICA, ASIA AND PACIFIC
North America
• Very strong growth of Retail activities in Canada and the United States is driven by the acquisition of Paradies in November 2015 and,
to a lesser extent, by the JFK T4 acquisition in April 2015.
• The comparable network grew by 9.7% with positive developments at the Los Angeles, Austin and Dallas platforms, some early
impacts of commercial synergies, and a favourable calendar impact (53rd week).
• The Paradies integration process is well advanced and delivering results as per plan; the expected level of synergies is confirmed.
Asia
• Revenue grew by 5.3%, driven by China with sales up 28.3% thanks to the success of the new strategy in place since 2015.
This growth comes from the sustained development of the Fashion activities in all airports (Shenzhen, Xi’an, Kunming).
• Hong Kong and Singapore have been affected by unfavorable changes in traffic flows and heavy construction works.
Pacific
• Total revenue in the Pacific grew by 9.5% versus 2015:
- growth was driven by Duty Free (up 57%) with the take-over of the Auckland Duty Free concession in late June 2015, as well as
network development (Victoria’s Secret, MAC and Amuse concepts in different locations);
- Travel Essentials revenue down 9.1%, following the closing of the Sydney T1 concessions and the decline in print products.
54SIGNIFICANT
EVENTS
Full-Year 2016 Results
8 March 2017Full-Year 2016 Results / 8 March 2017
BACKGROUND AND OVERALL PERFORMANCE
As part of its strategic plan aimed at:
• strengthening its positioning as a premium multi-media group;
• bringing together leading brands in their segments, with considerable digital and diversification potential;
• prospecting in some cases for international development.
In 2016, Lagardère Active developed its flagship brands and:
• rebalanced the portfolio in favour of audiovisual activities notably with the success of music radio in France and international radio.
Audiovisual sales now represents the majority of the revenue for the second year in a row;
• seized international opportunities around Lagardère Active Radio International and TV business and successfully integrated
Grupo Boomerang TV in Lagardère Studios;
• expanded digital media, enhanced data offers and developed outside media business, including B2B services with notably ambitious
development in e-health business;
• consolidated its strong positions by expanding its shares on contracting markets, notably magazines;
• focused on operating performance improvement through cost-containment measures.
56Full-Year 2016 Results / 8 March 2017
MAGAZINE PUBLISHING
Global audience* growth (i.e on all devices: print, computer, smartphones and tablets) for our main brands: Elle (up 5.2%);
Paris Match (up 11.2%) and Télé 7 Jours (up 6%).
In a depressed print advertising market (down around 7.5%), Elle remained leader in high-end women’s magazines:
27.4% market share high above its main competitors. Flagship publications such as, Elle à Table, Elle Décoration, Télé 7 Jours
and Le Journal du Dimanche were also leaders on their competitive segments.
In a declining circulation market (down 3.2%**), our main titles performed better than their market segment. Elle displayed the
best trend among the high-end women’s magazine segment.
Digital: Public and Télé 7 Jours were still among the leaders of their segments and Elle audience continued to grow (up 5%).
Launches in licensing activity:
• Elle Décoration in Vietnam;
• several spin-offs on wedding and kids;
• Ellekazakhstan.com website;
• e-shop in China under the Elle brand;
• new international events (Elle International Beauty Awards, Elle Déco International Design Awards, Elle Active Japan, Elle Active China
and Elle Active Italy).
In March 2016, announcement of a reorganisation project related to press magazine, advertising sales brokerage and some
corporate departments. The voluntary redundancy plan opened mid-year. By the end of January 2017, 70% of the potential plan
was achieved.
*Source: ACPM; One Global 2016 T4 vs. One Global 2016 T3. / **Source: ACPM/OJD 2016. 57Full-Year 2016 Results / 8 March 2017 RADIO Global radio advertising trend remained stable thanks to good performances of musical activities (up 6.9%) and international radio (up 4.0%). Europe 1 • Audience suffered during 2016 mainly from the departure of historical radio-program presenters. • Key challenge to build a global media from several assets: 16h/day of high quality video recorded and published, 8.4 million unique visitors on all supports, still successful with more than 11 million/month podcasts uploaded. Virgin Radio • Strong performance on the last wave, with 2,781,000 listeners and a cumulative audience of 5.2%*: highest score over the past 8 years. RFM • Success thanks to diversified musical programming and guests quality: 2,334,000 listeners/day and 3.1%* audience share. Lagardère Active Radio International (LARI) • Advertising revenue increased significantly in 2016 in largest countries, notably Poland and Romania. • Major radio player position maintained in Central and Eastern Europe and strengthened positions in West Africa with Vibe Radio launched in September 2014 in Senegal and September 2015 in Ivory Coast. • Ongoing development strategy of radio networks into new growth markets and regions: acquisition in May 2016 of stakes in two radio stations broadcasting in Cambodia (one radio rebranded Vibe Radio in July 2016). • Digital offer upgrade: 10 million unique visitors/month (up 86% over the year) and 43 million page views (up 30% over the year) at end 2016. *Médiamétrie; November-December 2016. 58
Full-Year 2016 Results / 8 March 2017
TELEVISION ACTIVITIES
TV CHANNELS
Gulli, broadcasting in HD since April 2016, remains the leader in audiences on the 4-10 years’ old target on the French
television market, ahead of TF1 and France 4 (the state-owned kids channel).
Distribution agreement renewal with CanalSat and all French internet providers (Free, Orange, Bouygues), including
the exclusive launch of the new channel Elle Girl on CanalSat.
International developments in Canada and in the USA with Mezzo, and in the Middle East, Honduras and Burma with Gulli.
TV PRODUCTION AND DISTRIBUTION: LAGARDÈRE STUDIOS
In France, Lagardère Studios remains the no.1 producer of scripted content and the no.2 of non-scripted programs:
• two new prime time series pilots (Agathe Koltès and Tandem – France 3) aired in 2016. Their first season will be aired in 2017.
Another new prime time series was produced for France 2 in 2016 and will be aired in 2017;
• worldwide success for Midnight Sun coproduced by Atlantique Productions (Lagardère Studios) and Nice Media for Canal+ and SVT;
• improvement of daily news magazine C dans l’air performance despite the departure of its historical anchorman.
In Spain, Boomerang TV continued to perform well in 2016:
• good ratings for the daily scripted series El Secreto de Puente Viejo and Acacias 38 in Spain and in Italy. The two shows are now
as popular in Italy as they are in Spain;
• success for recurrent non scripted programs (La Voz, Casados a primera vista).
Other international developments occurred in 2016 with the production in H2 2016 of the second season of C’est la vie,
an African scripted TV series produced by Keewu to be delivered in 2017 and the increase of 26% of distribution agreements
managed by Diffa, Lagardère Studio’s African program distribution arm.
59Full-Year 2016 Results / 8 March 2017 DIGITAL PURE PLAYERS Websites and applications operated for offline brands (Elle, Europe 1, Gulli, Public and Télé 7 Jours) and pure player brands (Doctissimo.fr, BilletRéduc.com, Boursier.com). One of the leading media groups in audience, with more than 15 million unique visitors (UVs)* in France on Internet fixed-line and 13 million UVs on mobile**. Ambitious development strategy in e-health, including both organic developments and acquisitions: • Doctissimo.fr: leading website on e-health and wellbeing with nearly 9.8 million UVs***. Position strengthened with the creation of a unique ecosystem within e-health. • MonDocteur.fr: one of the leading French online booking websites for medical consultations and publisher of medical appointments software for professionals. Fast pace expansion, with more than 1.5 million appointments/month and subscriber base (health care professionals and institutions), a four-fold increase during 2016. BilletRéduc.com, leader in France for cut-price online bookings, continues to grow with the launch of a new application for smartphones. *Médiamétrie; December 2016. **Médiamétrie; November 2016. ***Global Médiamétrie Measurement (mobile+landline+apps); November 2016. 60
SIGNIFICANT
  EVENTS

Full-Year 2016 Results
     8 March 2017
Full-Year 2016 Results / 8 March 2017 BUSINESS UNITS (1/2) Football Europe • Successful delivery of key elements for the UEFA Euro 2016 tournament: - development, organisation and management of the Fan Zone Tour Eiffel; - design and execution of activation programs for partners; - official hospitality sales agent for six territories. Football Africa • Total became the title sponsor for the Confédération Africaine de Football’s (CAF) ten main competitions and Orange renewed its relationship with CAF as an official sponsor of five major CAF competitions. • Continued sales efforts on the CAF program. Football Asia • Lagardère Sports managed the marketing and media rights for AFF’s biennial tournament the AFF Suzuki Cup. • Continued sales efforts on the AFC program. Golf • Success of the SMBC Singapore Open 2016 headlined by world number one and Lagardère Sports athlete Jordan Spieth. • Lagardère Sports successfully organised the Safeway Open for the first time (PGA Tour event). Olympics and Major Events • Contributed to the success of the Rio Olympic Games on behalf of clients including the Australian Olympic Committee, French Olympic Committee, broadcasters across 40 European territories and over 1,500 hospitality clients as well as Top Partners activation programs. • Commissioned by the Budapest 2024 Summer Olympic and Paralympic Games Bid Committee to lead an international consortium, to advise the city on its bid to host the 2024 Olympic Games. 62
Full-Year 2016 Results / 8 March 2017
BUSINESS UNITS (2/2)
Media
• Exclusive multi-year deal from 2016 to 2020 with the International Table Tennis Federation (ITTF) to sell the media rights to all its
events worldwide (excluding China, Japan, Singapore and Taiwan).
• Renewal of several contracts for the media distribution rights to various ATP 250 events as well as extending our portfolio.
Endurance
• Disposal of Endurance business to Ironman, effective since April 2016.
Consulting and Digital
• Continued focus on organic growth.
• Acquisition in France of Sponsorship 360 in December 2015, an agency dedicated to delivering solutions to brands in order to create
communication platforms through sports.
• Acquisition of the New York-based agency Rooftop2 Productions - the latest company to join our global network of consulting agencies.
Athlete Management
• Five of our clients were selected during the first round of a very successful NFL draft.
• Long-term agreement with leading NFL agent and President of Football (NFL) Joel Segal.
Live Entertainment
• Production of entertainment show, Love Circus will return to the Folies Bergère, while the magician, Enzo l’Insaisissable can be seen
at the Casino de Paris.
• Successful re-opening of the Bataclan.
63Full-Year 2016 Results / 8 March 2017
CALENDAR OF EVENTS 2015/2016
2015 2016
1st Quarter 2nd Quarter 3rd Quarter 4th Quarter 1st Quarter 2nd Quarter 3rd Quarter 4th Quarter
WCQ 2018 World Cup
CAN CAN qualifiers 2017 CAN qualifiers 2017
FOOTBALL & CAN U23 qualifiers 2018
AFRICA CHAN & Futsal AFCON Women AFCON
Super Cup Confederation Cup & African Champions League Super Coupe Confederation Cup & African Champions League
AFC Champions League & AFC Cup AFC Champions League & AFC Cup
WCQ 2018 Asia AFC 2018 WC Qualifiers
FOOTBALL Gulf Club Championship Women U19 AFC champion’s Round 2
League & AFC Cup
AFC WCQ U17 AFC WCQ U20
ASIA President’s Cup Finals Futsal Cup
AFC Asian Cup AFC Futsal Championship
AFC Futsal Club AFC Women U23 AFC
GCC U23 competition U16 Championship AFC Cup qualifiers AFF Suzuki Cup
FOOTBALL Season 15/16 Season 16/17
Season 14/15 Season 15/16
EUROPE UEFA Euro 2016 Rio 2016
GOLF Ladies European
Nordea Master Australian Open Singapore Open Nordea Master Safeway Open Australian Open
Tour
Triathlon Cape Town Chicago Triathlon &
Triathlon Motatapu Stockholm Velothon
& Auckland Music Run Hamburg
London Triathlon & Queenstown Activity sold
ENDURANCE Hamburg marathon Hamburg Triathlon, Marathon
Vattenfall Classic &
Berlin Garmin & Stockholm Triathlon
Wales Velothon
ATP + WTA Båstad & WTA Finals Singapore & ATP + WTA Båstad & WTA Finals Singapore &
TENNIS Citi Open Stockholm Open Citi Open Stockholm Open
MEDIA Rio 2016
OLYMPIC
Roland Garros African Games Roland Garros
OTHER Alpine Skiing Handstar Game Alpine Skiing
KIA X Games 2015 Brazzaville Fan Zone Euro 2016
64FULL-YEAR 2016 RESULTS
8 March 2017You can also read