Feasibility of Google Tango and Kinect for Crowdsourcing Forestry Information - MDPI
←
→
Page content transcription
If your browser does not render page correctly, please read the page content below
Article
Feasibility of Google Tango and Kinect for
Crowdsourcing Forestry Information
Juha Hyyppä 1 , Juho-Pekka Virtanen 1,2, *, Anttoni Jaakkola 1 , Xiaowei Yu 1 , Hannu Hyyppä 1,2
and Xinlian Liang 1
 1    Finnish Geospatial Research Institute, Geodeetinrinne 2, FI-02430 Masala, Finland;
      juha.coelasr@gmail.com (J.H.); anttoni.jaakkola@nls.fi (A.J.); xiaowei.yu@nls.fi (X.Y.);
      hannu.hyyppa@aalto.fi (H.H.); xinlian.liang@nls.fi (X.L.)
 2    School of Engineering, Aalto University, P.O. Box 14100, FI-00076 Aalto, Finland
 *    Correspondence: juho-pekka.virtanen@aalto.fi; Tel.: +358-50-405-7791

 Received: 20 November 2017; Accepted: 16 December 2017; Published: 21 December 2017

 Abstract: In this paper, we demonstrate the feasibility of using the Microsoft Kinect and Google
 Tango frame-based depth sensors for individual tree stem measurements and reconstruction for the
 purpose of forest inventory. Conventionally field reference data in forest inventory are collected
 at tree and sample plot level by means of manual measurements (e.g., a caliper), which are both
 labor-intensive and time-consuming. In this study, color (i.e., red, green and blue channels, RGB)
 and range images acquired by a Kinect and Tango systems were processed and used to extract
 tree diameter measurements for the individual tree stems. For this, 121 reference stem diameter
 measurements were made with tape and caliper. Kinect-derived tree diameters agreed with tape
 measurements to a 1.90 cm root-mean-square error (RMSE). The stem curve from the ground to the
 diameter at breast height agreed with a bias of 0.7 cm and random error of 0.8 cm with respect to
 the reference trunk. For Tango measurements, the obtained stem diameters matched those from
 tape measurement with an RMSE of 0.73 cm, having an average bias of 0.3 cm. As highly portable
 and inexpensive systems, both Kinect and Tango provide an easy way to collect tree stem diameter
 and stem curve information vital to forest inventory. These inexpensive instruments may in future
 compete with both terrestrial and mobile laser scanning or conventional fieldwork using calipers
 or tape. Accuracy is adequate for practical applications in forestry. Measurements made using Kinect
 and Tango type systems could also be applied in crowdsourcing context.

 Keywords: laser radar; remote sensing; forestry; Kinect; DBH; point cloud; mobile laser scanning

1. Introduction
     Mapping forest resources and their condition has great economic and ecological importance.
Especially so, as trees contribute significantly to the carbon balance of the Earth. International interest
in biomass detection is strongly linked to forest health, photosynthetic activity and other processes
related to the carbon cycle and the variability of the climate [1]. There is a growing need and constant
shortage of data for improved forest monitoring (e.g., [2]). Furthermore, forest inventory provides an
input for forest operations, forest management, and related decision making. Retrieval of forest canopy
and stand information for large areas has been mainly carried out using remote sensing, especially
space-borne techniques [3,4], but has increasingly shifted towards airborne laser scanning (ALS) [5–9].
Forest inventories based on remote sensing data depend on the quality and quantity of field data
collected on sample plots, which are used to calibrate remote sensing measurements, and to reduce
the systematic (i.e., bias) and random errors of estimates. Reference data for sample plots is today
mainly collected by manual measurements, although there is active research towards applying e.g.,
Terrestrial Laser Scanning (TLS), Mobile Laser Scanning (MLS) or Personal Laser Scanning (PLS) for

Forests 2018, 9, 6; doi:10.3390/f9010006                                              www.mdpi.com/journal/forests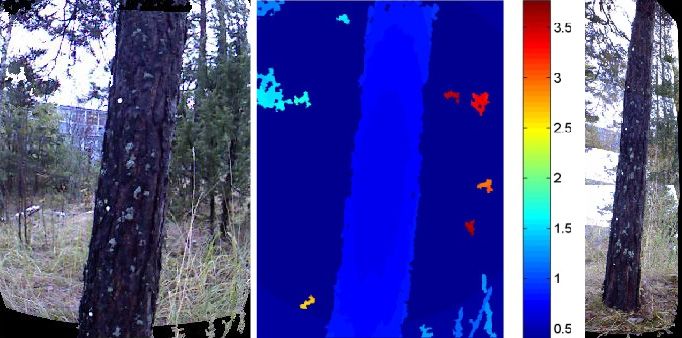
Forests 2018, 9, 6                                                                                   2 of 14

plot level inventory. The attributes measured in operational forest field reference inventories are
mainly the number of trees, tree species and Diameter at Breast Height (DBH). The latter is measured
using simple tools, such as calliper and measuring tape. As these conventional field measurement
techniques are expensive and labor-intensive [10,11], more cost-effective, automated techniques are
needed. Even though the DBH is currently the most important attribute measured in ground surveys,
it would be beneficial to measure the stem curve, or at least a part of it, as the stem curve actually
defines the 3D geometry of the tree trunk. At this moment, the extraction of stem curve is one of the
main research focus from TLS and MLS data, see [12] for an example.
      Geographic crowdsourcing is collection of geospatial data by voluntary citizens, untrained in
the disciplines of geography, cartography or related fields [13,14]. In forestry, crowdsourcing has
been applied in assessing condition of city trees [15,16], even though some questions concerning the
reliability of such has been raised [17]. By utilizing applications potentially useable in crowdsourcing
scenarios, a basal area accuracy of 5 m2 /ha [18], RMSE for basal area of 19.7–29.3% [19] and DBH root
mean squared error of less than 7 cm [20] have been achieved.
      Large-area forest inventory estimates can be calculated based on either area based approach
(ABA) or individual tree detection (ITD) approaches using ALS data. In Finland, ALS itself is available
as open data, but there is a lack of open plot- or tree-level data for calibrating the ALS estimates. While
the ALS data can reliably produce e.g., tree height estimates for dominant trees, it suffers from not as
good depiction of suppressed trees, and issues in identification of adjacent trees when located very
close to each other. These errors can be compensated with plot level reference data. Today, this lack
of local reference data causes the largest misestimation under boreal conditions. ITD techniques
operate by detecting individual trees, with tree-level variables, such as height and volume, measured
or predicted from the ALS data. In these analyses, the basic unit is an individual tree. International
comparisons of the use of ALS for ITD have been reported in [21–23]. Advantage of the ITD approach
over area-based approach (ABA) in crowdsourcing context is that it requires a smaller amount of
reference trees, compared to that in ABA, for reasonable accuracy. It is also easier for the land-owners
to measure physically well-established parameters, such as the diameter of the tree (cm) instead of
the basal area (m2 /ha). In addition, the common disadvantage of ITD approaches of not being able
to detect all suppressed trees, that are poorly observable through the above canopy, can be partially
overcome by the use of crowdsourcing, by including the missing major trees of ALS interpretation.
Thus, there is synergy between the ITD and crowdsourcing.
      Originally commercialized as an accessory for the Xbox (Microsoft Corporation, Redmond,
WA, USA) 360 game console, Kinect (Version 1, 2010, Microsoft Corporation, Redmond, WA, USA)
is a structured light system capable of capturing several millions of data points per second, with an
affordable and easily applicable consumer-grade device. It incorporates color and near-infrared
cameras, as well as a near-infrared laser projector. It projects a pseudo-random pattern on the target
and uses the parallax information to calculate distance from the target. It is capable of producing
640 by 480 pixels depth images at 30 frames per second, with a maximum measurement distance of
about 4 m.
      Kinect has been applied in various applications, such as indoor mapping (e.g., [24–28]). A benefit
of Kinect is that it efficiently brings 3D sensing capability to any conventional computer, thus allowing
application development. The use of Kinect for tree measurements has been proposed for forestry
robots [29,30], and plot level data collection [31]. With Kinect, individual tree diameters with 4.4 cm
and 9.2 cm accuracies for deciduous and coniferous trees have been attained.
      Depth sensors fully integrated to mobile devices have also emerged, with the Google Tango (2014,
Google Inc., Menlo Park, CA, USA) technology [32] being available on two consumer devices. Tango is
a development platform aiming to bring depth sensing to mobile devices. It consists of standardized
application programming interfaces (APIs) to utilize depth sensor in Android software development.
Tango framework allows the depth sensing to be accomplished by stereo vision, structured light,
or time-of-flight principle [33]. As integrated systems, Tango enabled devices allow 3D sensing on a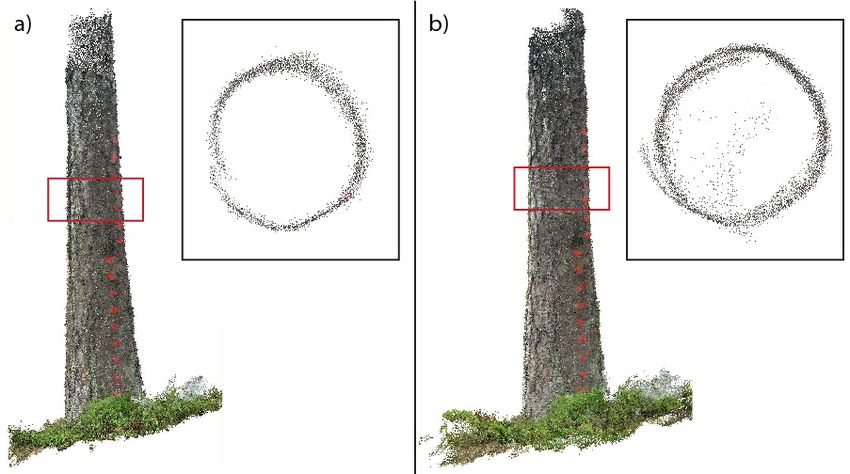
Forests 2018, 9, 6                                                                                    3 of 14

highly mobile platforms, utilizing sensor integration and Simultaneous Localization and Mapping
(SLAM) for 3D measuring [34]. Devices with Tango sensors have in research been applied to indoor
mapping [35], interior planning [36] and forestry [37].
     While Tango and Kinect rely on similar operating principles, they offer different possibilities
for application. Kinect is operated on a regular computer, and can thus be integrated to other
tasks & software. Field tasks are possible when using a laptop or a tablet PC. Tango represents
a fully integrated mobile system akin to a mobile phone camera, making it more suited for mobile
tasks and crowdsourcing. Both of these consumer-level technologies could be applied for collecting
objective, non-biased reference information, later applicable for remote sensing inventories. To give
an example, there are more than 600,000 forest owners alone in Finland (12% of the population).
Many of them visit their forests regularly or live in the nearby area. If 0.1% of these forest
owners would measure 20 trees each, from their own forests, the resulting data set would consist
12,000 individually measured trees, producing an accurate, non-biased countrywide biomass/volume
map of unprecedented accuracy.
     Our objective is to firstly show the value of utilizing a local field reference for ITD forest inventory
from ALS data by evaluating its impact to forest inventory estimate errors, and secondly, demonstrate
the feasibility of Microsoft Kinect and Google Tango sensors for collecting stem geometry data on
an individual tree level. Compared to working with a measuring tape, Microsoft Kinect or Google
Tango represent efficient and potentially user-friendly ways to obtain diameter measurements and
directly produce digital information. Finally, we test if these sensors could also provide stem curve
information, potentially allowing an even higher accuracy of field data.

2. Materials and Methods

2.1. Test Area and Field Reference
     Three test sites are utilized in the study, one (Masala) being used for Kinect and Tango studies,
and two (Evo & Kalkkinen) for evaluating the impact of local field reference data.
     The test area for the Kinect and Tango studies is located in Masala, Kirkkonummi, in southern
Finland near the Finnish Geospatial Research Institute. As ground truth, reference data were measured
with tape and caliper. The accuracy of diameter measurements using the calliper has been earlier
analyzed to be about 0.7 cm by repeating measurements for a large number of trees and assuming the
measurements are independent and of equal accuracy [38]. Since the tree stem cross-sections are often
ellipses rather than perfect circular, it is conventional to measure the diameters in both north-south
and east-west directions with calliper and then average the two measurements, calculating the square
root of the average of squared values. We also used tape to record the circumference of each tree.
Measurements were taken at different heights along the trunk; diameters were taken at lower part
of the trunk (heights between 10 and 200 cm) to be able to estimate the lowest part of the stem curve.
A polymer/fibre measuring tape was used to obtain the circumference measurements, after which
the resulting circumferences were divided by Pi to calculate the diameter. In theory, the diameter
for the rest of the trunk can be estimated using this stem curve information, which is a common
practice among harvesters. The test data set constituted 41 and 80 diameter measurements from
Kinect and Tango, respectively. For Kinect, both birches and scots pines were scanned. For Tango,
the dataset consisted of pines. Kinect and Tango measurements were performed by authors having
prior experience in 3D scanning methods.
     In the local field reference test, two test sites (Evo and Kalkkinen) were used to show the value
of utilizing a local field reference for ITD forest inventory from ALS data. Both of these areas lie in
the Southern Finland, separated by a distance of approximate 34.5 km. Kalkkinen site consisted of
mature forests, where no silvicultural operations had been carried out for a considerable amount
of time. In Kalkkinen, the dominant tree species are Norway spruce and Scots pine. Evo site, on the
other hand, is a commercially exploited forest area, with dominant tree species being Scots pine and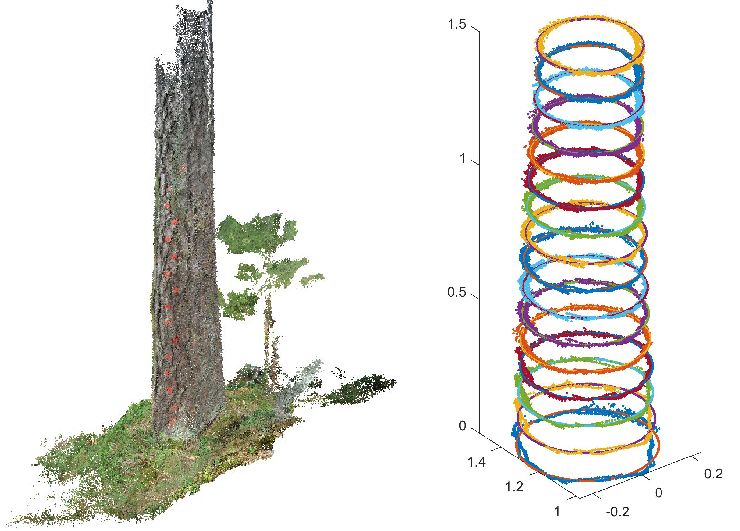
Forests 2018, 9, 6 4 of 14
Norway spruce. Data from field measurements by traditional methods (of accuracy equivalent to
Kinect and Tango measurements) were used for demonstrating the potential of new techniques in
Forests 2018, 9, 6 4 of 14
improvement of forest attribute estimates. Table 1 shows the difference in forest attributes at plot level:
Mean volume of
improvement of Kalkkinen is almost
forest attribute doubleTable
estimates. to that1 in Evo. the difference in forest attributes at plot
shows
level:Table
Mean volume of Kalkkinen is almost double to that in Evo.
1. Descriptive statistics of Kalkkinen (33 plots, 963 trees) and Evo forest data (292 plots, 8763 trees).
Height, diameter at breast height (DBH), and volume are given.
Table 1. Descriptive statistics of Kalkkinen (33 plots, 963 trees) and Evo forest data (292 plots, 8763
trees). Height, diameter at breast height (DBH), and volume are given.
Minimum Maximum Mean Standard Deviation
Kalkkinen Minimum Maximum Mean Standard Deviation
Kalkkinen
Mean tree height (m) 7.12 28.14 21.94 5.43
MeanDBH
Mean tree (cm)
height (m) 6.797.12 28.14
25.83 21.94
18.40 5.434.89
Mean
Volume (mDBH
3 /ha)(cm) 21.206.79 25.83
540.39 18.40
292.32 4.89
122.75
Volume (m3/ha) 21.20 540.39 292.32 122.75
Evo
Evo
Mean treetree
Mean height (m) (m) 3.9 3.9
height 31.7
31.7 18.0
18.0 6.1 6.1
Mean DBH (cm) 7.6 50.8 18.3 6.9
Mean DBH (cm) 7.6 50.8 18.3 6.9
Volume (m3 /ha) 0.4 586.2 148.2 110.7
Volume (m3/ha) 0.4 586.2 148.2 110.7
2.2. Kinect
2.2. Kinect Measurements
Measurements
When measuring
When measuring trees
trees with
with Kinect,
Kinect, thethe heights
heights were
were marked
marked withwith pins
pins (see
(see Figure
Figure 1)
1) for
for every
every
selected tree
selected tree in
in order
order to guarantee that
to guarantee that measurements
measurements were were taken
taken from
from the
the same
same height. The pins
height. The pins are
are
not needed in real-life application, as they were used to ensure the correspondence
not needed in real-life application, as they were used to ensure the correspondence between Kinect between Kinect
data and
data and manual
manual measuring
measuring methods. Images were
methods. Images were acquired
acquired from
from marked
marked heights. The stem
heights. The stem curve
curve
was
was measured
measured by moving the
by moving Kinect along
the Kinect along the
the tree
tree trunk
trunk and
and registering
registering consecutive
consecutive images
images together
together
using tie
using tie points
points (Figure
(Figure 1).
1). The
The whole
whole trunk
trunk can
can be
be reconstructed
reconstructed byby merging
merging the
the obtained
obtained diameter
diameter
estimates at
estimates at each
each height.
height. InIn aa real-life
real-life application, the Kinect
application, the Kinect scanning
scanning would
would bebe completed
completed from
from aa
single position, holding the device manually and scanning along the tree trunk. For
single position, holding the device manually and scanning along the tree trunk. For higher accuracy,higher accuracy,
the scanning
the scanning could
could be
be performed
performed from
from twotwo positions.
positions.
Figure 1. RGB image (left) and range image (middle) taken by Kinect sensor. Markers pinned on the
Figure 1. RGB image (left) and range image (middle) taken by Kinect sensor. Markers pinned on the
trunk can be visually identified from the RGB image. A composite image showing the stem from the
trunk can be visually identified from the RGB image. A composite image showing the stem from the
ground to the
ground to the height
height of
of 1.7
1.7 m,
m, formed
formed by
by merging
merging consecutive
consecutive images
images (right).
(right).
2.3. Kinect Data Processing
2.3. Kinect Data Processing
The processing of Kinect RGB and range data was based on range data, by fitting a circle to the
The processing of Kinect RGB and range data was based on range data, by fitting a circle to the
scan points around the buffer area. The marked positions were detected semi-automatically using
scan points around the buffer area. The marked positions were detected semi-automatically using
standard image processing techniques. The steps in detail are given as follows:
standard image processing techniques. The steps in detail are given as follows:
1. Extraction of trunk skeleton from range image by thresholding along the direction of the
1. Extraction of trunk skeleton from range image by thresholding along the direction of the camera’s
camera’s depth axis, i.e., removal of the background to produce a trunk mask;
depth axis, i.e., removal of the background to produce a trunk mask;
2. Automatic detection of the markers on the trunk from RGB images (first converted to grey scale)
by comparing intensities, as markers are brighter than surroundings;
3. Extraction of the point cloud from range images in a buffer area of detected marker positions;
4. Fitting an optimum circle to the extracted point cloud and computing the diameter of the
reconstructed circle at the corresponding height.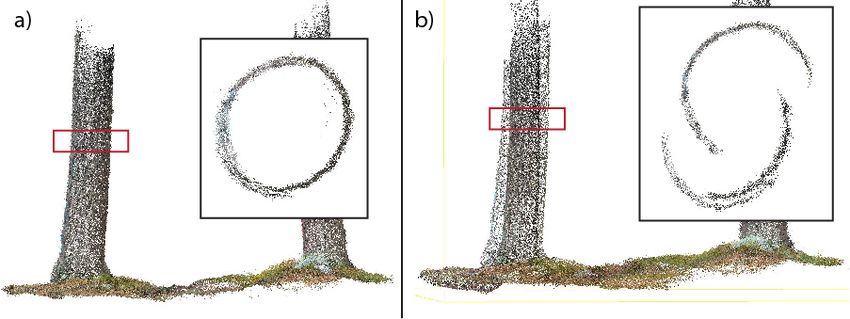
Forests 2018, 9, 6 5 of 14
2. Automatic detection of the markers on the trunk from RGB images (first converted to grey scale)
by comparing intensities, as markers are brighter than surroundings;
3. Extraction of the point cloud from range images in a buffer area of detected marker positions;
4. Fitting an optimum circle to the extracted point cloud and computing the diameter of the
reconstructed
Forests 2018, 9, 6 circle at the corresponding height. 5 of 14
If the tree stem was imaged from the same height by more than one scan, the mean value of the
If the tree stem was imaged from the same height by more than one scan, the mean value of the
diameter,
Forests obtained fromfrom
2018, 9,obtained
diameter, 6 the the
reconstructed
reconstructedcircles
circleswas
wasused. Figure22demonstrates
used. Figure demonstratesoneone example of of
5 of 14
example
diameter estimation
diameter and and
estimation the major steps
the major in in
steps the determination
the determination of diametersusing
of diameters using Kinect
Kinect data.
data.
If the tree stem was imaged from the same height by more than one scan, the mean value of the
diameter, obtained from the reconstructed circles was used. Figure 2 demonstrates one example of
diameter estimation and the major steps in the determination of diameters using Kinect data.
Figure 2. One example of diameter determination. Left: original RGB image, extracted trunk skeleton
Figure 2. One example of diameter determination. Left: original RGB image, extracted trunk skeleton
and identified position of the three markers. Right: circle fitting to the points at the height of the
and identified position of the three markers. Right: circle fitting to the points at the height of
markers.
the markers.
Figure 2. One example of diameter determination. Left: original RGB image, extracted trunk skeleton
2.4. and identified position
Measurements of the
with Tango three markers. Right: circle fitting to the points at the height of the
Sensor
markers. with Tango Sensor
2.4. Measurements
A mobile phone with Google Tango sensor (Phab2ProAR (Lenovo, Morrisville, NC, USA) [39])
A was used
mobile
2.4. to 3D scan
phone
Measurements with
with aTango
set of Sensor
Googleselected
Tango large pines(Phab2ProAR
sensor from Masala, Kirkkonummi, Southern Finland.
(Lenovo, Morrisville, NC, USA) The[39])
device contains conventional smart phone hardware with the addition
was used to 3D scan a set of selected large pines from Masala, Kirkkonummi, Southern Finland. of a depth camera, allowing
A mobile
active 3D dataphone with Google
acquisition. Tango purpose
Thesmart
primary sensor (Phab2ProAR
of integrating (Lenovo,
a addition Morrisville,
3D sensing NC, USA) [39])
The device
was
contains
used to 3D
conventional
scan a set of selected
phone
large
hardware
pines from
with the
Masala, Kirkkonummi,
ofsystem
a depth
Southern
incamera,
a smartphone
Finland.
allowing
The
is augmented reality applications, but several 3D scanning software have also been developed for
activedevice
3D data acquisition. The primary purpose of integrating a 3D sensing system in a smartphone
Tangocontains
devices. conventional smart phone hardware with the addition of a depth camera, allowing
is augmented
activeThe reality
3D data applications,
acquisition. but several
Theapplication
primary purpose 3Dofscanning
integrating software have
a 3D sensing also been
system developed for
in a Itsmartphone
Matterport Scenes [40] was applied in scanning the tree stems. utilizes the
TangoisTango
devices.
augmented
depth reality
sensor applications,
in conjunctionbutwithseveral 3D orientation
device’s scanning software
sensors have
and RGBalso camera,
been developed
producing fora
Tango
The devices.
3D RGB point cloud. Scanning was performed from motion, maintaining an approximate orientation the
Matterport Scenes application [40] was applied in scanning the tree stems. It utilizes
Tango of Thesensor
depth
depth Matterport
camerainsensor Scenes
conjunctionapplication
facing with
the [40]while
treedevice’s
stem was applied
walkingin
orientation scanning
sensors
around theRGB
and
the stem tree stems.
circularItmotion.
in acamera, utilizes Each
producing the a 3D
Tango
RGB point depth
cloud.
tree was sensor
Scanning
scanned in conjunction with
was performed
three times, device’s
producing afrom orientation
total motion, sensors
maintaining
of 240 diameter and RGB camera,
an approximate
estimates producing
of 80 manuallyorientation
measured a of
3D RGB point cloud. Scanning was performed from motion, maintaining an approximate orientation
depth stem
cameradiameters. In addition,
sensor facing tree
the tree stemwhile
stem scanning was also
walking tested
around theby scanning
stem two adjacent
in a circular motion. stems
Eachin tree
ofone
depth
go, camera
as shown sensor facing
in Figure 3.the tree stem while walking around the stem in a circular motion. Each
was scanned three times, producing a total of 240 diameter estimates of 80 manually measured stem
tree was scanned three times, producing a total of 240 diameter estimates of 80 manually measured
diameters. In addition,
stem diameters. tree stemtree
In addition, scanning was also
stem scanning was tested by scanning
also tested two adjacent
by scanning two adjacentstems stemsin one
in go,
as shown in Figure 3.
one go, as shown in Figure 3.
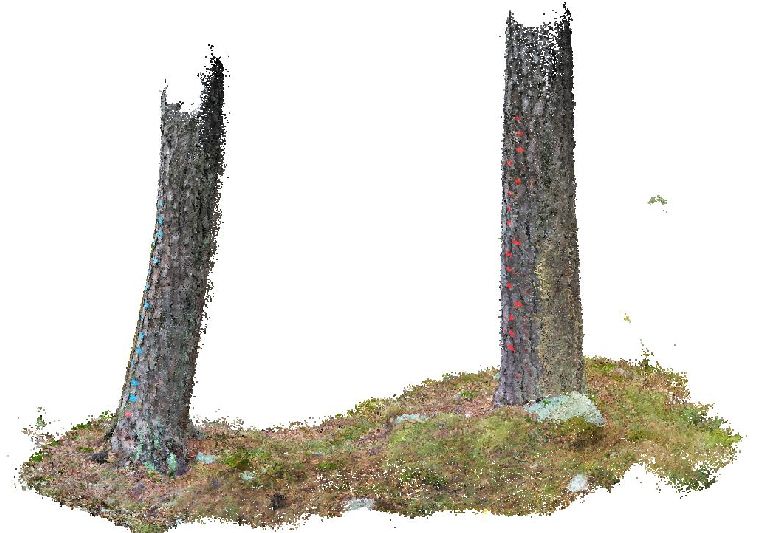
Figure 3. Two stems reconstructed in single Tango scan session.
Red markers were placed on the tree stem in 10 cm height intervals, from ground surface to 1.5
m. For ground truth,Figure 3. Two stems the
circumference reconstructed
stem wasin single Tango scan session.
Figure 3. Two stemsofreconstructed measured
in from
single Tango these
scan heights with a measuring
session.
tape.
Red markers were placed on the tree stem in 10 cm height intervals, from ground surface to 1.5
m. For ground truth, circumference of the stem was measured from these heights with a measuring
tape.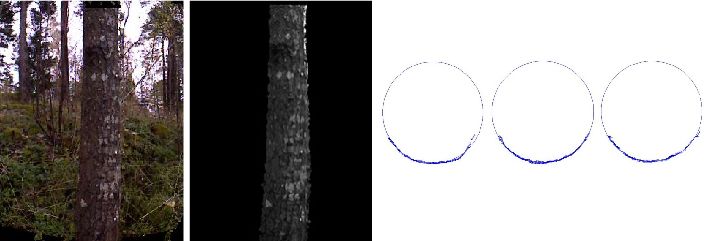
Forests 2018, 9, 6 6 of 14
Forests 2018, 9, 6 6 of 14
Red markers were placed on the tree stem in 10 cm height intervals, from ground surface to 1.5 m.
For ground truth, circumference of the stem was measured from these heights with a measuring tape.
2.5. Tango Data Processing
2.5. Tango Data Processing
Figure 4 shows a point cloud obtained with the mobile device. The terrain and other vegetation
surroundingFigure 4 shows a point cloud obtained with the mobile device. The terrain and other vegetation
the tree stem were manually segmented using CloudCompare (Version 2.8.1, 2016).
surrounding the tree stem were manually segmented using CloudCompare (Version 2.8.1, 2016).
After this 20 this
After mm20high ‘slices’
mm high of point
‘slices’ cloud
of point cloudwere separated
were separated from
from the the marked
marked heights,
heights, identifying
identifying the the
markersmarkers
from the from point clouds
the point RGB
clouds RGBdata
data(Figure 4).2D
(Figure 4). 2Dcircular
circular fitting
fitting was performed
was then then performed
to extractto extract
diameterdiameter
information for stem
information from
for stem frommarked
marked heights.
heights.
Figure 4. (Left)
Figure A reconstructed
4. (Left) A reconstructedpoint
pointcloud
cloud of
of aa tree
treestem
stemandand surroundings
surroundings obtained
obtained with mobile
with mobile
device. (Right) Extracted cross-sections of stem applied in circle fitting.
device. (Right) Extracted cross-sections of stem applied in circle fitting.
2.6. Accuracy
2.6. Accuracy Assessment
Assessment
Determination of the accuracy of the Kinect- and Tango estimates was performed by comparing
Determination of the accuracy of the Kinect- and Tango estimates was performed by comparing
them against calliper and tape measurements (dtape,calliper ). The coefficient of determination (R2 ) was
them against calliper
calculated and
between thetape measurements
data sets to describe the(d tape,calliper).ofThe
goodness coefficient
fit between of determination
the obtained estimates and (R ) was
2
calculated between
reference the data sets
measurements. Biasto describe
(Equation the
(1)) goodness
and of fit between
the root-mean-square errorthe
RMSEobtained estimates
(Equation (2)) and
were
reference calculated as theBias
measurements. measures of the accuracy
(Equation (1)) and of estimates. RMSE-% was obtained
the root-mean-square from RMSE
error RMSE by
(Equation (2))
dividing it with the sample mean value.
were calculated as the measures of the accuracy of estimates. RMSE-% was obtained from RMSE by
dividing it with the sample mean value. Σd −d
kinect,tango tape,calliper
Σ(
Bias =
, −n , ) (1)
= s
(1)
Σ(dkinect,tango − dtape,calliper )2
RMSE = Σ( (2)
, n− , )
= (2)
2.7. Local Field Reference Test
In the local field reference test, the influence of plot level information (diameter data with accuracy
2.7. Localcomparable
Field Reference Testor Tango) to forest inventory estimates was explored utilizing traditionally
to Kinect
obtained single tree data to calibrate estimations from ALS. For both of the sites, ALS data was used as
In the
the basis
localoffield reference
inventory: test,
Evo test the
area hasinfluence of plot
been surveyed withlevel
Leica information
ALS50-II (Leica(diameter
Geosystems,data with
accuracySankt
comparable to Kinect
Gallen, Aarau, or Tango)
Switzerland), to forest
400 m AGL, 2009, inventory estimates
and point density of 16 was
pts/m explored
2 whereas utilizing
Kalkkinen
traditionally data was
obtained collected
single tree with
dataToposys Falcon,
to calibrate 400 m AGL,from
estimations 2003, ALS.
and the point
For bothdensity was
of the sites, ALS
data was used as the basis of inventory: Evo test area has been surveyed with Leica ALS50-II (Leica
Geosystems, Sankt Gallen, Aarau, Switzerland), 400 m AGL, 2009, and point density of 16 pts/m2
whereas Kalkkinen data was collected with Toposys Falcon, 400 m AGL, 2003, and the point density
was 10 pts/m2. For calibration, field data (292 plots in Evo and 33 plots in Kalkkinen) were collectedForests 2018, 9, 6 7 of 14
10 pts/m2 . For calibration, field data (292 plots in Evo and 33 plots in Kalkkinen) were collected with
conventional methods at the corresponding time of laser acquisition. More details of these test sites can
be found from [41–43]. To simulate the impact of local field reference, Evo plots served as conventional
plots (with every tree measured by conventional methods) while Kalkkinen plots were used as test
plots. In order to test the effect of locally collected reference data on forest parameter estimation
accuracy we used three different strategies:
(1) All 292 plots of Evo data were applied as references to develop prediction models using an
area-based method. Developed models were then used to make the estimation of plot attributes
for 33 plots in Kalkkinen. This corresponds to a situation where the calibration data comes from
a different area than the area being the subject of inventory.
(2) Kalkkinen data were used for both developing models and making predictions by area-based
method. In this case, two third of data were used as training and one third as testing.
The procedure was repeated 100 times. This corresponds to an ideal situation where calibration
data can be collected from the area being studied.
(3) A hybrid approach, consisting of the currently applied solution added with local reference data.
All Evo data and 10% of Kalkkinen data (randomly selected 96 trees) were used to develop
models. Predictions were conducted firstly for individual trees and then individual predictions
were aggregated to plot level followed by area-based estimations. This corresponds to a situation
where a certain amount of local reference data can be collected from the area being studied.
We used Random Forests (RF) to construct the forest prediction models, since previous studies
have reported as good performance as other parametric or non-parametric methods if not better
(e.g., [42]). In strategy 1 and 2, 23 plot features derived from ALS data were used as predictors.
In strategy 3, 26 tree features derived from individual tree detection were used as predictors in
individual tree prediction and aggregated values as predictors in area-based predictions. More details
of the methods can be found in [43].
3. Results
3.1. Measuring Individual Trees
Table 2 gives the bias (cm) and RMSE (cm) and RMSE-% values when Kinect diameters are
compared with calliper and tape, calliper with tape and Tango diameters with tape. The use of Kinect
or Tango resulted in a smaller biases than using callipers, perhaps due to slack of the calliper jaws.
The RMSE of 1.9 cm of Kinect (7.3%) compared to 1.2 cm of calliper (5.9%) is an impressive level of
accuracy for a low-cost (100€) remote sensing device. An even more impressive RMSE of 0.73 cm
(1.89%) was attained with a consumer smart phone having a Tango sensor. Scatter plots of diameters
measured by Kinect and Tango compared to those obtained with measuring tape are shown in
Figure 5a,b.
Table 2. Bias, root-mean-square error (RMSE) and RMSE-% of diameter between Kinect sensor data,
tape measurements, measurements by caliper, or measurements with Tango device in Kirkkonummi,
Finland. For Tango, the values are given for individual tree measurements.
Kinect Data vs. Caliper Caliper (Mean of Two Kinect Data Tango (Mean)
East-West North-South Mean Directions) vs. Tape (Mean) vs. Tape vs. Tape
Bias (cm) −2.60 0.30 1.50 0.95 0.54 0.33
RMSE (cm) 2.25 2.63 2.50 1.16 1.90 0.73
RMSE-% 10.2 10.0 10.0 5.9 7.3 1.89Forests 2018, 9, 6 8 of 14
Forests 2018, 9, 6 8 of 14
Forests 2018, 9, 6 8 of 14
Figure 5. Diameters obtained with tape measure and (a) Kinect (n = 41, R2 =20.984) and (b) Tango (n =
Figure
Figure 5. Diametersobtained
240, R25.= Diameters
0.957),
obtainedwith
for Tango the
withtape
tapemeasure
repetitive
measureand
and
(a)(a)
measurements
Kinect
Kinect (n (n
have been= 41, R2 =R 0.984)
= 41,
included
= 0.984)
and and (b) Tango
(b) Tango
(80 diameter (n =
estimates
(n = 240, R2 = 0.957), for Tango the repetitive measurements have been included (80 diameter estimates
240, R 2 = 0.957), for Tango the repetitive measurements have been included (80 diameter estimates
repeated three times).
repeated three times).
repeated three times).
A positive mean bias of 3.34 mm was observed between Tango data and tape measures (ranging
fromAminimum
positivemean
positive meanbias
error ofbias
0.3 of
mm3.34
of 3.34 mm mm
was was
to maximum observed
observed
errorbetween
of 26.5between
Tango
mm), Tango
datathe
with anddata
tapeand
RMSE tape
measures
being 0.73measures
(ranging
cm. The
(ranging
from from minimum error of 0.3 mm to maximum error
performance is impressive for a handheld consumer device with on device pointcm.
minimum error of 0.3 mm to maximum error of 26.5 mm), of 26.5
with mm),
the RMSEwith the
being RMSE
0.73 being
The
cloud
0.73 cm. The is
performance
reconstruction. performance
impressive
When is for
observing impressive
a handheld
the for a handheld
repeated consumer
Tango consumer
device with
measurements, device
it on
waswith on device
device pointthat
discovered point
cloud
the
cloud reconstruction.
reconstruction. When When
observingobserving
the the
repeatedrepeated
Tango Tango measurements,
measurements, it
performance of the system varied significantly from scan to another. Figure 6 shows two different it
was was discovered
discovered that that
the
the performance
performance
scans for the ofsameof the
the tree system
systemstem. varied
varied
One of significantly
significantly from
from
the scans seems toscan
scan totoanother.
containanother. Figure66segment,
Figure
a misaligned shows two
shows two different
whereas the
scans for the same tree stem. One of the scans seems to contain
contain a misaligned
misaligned segment,
other is well composed. Looking at the results tree by tree, RMSE of 0.32 cm was attained for the best whereas the
other is welltree
individual composed.
scan, theLooking at the
worst being results
1.47 tree by tree,
cm, calculated RMSE
from of 0.32 cm
all profiles was attained
obtained from theforsame
the best
tree
individual
in one scan.tree scan, the worst being 1.47 cm, calculated from all profiles obtained from the same tree
in one scan.
Figure 6. Misalignments of a tree stem segments from Tango device. The same tree scanned at two
Figure 6. points
different Misalignments
of time isof a tree in
stem segments from Tango device. The same tree scanned at two
Figure 6. Misalignments ofshown
a tree stem(a,b), respectively.
segments from The
Tangocross sections
device. Theofsame
marked
tree areas are at
scanned shown
two
different points
from a top-down of time is shown in (a,b), respectively. The cross sections of marked areas are shown
different points of view
time isonshown
the right. The respectively.
in (a,b), misalignments Thecan be seen
cross in both
sections scans, areas
of marked but thearerepeated
shown
from
from
a
scansaattop-down
top-down
view
different view
pointson the
onofthe
right.
time show
right.
The
The
misalignments
different can be
misalignments,
misalignments
seen
which
can be seen
in both scans,
indicates
in both
but
thebut
scans,
the repeated
performance
the repeated of
scans at different
the Tango
scans at different points
systempoints ofoftime
may clearly time show
vary
show from differentto misalignments,
scan misalignments,
different another. which
which indicates
indicates thethe performance
performance of
of the
the Tango
Tango system
system maymay clearly
clearly varyvary fromfrom
scanscan to another.
to another.
3.2. Measuring Multiple Trees
3.2. Measuring Multiple Trees
3.2. Measuring
If two trees Multiple
were Trees
reconstructed in the same Tango scan (as in Figure 3), more performance
If two
variations trees
were were reconstructed
encountered in the
(Figure 7). same
As the Tango
sizeTango scan
of thescan (as in
scanned Figure
area 3), more
increased, performance
more incorrectly
If two trees were reconstructed in the same (as in Figure 3), more performance
variations were
registered were encountered
segments (Figure
are produced 7). As the size of the scanned area increased, more incorrectly
variations encountered (Figureby7). the system,
As the negatively
size of the scanned effecting the accuracy
area increased, moreof diameter
incorrectly
registered
estimation segments
(Figure 8).are produced by the system, negatively effecting the accuracy of diameter
registered segments are produced by the system, negatively effecting the accuracy of diameter
estimation (Figure
In best(Figure 8).
cases, the
estimation 8). performance remained high, with smallest RMSE of a single tree being 0.44 cm,
In best cases, the
calculated from 16 diameter performance remained
estimates of thehigh,
stem.with smallest
However, in RMSE of a case,
the worst singleantree being
RMSE of0.44
6.06cm,
cm
calculated from 16 diameter estimates of the stem. However, in the worst case, an
was observed, calculated from 16 diameter estimates of the stem. For individual diameter estimates, RMSE of 6.06 cm
was observed,
the best fit wascalculated
near perfectfrom 16 diameter
(error estimates
of 0.01%), with theof worst
the stem.
onesFor individual
having coarsediameter estimates,
errors (20.48%). In
the best fit was near perfect (error of 0.01%), with the worst ones having coarse errors (20.48%). InForests 2018, 9, 6 9 of 14
In best cases, the performance remained high, with smallest RMSE of a single tree being 0.44 cm,
calculated from 16 diameter estimates of the stem. However, in the worst case, an RMSE of 6.06 cm
Forestswas observed,
2018, 9, 6 calculated from 16 diameter estimates of the stem. For individual diameter estimates,9 of 14
the best fit was near perfect (error of 0.01%), with the worst ones having coarse errors (20.48%). In scans
scansForests 2018,several
covering
covering 9, 6 trees,
several the best
trees, ones ones
the best did not
didreach
not same
reachaccuracy as singleas
same accuracy tree scans,tree
single 9 of 14
andscans,
the worst
and the
ones
worstscans were significantly
onescovering
were significantly more erroneous.
several trees,more erroneous.
the best ones did not reach same accuracy as single tree scans, and the
worst ones were significantly more erroneous.
Figure 7. (a,b)
Figure Two
7. (a,b) Twoscans of of
scans thethesame
sametwotwoadjacent stemswith
adjacent stems withmarked
marked cross-sections
cross-sections showed
showed fromfrom
a a
top-down view
top-down in insets.
view In In
in insets. (b)(b)
the
thestem
stemisisclearly
clearly effected byaacoarse
effected by coarseregisteration
registeration error.
error. If diameter
If diameter
estimation is performed
estimation performed
is performed viavia
circular
circularfitting
fittingto
to such cross-section,the
such cross-section, theresults
results
failfail to describe
to describe the tree
the tree
diameter
diameter properly.
properly.
diameter properly.
Figure 8. Scatterplot showing the diameter estimations for the same stem from 16 different heights,
Figure 8. Scatterplot showing the diameter estimations for the same stem from 16 different heights,
from three different iterations. In iteration 3, the results are clearly inferior.
from three different iterations. In iteration 3, the results are clearly inferior.
Figure 8. Scatterplot showing the diameter estimations for the same stem from 16 different heights,
fromLocal
3.3. three different
Field iterations.
Reference Test In iteration 3, the results are clearly inferior.
3.3. Local Field Reference Test
The local field reference test (Table 3) shows that without local field data, there is a large bias on
3.3. Local The
Fieldlocal field reference
Reference Test test (Table 3) shows that without local field data, there is a large bias on
the results (5 cm with DBH and 57 m 3
3/ha with volume). This is due to different forest conditions of
the results (5 cm with DBH and 57 m /ha with volume). This is due to different forest conditions of the
the
Thetwo sites.
local This
field is significant,(Table
especially as the sites
thatinare in the samefield
geographicthere
area, only 34.5 km
two sites. This is reference
significant,test
especially as 3)the
shows
sites are without
the samelocal
geographicdata, is akm
area, only 34.5 large bias on
apart.
apart.
the results Use of local plot data (Strategy 2) lead to almost zero bias and also improved RMSE. Compared
Use of (5 cmplotwithdata
DBH and 572)mlead /ha towith volume). Thisand
is due
also to different forestCompared
conditions of
3
local (Strategy almost zero bias improved RMSE.
with Strategy 1, both bias and RMSE have been reduced by using small amount local reference data
the two
withsites. This1,isboth
Strategy significant, especially
bias and RMSE have as thereduced
been sites arebyinusing
the same
small geographic
amount localarea, onlydata
reference 34.5 km
(Strategy 3). When compared with Strategy 2, RMSE of volume estimate is at the same level while
apart. Use of local
(Strategy plot compared
3). When data (Strategy 2) lead to2,almost
with Strategy RMSE of zero bias and
volume also improved
estimate RMSE.
is at the same levelCompared
while
mean DBH estimate needs to be improved.
withmean DBH1,estimate
Strategy both bias needs
andtoRMSE
be improved.
have been reduced by using small amount local reference data
(Strategy 3). When compared with Strategy 2, RMSE of volume estimate is at the same level while
mean DBH estimate needs to be improved.Forests 2018, 9, 6 10 of 14
Table 3. The bias, RMSE, and correlation coefficient (R) for the local field reference test, comparing the
results of forest inventory from ALS with three different sets of manually obtained reference data.
Strategy 1—Reference Plots Located at Different Forest Area
Bias RMSE RMSE-% R
Mean DBH (cm) 5.08 6.27 32.85 0.74
Volume (m3 /ha) 56.98 104.32 34.32 0.80
Strategy 2—Reference Plots Located at Test Site
Mean DBH (cm) 0.22 2.90 15.18 0.83
Volume (m3 /ha) −3.41 96.06 31.61 0.73
Strategy 3—Reference Plots Located at Different Forest Area, Selective Measurements in Test Site
Mean DBH (cm) 3.51 4.67 24.42 0.83
Volume (m3 /ha) 24.48 96.97 31.90 0.77
4. Discussion
The accuracy of both Kinect and Tango for stem diameter measurements is promising, taking
into account that professional good-quality calliper results in precision of 7 mm [38]. The bias of the
diameter estimate using Kinect range data seems to be negligible and in this test better than with
the calliper. Even better accuracy was obtained with handheld, mobile integrated Tango system
onboard a Phab2ProAR (Lenovo, Morrisville, NC, USA) [39]: A small positive mean bias (0.3 cm) was
observed for individually scanned trees, most likely caused by noise in point cloud. Previous studies
using TLS for tree DBH measurements have resulted in accuracies between 1 and 2.5 cm [2]. Use of
other electronic devices, such as integrated laser beam and digital imaging, has resulted in accuracy
of 0.6 cm using semi-automatic processing and 1.3 cm when using fully-automatic processing [44].
Accuracies of Kinect and Tango are comparable with those obtained with other sensors. Coefficient of
determination (R2 ) of 0.98 for Kinect and 0.96 for Tango were found when regressed against measuring
tape results, when measuring individual trees. When scanning several stems simultaneously with
Tango, the results were clearly inferior (R2 = 0.23). According to our results, the Tango system is more
suitable for scanning individual trees.
The results presented were obtained with the first version of the Kinect, after which an improved
version was released, potentially providing better performance. We see two practical ways of using
Kinect which have been demonstrated in this study: (1) measurement of DBH and processing all data
related to one frame of the fixed height; (2) use of the Kinect to measure the first part of the tree stem
to estimate the whole stem curve. Both areas should be further studied.
For Tango, our results are in line with [34], where RMSE in range 1.61–2.10 cm was attained
for scanning whole plots in one go. A significantly higher accuracy for diameter estimation (RMSE
0.73 cm) was attained in our tests when scanning individual tree stems. This would suggest that for
best performance, Tango devices should be used to scan individual trees rather than plots/patterns.
As multi-sensor system, the performance of a Tango device in 3D scanning is influenced by several
factors: the scanning accuracy of the depth sensor, accuracy of orientation sensors, correctness in
registration of consecutive depth images, and the quality of the motion the device experiences while
scanning. This is clearly visible in the performance variations found in repeated scans.
A benefit of Tango is that it provides an integrated package offering processing capabilities
(with smartphones’ own computational resources), connections (wireless local area network (WLAN),
global system for mobile communications (GSM)) and other sensors (such as global navigation satellite
systems (GNSS)), whereas Kinect is a separate device that requires a computer to operate. From an
application development point of view, the Tango sensor holds significant potential for developing
mobile applications for crowdsourcing 3D data, if the sensors become a common feature in smart
phones. Currently they are rare, hindering development of applications. In addition, the data qualityForests 2018, 9, 6 11 of 14
of all hand-hold devices for crowdsourcing applications still needs to improve. Similar misalignments
can be clearly seen from the current Tango devices, as shown in Figure 7b, and the image-based point
cloud using structure from motion technique as shown in [20], which cost under- or overestimates of
tree DBHs.
For both of the tested systems, the biggest efficiency improvement when compared with the
manual measuring methods, such as measuring tape, is the digitization of the entire lower part of the
tree stem in a single scan. Ideally they should therefore be applied rather to stem curve estimation
than only producing a DBH estimate. In the presented experiment, both systems were operated by
experienced professionals. Determining whether inexperienced users would attain similar results
would require further study.
In the local field reference test, we applied airborne laser scanning data [41,43], area-based
approach based on Random Forest and individual tree technique [42]. We aimed to get reliable
inventory results for natural forest in Kalkkinen using Evo field plots and data collected in Kalkkinen
corresponding to Kinect/Tango diameter measurements. Without any field data from Kalkkinen,
the bias of stem volume estimation was 57 m3 /ha. Using a small amount of local field data resulted
in significant reduction of this bias and RMSE, Table 3. Thus, there is a need for local data. In this
study, the data applied was still obtained with traditional forest inventory practices having accuracy
comparable to individual tree data provided by either Tango or Kinect systems. Clearly, such data
for forest inventory calibration could well be provided by crowdsourcing with these emerging
sensor technologies.
In the work presented, the accuracy of DBH extraction using mobile sensors was estimated. While
this is an essential component in application for crowdsourcing forestry data, it is not the only aspect of
their applicability. An additional question is, how would land-owners be able to measure the location
of the trees which they would like to input to the reference. Since GNSS accuracy in forest is not
enough for plot or individual tree level inventory, an alternative solution would have to be applied.
One possibility would be the application of a GNSS assisted 3D Game Engine based approach. In this,
an approximate location from GNSS could be further refined by the user, referencing to visualized
ITD representations from ALS data. This would allow the users to visually locate themselves more
accurately than solely by GNSS.
A potential user interface can be drafted from the same outset: The output of the ITD interpretation
is visualized in the 3D Game Engine running in smart phone, and user can select the tree groups
or individual trees from ITD interpretation to which he/she likes to give field reference. If the ITD
process indicated one tree which corresponds to several trees in the field, the land-owner records all
trees and their attributes, especially the diameter breast heights and tree species. For suitable plots,
he/she preferably records corresponding information of all trees. Also, if there are omissions in the
ITD process, i.e., trees missing from the original estimate, these can be added manually.
In addition to technical challenges, success of crowdsourcing campaigns is dependent on the
user participation. In the presented case, the motivation of using 3D sensing sensors for forest
owners in a crowdsourcing context would be apparent: to get improved estimates of one’s own forest
resources. The motivation for the system provider is also obvious: improvement in accuracy for the
forest inventory.
5. Conclusions
In this paper, we have demonstrated that the Kinect and Google Tango depth sensors are
feasible for tree stem mapping (i.e., diameter estimation and part of the stem curve estimation)
with relatively good accuracy. Kinect-derived tree diameters agreed with tape measurements to 1.9 cm
(RMSE) and 7.3% (RMSE-%). The stem curve from the ground to the height of 1.7 m agreed with
similar statistics. For Tango enabled smartphone, an RMSE of 0.73 cm was achieved in diameter
estimation compared to measurement tape. The accuracies are adequate for operational work. In the
local field reference test, we showed that locally collected field reference improves significantlyForests 2018, 9, 6 12 of 14
forest inventory estimates at boreal forest conditions. Based on these results, we have introduced a
crowdsourcing concept based on individual tree diameter and stem curve measurements, using Kinect
and mobile-phone embedded 3D sensor (Tango) for ALS (Airborne Laser Scanning)-based large-area
forest inventory at individual tree level.
Acknowledgments: This work was supported by the Academy of Finland projects “Centre of Excellence in Laser
Scanning Research (projects 307362, 292735)”, “New laser and spectral field methods for in situ mining and raw
material investigations (project 292648)”, “Multispectral mobile and UAV-based laser scanning” (project 307823)
and “Competence-Based Growth Through Integrated Disruptive Technologies of 3D Digitalization, Robotics,
Geospatial Information and Image Processing/Computing—Point Cloud Ecosystem” (No. 293389). The Finnish
Funding Agency for Innovation is acknowledged for support in project “VARPU” (7031/31/2016). The European
Union, the European Regional Development Fund, the “Leverage from the EU 2014-2020” projects “AKAI”
(301130) and 3D Cultural Hub (A72980) are acknowledged.
Author Contributions: J.H. developed the concept. A.J. and J.-P.V. made Kinect and Tango measurements. X.Y.
was responsible for major part of data analysis. All authors corresponded to drawing conclusions. J.H. and J.-P.V.
wrote most parts of the paper.
Conflicts of Interest: The authors declare no conflict of interest.
References
1. Houghton, R.A.; Hall, F.; Goetz, S.J. Importance of biomass in the global carbon cycle. J. Geophys. Res. 2009,
114, 2156–2202. [CrossRef]
2. Liang, X.; Kankare, V.; Hyyppä, J.; Wang, Y.; Kukko, A.; Haggrén, H.; Yu, X. Terrestrial laser scanning in
forest inventories. ISPRS-J. Photogramm. Remote Sens. 2015, 115, 63–77. [CrossRef]
3. Tomppo, E.; Olsson, H.; Ståhl, G.; Nilsson, M.; Hagner, O.; Katila, M. Combining national forest inventory
field plots and remote sensing data for forest databases. Remote Sens. Environ. 2008, 112, 1982–1999.
[CrossRef]
4. Hyyppä, J.; Hyyppä, H.; Inkinen, M.; Engdahl, M.; Linko, S.; Zhu, Y.-H. Accuracy comparison of various
remote sensing data sources in the retrieval of forest stand attributes. For. Ecol. Manag. 2000, 128, 109–120.
[CrossRef]
5. Nilsson, M. Estimation of tree heights and stand volume using an airborne lidar system. Remote Sens. Environ.
1996, 56, 1–7. [CrossRef]
6. Næsset, E. Predicting forest stand characteristics with airborne scanning laser using a practical two-stage
procedure and field data. Remote Sens. Environ. 2002, 80, 88–99. [CrossRef]
7. Maltamo, M.; Eerikäinen, K.; Packalen, P.; Hyyppä, J. Estimation of stem volume using laser scanning-based
canopy height metrics. Forestry 2006, 79, 217–229. [CrossRef]
8. Hyyppä, J.; Inkinen, M. Detecting and estimating attributes for single trees using laser scanner. Photogramm. J. Finl.
1999, 16, 27–42.
9. Brandtberg, T. Automatic Individual Tree-Based Analysis of High Spatial Resolution Remotely Sensed Data;
Acta Universitatis Agriculturae Sueciae Silvestria: Uppsala, Sweden, 1999.
10. Pouliot, D.A.; King, D.J.; Bell, F.W.; Pitt, D.G. Automated tree crown detection and delineation in
high-resolution digital camera imagery of coniferous forest regeneration. Remote Sens. Environ. 2002,
82, 322–334. [CrossRef]
11. Holmstrom, H.; Kallur, H.; Stahl, G. Cost-plus-loss analyses of forest inventory strategies based on
kNN-assigned reference sample plot data. Silva Fenn. 2003, 37, 381–398.
12. Liang, X.; Kankare, V.; Yu, X.; Hyyppä, J.; Holopainen, M. Automated stem curve measurement using
terrestrial laser scanning. IEEE Trans. Geosci. Remote Sens. 2014, 52, 1739–1748. [CrossRef]
13. Heipke, C. Crowdsourcing geospatial data. ISPRS-J. Photogramm. Remote Sens. 2010, 65, 550–557. [CrossRef]
14. Fritz, S.; McCallum, I.; Schill, C.; Perger, C.; Grillmayer, R.; Achard, F.; Kraxner, F.; Obersteiner, M.
Geo-Wiki.Org: The Use of Crowdsourcing to Improve Global Land Cover. Remote Sens. 2009, 1, 345–354.
[CrossRef]
15. Philly Tree Map. Available online: https://www.opentreemap.org/phillytreemap/map/ (accessed on 4
December 2017).
16. Urban Forest Maps. Available online: https://urbanforestmap.org/ (accessed on 4 December 2017).Forests 2018, 9, 6 13 of 14
17. Foster, A.; Dunham, I.M.; Kaylor, C. Citizen Science for Urban Forest Management? Predicting the Data
Density and Richness of Urban Forest Volunteered Geographic Information. Urban Sci. 2017, 3, 30. [CrossRef]
18. Molinier, M.; López-Sánchez, C.A.; Toivanen, T.; Korpela, I.; Corral-Rivas, J.J.; Tergujeff, R.; Häme, T.
Relasphone—Mobile and Participative In Situ Forest Biomass Measurements Supporting Satellite Image
Mapping. Remote Sens. 2016, 8, 869. [CrossRef]
19. Vastaranta, M.; Latorre, E.G.; Luoma, V.; Saarinen, N.; Holopainen, M.; Hyyppä, J. Evaluation of a smartphone
app for forest sample plot measurements. Forests 2015, 6, 1179–1194. [CrossRef]
20. Liang, X.; Wang, Y.; Jaakkola, A.; Kukko, A.; Kaartinen, H.; Hyyppä, J.; Honkavaara, E.; Liu, J. Forest data
collection using terrestrial image-based point clouds from a handheld camera compared to terrestrial and
personal laser scanning. IEEE Trans. Geosci. Remote Sens. 2015, 53, 5117–5132. [CrossRef]
21. Kaartinen, H.; Hyyppä, J.; Yu, X.; Vastaranta, M.; Hyyppä, H.; Kukko, A.; Holopainen, M.; Heipke, C.;
Hirschmugl, M.; Morsdorf, F.; et al. An international comparison of individual tree detection and extraction
using airborne laser scanning. Remote Sens. 2012, 4, 950–974. [CrossRef]
22. Wang, Y.; Hyyppä, J.; Liang, X.; Kaartinen, H.; Yu, X.; Lindberg, E.; Holmgren, J.; Qin, Y.; Mallet, C.; Ferraz, A.;
et al. International benchmarking of the individual tree detection methods for modeling 3-D canopy structure
for silviculture and forest ecology using airborne laser scanning. IEEE Trans. Geosci. Remote Sens. 2016, 54,
5011–5027. [CrossRef]
23. Vauhkonen, J.; Ene, L.; Gupta, S.; Heinzel, J.; Holmgren, J.; Pitkänen, J.; Solberg, S.; Wang, Y.; Weinacker, H.;
Hauglin, K.M.; et al. Comparative testing of single-tree detection algorithms under different types of forest.
Forestry 2011, 85, 27–40. [CrossRef]
24. Henry, P.; Krainin, M.; Herbst, E.; Ren, X.; Fox, D. RGB-D mapping: Using Kinect-style depth cameras for
dense 3D modeling of indoor environments. Int. J. Robot. Res. 2012, 31, 1–17. [CrossRef]
25. Kroshelham, K.; Oude Elberink, S. Accuracy and Resolution of Kinect Data for Indoor Mapping Applications.
Sensors 2012, 12, 1437–1454. [CrossRef] [PubMed]
26. Kroshelham, K. Accuracy analysis of Kinect Depth data. In Proceedings of the ISPRS Calgary 2011 Workshop
International Archives Photogrammetry Remote Sensing Spatial Information Sciences, Calgary, AB, Canada,
29–31 August 2011; Volume XXXVIII-5/W12.
27. Chen, J.M.; Liu, X.; Zhao, Z.X.; Zhong, W.T. Research on landscape environment with 3D-reconstruction and
volume measurement of fruit tree canopy based on Kinect. Adv. Mater. Res. 2013, 788, 480–485. [CrossRef]
28. Qi, X.; Lichti, D.; El-Badry, M.; Chow, J.; Ang, K. Vertical Dynamic Deflection Measurement in Concrete
Beams with the Microsoft Kinect. Sensors 2014, 14, 3293–3307. [CrossRef] [PubMed]
29. Ostovar, A. Enhancing Forestry Object Detection Using Multiple Features. Master’s Thesis, Umeå University,
Umeå, Sweden, 2011.
30. Pordel, M.; Hellström, T.; Ostovar, A. Integrating Kinect Depth Data with a Stochastic Object Classification
Framework for Forestry Robots. In Proceedings of the 9th International Conference on Informatics in Control,
Automation and Robotics, Rome, Italy, 28–31 July 2012; pp. 314–320.
31. Brouwer, T. Low Budget Ranging for Forest Measurements. Master’s Thesis, Wageningen University,
Wageningen, Germany, 2013.
32. Tango. Available online: https://get.google.com/tango/ (accessed on 17 November 2017).
33. Depth Perception. Available online: https://developers.google.com/tango/overview/depth-perception
(accessed on 17 November 2017).
34. It’s Your Turn. Build the Future. Available online: https://developers.google.com/tango/ (accessed on
17 November 2017).
35. Diakité, A.A.; Zlatanova, S. First experiments with the tango tablet for indoor scanning. In Proceedings of the
ISPRS Annals of the Photogrammetry, Remote Sensing and Spatial Information Sciences, Prague, Czech Republic,
12–19 July 2016; Volume III-4. [CrossRef]
36. Zhang, E.; Cohen, M.F.; Curless, B. Emptying, refurnishing, and relighting indoor spaces. ACM Trans. Graph.
2016, 35. [CrossRef]
37. Tomaštík, J.; Saloň, Š.; Tunák, D.; Chudý, F.; Kardoš, M. Tango in forests—An initial experience of the use of
the new Google technology in connection with forest inventory tasks. Comput. Electron. Agric. 2017, 141,
109–117. [CrossRef]
38. Päivinen, R.; Nousiainen, M.; Korhonen, K. Puutunnusten mittaamisen luotettavuus. Folia Forestalia 1992,
787, 1–18.You can also read


