The mouse Gene Expression Database (GXD): 2021 update
←
→
Page content transcription
If your browser does not render page correctly, please read the page content below
D924–D931 Nucleic Acids Research, 2021, Vol. 49, Database issue                                                  Published online 26 October 2020
doi: 10.1093/nar/gkaa914

The mouse Gene Expression Database (GXD): 2021
update
Richard M. Baldarelli, Constance M. Smith, Jacqueline H. Finger, Terry F. Hayamizu,
Ingeborg J. McCright, Jingxia Xu, David R. Shaw, Jonathan S. Beal, Olin Blodgett,
Jeffrey Campbell, Lori E. Corbani, Pete J. Frost, Sharon C. Giannatto, Dave B. Miers,
James A. Kadin, Joel E. Richardson and Martin Ringwald *
The Jackson Laboratory, 600 Main Street, Bar Harbor, ME 04609, USA

                                                                                                                                                              Downloaded from https://academic.oup.com/nar/article/49/D1/D924/5940496 by guest on 30 May 2021
Received September 14, 2020; Revised October 01, 2020; Editorial Decision October 02, 2020; Accepted October 02, 2020

ABSTRACT                                                                        INTRODUCTION
The Gene Expression Database (GXD; www.                                         The longstanding objective of GXD has been to capture
informatics.jax.org/expression.shtml) is an exten-                              and integrate different types of mouse developmental ex-
sive and well-curated community resource of mouse                               pression information, with a focus on endogenous gene ex-
developmental gene expression information. For                                  pression in wild-type and mutant mice, and to make these
                                                                                data readily accessible to researchers via biologically- and
many years, GXD has collected and integrated data
                                                                                biomedically-relevant searches. As an integral component
from RNA in situ hybridization, immunohistochem-
                                                                                of the larger Mouse Genome Informatics (MGI) resource
istry, RT-PCR, northern blot, and western blot ex-                              (1–3), GXD combines expression data with genetic, func-
periments through curation of the scientific litera-                            tional, phenotypic and disease-oriented data, thereby en-
ture and by collaborations with large-scale expres-                             abling unique and powerful search capabilities that fos-
sion projects. Since our last report in 2019, we                                ter insights into the molecular mechanisms of human de-
have continued to acquire these classical types                                 velopment, differentiation, and disease. In addition, GXD
of expression data; developed a searchable index                                maintains links to external expression resources, including
of RNA-Seq and microarray experiments that al-                                  gene-based links to expression data from other vertebrate
lows users to quickly and reliably find specific                                model organisms that are highly relevant for developmen-
mouse expression studies in ArrayExpress (https://                              tal research: zebrafish (ZFIN; 4), Xenopus (Xenbase; 5) and
                                                                                chicken (GEISHA; 6). For many years, GXD has collected
www.ebi.ac.uk/arrayexpress/) and GEO (https://www.
                                                                                RNA and protein expression information from RNA in
ncbi.nlm.nih.gov/geo/); and expanded GXD to in-
                                                                                situ hybridization, immunohistochemistry, in situ reporter
clude RNA-Seq data. Uniformly processed RNA-Seq                                 (knock in), RT-PCR, northern blot, and western blot exper-
data are imported from the EBI Expression Atlas                                 iments. These complex, heterogeneous expression data, gen-
and then integrated with the other types of ex-                                 erated by many laboratories and distributed through thou-
pression data in GXD, and with the genetic, func-                               sands of publications, are acquired through curation of the
tional, phenotypic and disease-related information in                           scientific literature and by collaborations with large-scale
Mouse Genome Informatics (MGI). This integration                                expression projects. GXD curators annotate these data in
has made the RNA-Seq data accessible via GXD’s                                  standardized ways by making extensive use of controlled
enhanced searching and filtering capabilities. Fur-                             vocabularies and ontologies (7–10). Since our last report in
ther, we have embedded the Morpheus heat map util-                              the NAR Database issue (2), we have (i) continued to cu-
                                                                                rate these classical types of expression data, (ii) expanded
ity into the GXD user interface to provide additional
                                                                                GXD to represent RNA-Seq and microarray experiments
tools for display and analysis of RNA-Seq data, in-
                                                                                in searchable form, (iii) begun to fully integrate RNA-Seq
cluding heat map visualization, sorting, filtering, hi-                         data into GXD and into the larger MGI system, and (iv) de-
erarchical clustering, nearest neighbors analysis and                           veloped new user interface utilities for the display and anal-
visual enrichment.                                                              ysis of expression data. In the following, we will report on
                                                                                our progress, putting the main emphasis on the description
                                                                                of new types of data and new search and display capabilities
                                                                                in GXD.

* To   whom correspondence should be addressed. Tel: +1 207 288 6436; Email: ringwald@informatics.jax.org


C The Author(s) 2020. Published by Oxford University Press on behalf of Nucleic Acids Research.
This is an Open Access article distributed under the terms of the Creative Commons Attribution License (http://creativecommons.org/licenses/by/4.0/), which
permits unrestricted reuse, distribution, and reproduction in any medium, provided the original work is properly cited.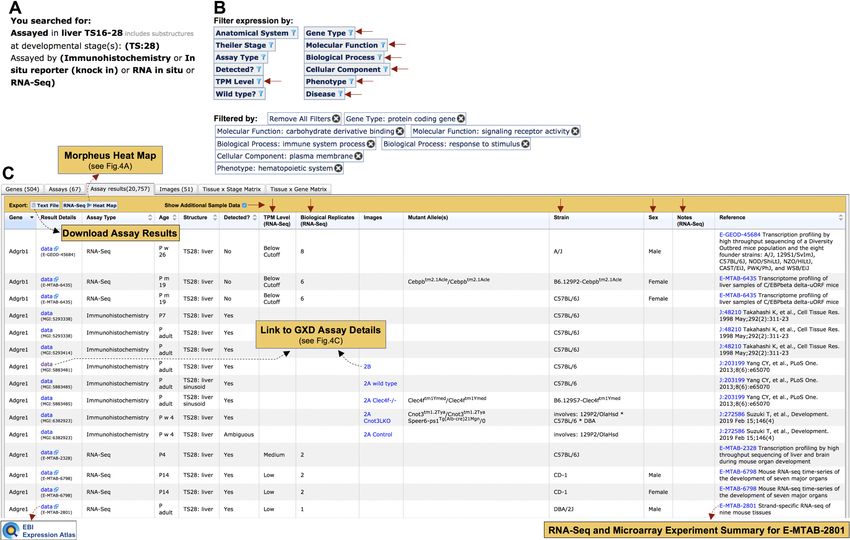
Nucleic Acids Research, 2021, Vol. 49, Database issue D925

PROGRESS IN DATA ACQUISITION FOR CLASSICAL                         hensive sets of high-throughput experiments using stan-
TYPES OF EXPRESSION DATA                                           dardized search terms from controlled vocabularies and on-
                                                                   tologies. This task is not possible when conducting searches
Comprehensive literature survey
                                                                   through repository resources, since standardized metadata
We systematically survey journals to find all publications         are not required for data submission, and term heterogene-
examining endogenous gene expression during mouse de-              ity is widespread.
velopment. In a first curation step for each paper, we an-            We load mouse experiment-level metadata (ID, title, ab-
notate the genes and ages analyzed and the expression as-          stract and experiment type) from ArrayExpress weekly
say types used. Annotations are based on the entire pub-           (Figure 1A). A dedicated curation tool facilitates efficient
lication, including Supplemental Data, and employ offi-            experiment evaluation and sample and experiment attribute
cial nomenclature for genes. This information, combined            annotation to standardized terms (not shown). An initial
with bibliographic information from PubMed, is accessi-            triage step identifies experiments that are considered con-
ble via the Gene Expression Literature Search form (http:          sistent with GXD scope. Manual evaluation at this step is
//www.informatics.jax.org/gxdlit). GXD’s literature content        supported by supervised machine learning (a linear SVM

                                                                                                                                      Downloaded from https://academic.oup.com/nar/article/49/D1/D924/5940496 by guest on 30 May 2021
records are comprehensive and up-to-date from 1990 to the          classifier, see (11) for more detail) which has proven to be
present. GXD has records for >28 400 references and >16            effective for the classification of out-of-scope experiments.
200 genes. The Gene Expression Literature Search provides          Sample metadata for GXD-relevant experiments are down-
scientists with an effective tool for finding publications with    loaded on demand into the curation tool, annotated to
specific expression data, and it helps GXD Curators to pri-        standard terms and added to the index. Of 16 782 high-
oritize papers for detailed expression annotation.                 throughput expression experiments downloaded from Ar-
                                                                   rayExpress, 3163 were considered relevant to GXD’s scope
                                                                   (2463 microarray, 700 RNA-Seq). At the time this load
Detailed expression data                                           was developed, ArrayExpress included all experiments from
In a second curation step, the expression data are annotated       GEO. This is no longer the case. GXD plans to extend this
in detail. For each expression assay, we record information        load to acquire data directly from both ArrayExpress and
about the gene studied, the strength and pattern of expres-        GEO, assuring complete representation from both reposi-
sion in specific anatomical structures, the probes and ex-         tories.
perimental conditions used, and the age and genetic back-
ground of the specimen(s) analyzed. Images of the data ac-         RNA-Seq expression data in GXD
company the annotations when available. Standard gene,
mouse strain and allele nomenclature, controlled vocabu-           GXD has incorporated high quality RNA-Seq expression
laries and an extensive anatomy ontology are employed to           data for GXD-relevant RNA-Seq experiments in GXD’s
enable thorough data integration and search capabilities.          RNA-Seq and Expression Microarray Metadata Index.
See http://www.informatics.jax.org/assay/MGI:2673718 for           These data are imported from the Expression Atlas at EBI
an example of an RNA in situ record, and Figure 4C for an          (14), and then processed further by GXD to allow full in-
example of immunohistochemistry records (partial records           tegration into our system, and accessibility through our
shown). As of September 2020, GXD contains detailed ex-            search and display tools. The Expression Atlas incorpo-
pression data for nearly 15 000 genes, including data from         rates primary data for high-quality RNA-Seq data sets from
numerous strains of wild-type mice and from >4900 mouse            ArrayExpress and GEO, and applies a processing pipeline
mutants. GXD now holds >365 000 images and >1.74 mil-              designed to leverage state-of-the-art annotation methods
lion expression result annotations for classical types of ex-      to generate reliable, updated TPM values for genes repre-
pression data. The majority of these data (85%) are from           sented in current Ensembl releases (14). We download these
in situ hybridization, immunohistochemistry and in situ re-        TPM values, and prepare the data for integrated access us-
porter (knock in) experiments.                                     ing GXD’s RNA-Seq processing pipeline (Figure 1B). Ex-
                                                                   pression data for new GXD-relevant RNA-Seq experiments
                                                                   from the Expression Atlas are incorporated into GXD as
PROGRESS IN DATA ACQUISITION FOR HIGH-                             they become available.
THROUGHPUT EXPRESSION DATA                                            A primary goal of GXD’s RNA-Seq processing pipeline
                                                                   is to identify the unique biological replicate sets for each
RNA-Seq and expression microarray metadata index
                                                                   experiment; determine the averaged quantile normalized
GXD now provides a searchable metadata index of mouse              TPM value for each gene per biological replicate set;
high-throughput expression experiments available in public         and assign each of these TPM values a Present/Absent
repositories (11). We incorporate mouse RNA-Seq and ex-            call in GXD. RNA-Seq expression data files from the
pression microarray experimental metadata from the Gene            Expression Atlas provide TPM values per gene for
Expression Omnibus (GEO) (12) and ArrayExpress (13),               each technical replicate (run) of a given experiment
and apply GXD annotation standards to samples and at-              (TPM/gene/runID/experiment). The samples from which
tributes of experiments that meet GXD’s scope of endoge-           technical replicates are derived (often multiple runs per
nous expression. This includes experiments that examine            sample) are not specified in the TPM data files. The GXD
endogenous expression in wild type and mutant mice, and            metadata index, however, is annotated at the sample level
cover the entire life span of the laboratory mouse (all pre-       (technical replicate identifiers are not included in the index).
and postnatal stages). Researchers can now find compre-            Thus, to join GXD-curated sample metadata with Expres-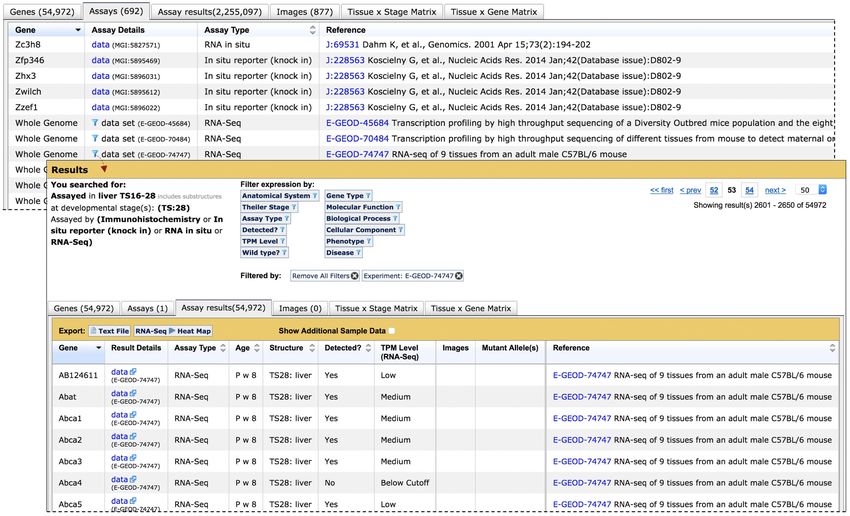
D926 Nucleic Acids Research, 2021, Vol. 49, Database issue

                                                                                                                                                          Downloaded from https://academic.oup.com/nar/article/49/D1/D924/5940496 by guest on 30 May 2021
Figure 1. Overview of GXD high-throughput expression data loads. (A) GXD loads RNA-Seq and microarray metadata from ArrayExpress weekly, to
download experiment-level information for new mouse RNA-Seq and expression microarray experiments. Experiments are evaluated for GXD relevance.
Sample metadata from GXD-relevant experiments are downloaded on demand into a GXD high-throughput sample curation tool, where sample metadata
and experimental variables are annotated using controlled vocabularies and ontologies, and added to the GXD high-throughput expression metadata index,
released weekly. (B) The GXD RNA-Seq Expression Data load runs on demand as new GXD-relevant RNA-Seq experiments become available from the
Expression Atlas (EA). Per experiment, technical replicate identifiers (Run IDs) per Sample are loaded from ArrayExpress and TPM values per gene, per
Run ID are loaded from the Expression Atlas. The load joins technical replicate information to produce TPM values per gene, per run ID, per sample for
each experiment. TPM values per gene from technical replicates (run IDs for a sample) are averaged. Biological replicates are identified by shared GXD-
curated metadata source profiles, and combined in a two step process of (A) quantile normalizing TPM values across bioreplicates for an experiment and
(B) averaging quantile normalized (QN) TPM values for each gene of the bioreplicate set. These averaged, QN TPM values are then mapped to TPM
range bins established by the Expression Atlas, and to a GXD expression threshold (Present/Absent), based on TPM value relative to the Below Cutoff
value range. RNA-Seq expression data are integrated with classical types of GXD expression data through the combination of shared biological source
metadata, shared gene annotations and common use of Present/Absent calls.

sion Atlas TPM values, a second load of run IDs per sam-                      and 85 distinct mouse strains. Mouse genes represented in
ple for each experiment is necessary from ArrayExpress (see                   Expression Atlas RNA-Seq TPM files cover the entire En-
Figure 1B). TPM values per gene from technical replicates                     semble transcriptome (nearly 55 000 genome features), in-
are averaged to account for any technical variation. Then, to                 cluding protein-coding and non-coding RNA genes. Total
lessen the influence of biological sampling variation, and to                 RNA-Seq assay results amount to nearly 35 million, with
avoid excessive redundancy in GXD user interface displays,                    comprehensive genome coverage for each experiment.
sample-level TPM values for biological replicates are com-
bined. Since biological replicate information is not provided
in the files downloaded from the Expression Atlas or Array-                   IMPROVEMENTS TO THE GXD USER INTERFACE
Express, we take advantage of GXD-curated metadata to
identify bioreplicate samples for each experiment. Samples                    RNA-Seq and microarray experiment search
from the same experiment that share all metadata field val-                   The RNA-Seq and Microarray Experiment Search tool
ues are considered bioreplicates. Bioreplicate sample TPM                     [http://www.informatics.jax.org/gxd/htexp index; detailed
values for each gene are consolidated in a two-step process.                  in (11)] enables users to quickly and reliably find specific
For each experiment, sample-level TPM values for biorepli-                    high-throughput expression data sets from the metadata
cate samples are first quantile normalized (15) using python                  index described above. The search form supports detailed
numpy in the Pandas DataFrame, and then these quantile                        queries for RNA-Seq and/or transcription microarray
normalized (QN) TPM values are averaged for each gene                         experiments by attributes of the samples assayed, including
across the bioreplicate sample set. This results in a single                  anatomical structure, developmental stage, mutant gene,
TPM value per gene per set of sample bioreplicates. We                        mouse strain and sex. The search form also provides a
store bioreplicate set information in the database and assign                 text search function that returns experiments by text string
each bioreplicate set a unique identifier (see Figure 4A). Fi-                matches in titles or descriptions. In addition, users can
nally, we map averaged QN TPM values to the same TPM                          search for specific experiments by experiment ID.
range bins used by the Expression Atlas (see Figure 1B), and                     The search results summary provides well organized in-
assign a Present/Absent value based on TPM values relative                    formation profiles of each experiment returned, which in-
to the Below Cutoff value range (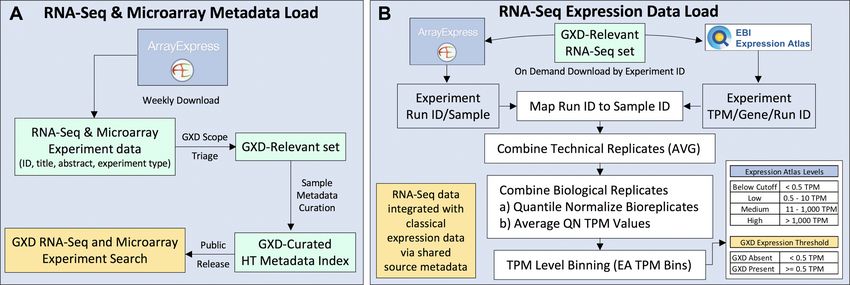
Nucleic Acids Research, 2021, Vol. 49, Database issue D927

                                                                                                                                                                 Downloaded from https://academic.oup.com/nar/article/49/D1/D924/5940496 by guest on 30 May 2021
Figure 2. Integrated Classical and RNA-Seq Expression Results. Partial results from a search for genes expressed in liver, at TS:28 (postnatal), assayed
by classical in situ methods and by RNA-Seq are shown. New features are identified with red arrows, featured links shown as dotted arrows. (A) Search
parameters. (B) Suite of expression result filters. Sample-level filters (left column) restrict expression results by sample metadata, and include the new TPM
Level filter (RNA-Seq data only). New gene-level filters (right column) restrict expression results by gene annotations, including gene type, and high-level
terms for ontology annotations (Gene Ontology, Mammalian Phenotype Ontology, and Disease Ontology). Filters enacted for this result set are shown
(Filtered by). (C) Filtered result set showing Assay results tab (Assays tab view shown in Figure 3). Link-outs indicated by dotted arrows. New sample-level
metadata columns (down arrows) can be shown/hidden with the Show Additional Sample Data toggle (RNA-Seq data-specific columns indicated). A new
Morpheus heat map of RNA-Seq results is rendered by clicking the RNA-Seq  Heat Map button (see Figure 4A). New links to the Expression Atlas
at EBI and the GXD RNA-Seq and Microarray Experiment Summary for RNA-Seq experiments are shown. Links to the GXD assay details (including
images) exhibited in Figure 4C, from the Result Details and Images columns are shown. The complete Assay results set can be exported as text to the user’s
desktop, and includes the new sample-level metadata columns shown.

of all samples for an experiment with their associated meta-                      dard Gene Expression Data Search, which permits query-
data, and the samples that matched search parameters are                          ing for expression data by an array of different search pa-
distinguished. When experiments are returned by text string                       rameters, including user-specified metadata and biomedi-
match, matching text is conveniently highlighted. The sum-                        cally relevant annotation profiles (http://www.informatics.
mary also includes links to relevant external resources for                       jax.org/gxd; Standard Search tab); (b) the GXD Batch
each experiment where available, including PubMed, Array-                         Search tool, which returns expression data from input lists
Express, GEO and the Expression Atlas. Finally, for RNA-                          of genes (http://www.informatics.jax.org/gxd/batchSearch)
Seq experiments included in GXD’s RNA-Seq expression                              and (c) the Mouse Developmental Anatomy Browser,
data load, links are provided to the GXD expression sum-                          where links to expression data from specific anatomical
mary page for the corresponding experiment.                                       structure searches are superimposed on a dynamic hi-
                                                                                  erarchical display of mouse anatomical structures (http:
                                                                                  //www.informatics.jax.org/vocab/gxd/anatomy/). RNA-Seq
New and integrated search capabilities for RNA-Seq and
                                                                                  data are excluded from the default settings of the Standard
classical expression data
                                                                                  Gene Expression Data Search due to the expansive result
Our approach is to add value to RNA-Seq data by in-                               sets common to genome-wide assays; this is clearly indi-
tegration with the other expression data types in GXD,                            cated on the Search Form. RNA-Seq data can be included
and with the genetic, functional, phenotypic and disease-                         with a single click in the Assay types section on the form. To
oriented data in MGI. This integration allows us to provide                       assure responsive system performance, we optimized front
new search and analysis capabilities for RNA-Seq data. The                        end configuration and imposed reasonable limits for Stan-
newly incorporated RNA-Seq data are accessible through-                           dard and Batch GXD searches. For the Standard Gene Ex-
out much of the GXD user interface, including (a) the Stan-                       pression Data search, we set a limit of 21 million expression
D928 Nucleic Acids Research, 2021, Vol. 49, Database issue
assay results. This threshold is high enough to include all and all expression results from the user’s search can be ex-
results for any anatomical structure or developmental stage ported to a text file for further analysis elsewhere. To il-
spanning all assay types (including RNA-Seq). The inter- lustrate the benefits of integrated expression results from
face informs users when their search results pass this thresh- RNA-Seq and classical expression assays, a link to GXD
old, and encourages search refinement. The GXD Batch assay details in the Images column for one of the immuno-
Search has an input limit of 5000 genes. histochemistry assays is indicated (detailed in Figure 4C).
All of GXD’s expression data search forms, and links pro- The other summary views (Genes, Assays, Images, and the
vided from the Gene Expression section of MGI Gene De- Tissue × Stage and Tissue × Gene Matrix tabs) are de-
tail pages lead to the same multi-tabbed displays that sum- scribed elsewhere (8). Slight modifications were made to
marize data at different levels of detail (Genes, Assays, As- the Assays tab and the Tissue x Gene Matrix to accom-
say results, Images) and via two different Matrix Views (Tis- modate the whole genome perspective of RNA-Seq data.
sue × Stage and Tissue × Gene). RNA-Seq data are inte- For the Assays tab, instead of listing all genes for an assay
grated into these summary views when selected on the Stan- (as done for classical assay types), each RNA-Seq experi-
dard search form. Tools provided on these summaries al- ment returned is displayed in a single row, with the option
Downloaded from https://academic.oup.com/nar/article/49/D1/D924/5940496 by guest on 30 May 2021
low users to filter, sort, and iteratively refine search results, to filter the expression result set by that experiment (Fig-
and download the data for further analysis. We have re- ure 3). Links are also provided to the RNA-Seq and Mi-
cently added new gene-level filters that enable users to nar- croarray Experiment summary page for each RNA-Seq ex-
row search results effectively (see Figure 2B). periment. For the Tissue × Gene Matrix, column pagina-
Figure 2 shows results of a search that would be of in- tion (genes) was introduced to manage display of the vast
terest to researchers who study macrophage function in the number of genes that can be included in RNA-Seq results
liver. Search parameter details are displayed in the upper left (not shown).
of the summary (Figure 2A), and users have the option to
open the query form and modify their search at any time.
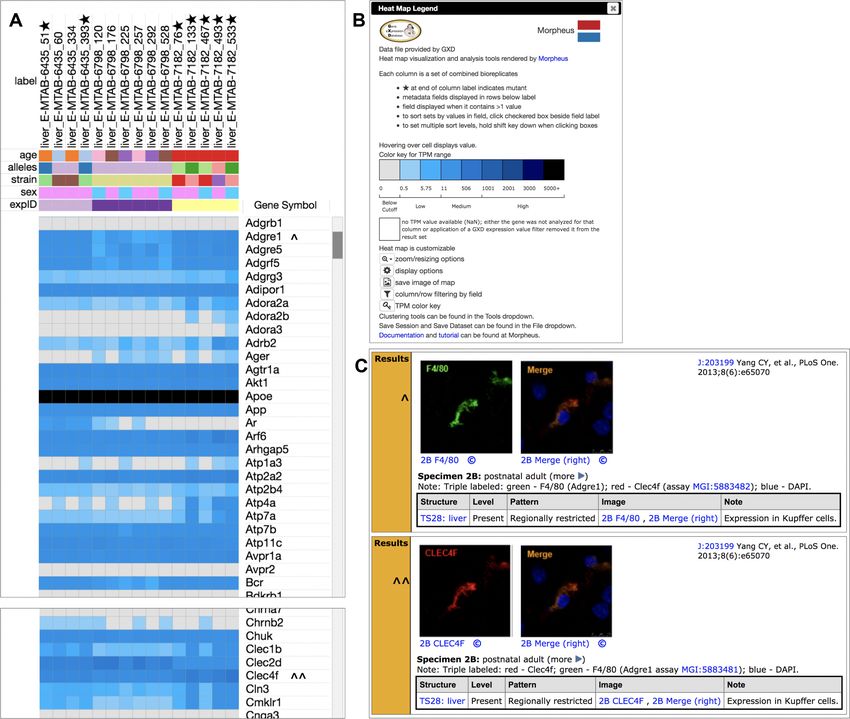
Morpheus heat map of GXD RNA-Seq data
A suite of filters that allows refinement of expression re-
sults is shown in Figure 2B. A new quantitative expression We have embedded the Morpheus heat map visualiza-
filter that restricts RNA-Seq data sets by TPM Level was tion and analysis tool from the Broad Institute (https://
added to pre-existing expression result filters (left-hand col- software.broadinstitute.org/morpheus/) into the GXD in-
umn). Six new gene-level filters (right-hand column) have terface. When RNA-Seq results are present, the expres-
also been added that greatly expand analytical capacity, as sion results summary page provides a link to a Morpheus
users can restrict expression results to sets of genes by gene heatmap (see Figure 2C). This gives users one-click access
type and by annotations to high-level terms of the Gene to the wide range of display and analysis tools offered by
Ontology (GO, 16), Mammalian Phenotype Ontology (MP, the Morpheus resource for RNA-Seq data sets tailored by
17) or Disease Ontology (DO, 18) (Figure 2B). Separate fil- GXD’s powerful search and filtering functions. The Mor-
ters are combined by Boolean AND, while multiple choices pheus heat map rendered for the RNA-Seq results from the
within a filter are combined by Boolean OR. Expression re- GXD query in Figure 2 is shown in Figure 4. The heat map
sults from liver were refined by applying a set of gene-level displays quantitative expression (using a color-coded aver-
filters designed to target genes that have GO and MP anno- age QN TPM value range) for each gene (rows) and the
tations consistent with macrophage function (see Filtered corresponding biological replicate sample sets (columns) re-
by list in Figure 2B). These filters reduced the initial assay turned from the GXD query (Figure 4A).
result set by over 100-fold, by dropping the genes returned Columns in the heat map grid represent biological repli-
from 54 972 (not shown) to 504. cate sets. Column labels are derived from the anatomical
Figure 2C features assay results (partial) for the filtered structure, experiment ID and GXD-assigned bioreplicate
search in Figure 2B, showing integrated expression data set ID of featured biological replicate sets. Stars shown in
from RNA-Seq and Immunohistochemistry assays. Results column labels indicate that the samples were derived from
for two of the 504 genes are shown (Adgrb1 and Adgre1). mutant mice, which is important when interpreting expres-
New metadata columns were added to the Assay Results sion profiles. Wild type samples have no star in the column
tab to distinguish bioreplicate sets (toggled open in Figure label. Morpheus provides column data display tools to help
2C). RNA-Seq data-specific columns include TPM Level, users recognize patterns in the data, including colored meta-
the number of biological replicate samples and a Notes data rows just below the column labels. The tool assigns sep-
field used to record salient metadata features not accounted arate colors to distinct metadata annotations in each meta-
for under other metadata fields. Each RNA-Seq data row data row making it easy to spot common annotations across
in the table represents the expression record (with aver- the sets of bioreplicates (underlying values are displayed on
aged QN TPM value mapped to a TPM Level) from that mouse-over). By default, Morpheus suppresses display of
set of combined bioreplicate samples for the correspond- metadata rows that are shared by all columns, but users can
ing experiment. RNA-Seq rows also feature novel links to include these common rows if desired. Morpheus offers pri-
the Expression Atlas, which offers additional display and mary and secondary metadata sorting by simply clicking on
analysis tools, and to the GXD RNA-Seq and Microar- metadata row labels, while additional sorting and filtering
ray Experiment Summary for the corresponding experi- options are available (for columns and rows) via the main
ment. All RNA-Seq results in the table can be viewed in display tools (see Figure 4B).
a heat map rendered by the Morpheus resource (https:// Rows in the heat map grid represent genes. The default
software.broadinstitute.org/morpheus/) (discussed below), label for gene rows is Gene Symbol, MGI ID and EnsemblNucleic Acids Research, 2021, Vol. 49, Database issue D929
Downloaded from https://academic.oup.com/nar/article/49/D1/D924/5940496 by guest on 30 May 2021
Figure 3. Access to Integrated Results for Specific RNA-Seq Experiments from the Assays Tab. Assays tab view (upper table) of expression results for
RNA-Seq and in situ assays of mouse liver at TS:28. For classical experiment types, each gene analyzed and the assay type used are specified for each
assay, and links are provided to GXD assay details (data) in the Assay Details column. For RNA-Seq experiments, ‘Whole Genome’ is displayed in the
Gene column, because each experiment involves all genes in the Ensembl transcriptome. The default sort for classical expression type assays is by gene
symbol. Whole Genome RNA-Seq experiments are positioned after classical type assays, and are sorted by experiment ID. The transition between classical
type and RNA-Seq assays is shown in the upper table. Users can view integrated expression results for an individual RNA-Seq experiment by clicking on
the filter icon in the Result Details column for that experiment. This applies a filter to the original search, which limits results to the selected RNA-Seq
experiment (lower table). The full suite of annotation filters is now available to explore results from that single experiment. Links to complete expression
results (without search restrictions) for a single RNA-Seq experiment can be obtained from the GXD RNA-Seq and Microarray Experiment Summary
(not shown).
gene ID (reduced to Gene Symbol in Figure 4A). Default data clustering tools under the Tools dropdown menu (not
TPM value color code ranges (shown in the heat map leg- shown). To keep response times manageable, we’ve imposed
end in Figure 4B) were designed to approximate display a 10 million result limit for export to the heat map. A
settings used by the Expression Atlas, facilitating compar- processing progress bar is displayed while the heat map is
ison between resources, and to manage the enormous dy- generated.
namic range of RNA-Seq data (color saturation set at 5000 An example of the value of integrated RNA-Seq and
TPM). Morpheus display options allow users to adjust the classical expression assays is shown for genes Adgre1 and
colors and TPM ranges of the heat map, to improve reso- Clec4f in Figure 4A and C (marked with carets for compar-
lution in any TPM value range desired. The TPM value for ison). GXD assay results of immunohistochemical stain-
any cell is displayed by mouse-over. It is possible to gen- ing in mouse liver reveal spatially-restricted coexpression of
erate a heat map that has some empty cells; these are col- these two genes in Kupffer cells (which are resident liver
ored white and display ‘NaN’ (Not a Number) on mouse- macrophages), while the RNA-Seq heat map provides a
over. This can happen when an expression value filter (TPM quantitative expression survey across the bioreplicate sam-
Level or Detected?) was applied to the GXD result set be- ples included.
fore rendering the heat map (since genes can have a range
of TPM values across the bioreplicate sets present). This
FUTURE DIRECTIONS
can also happen when an experiment has fewer total gene
annotations (if not updated to the latest Ensembl build, ArrayExpress originally imported all data sets present in
for example). The ability to align metadata values with GEO. In fact, 2621 of the 3156 experiments in GXD’s meta-
TPM value ranges allows users to spot biologically signif- data index were originally submitted to GEO. Because Ar-
icant expression profiles, such as sex- or strain-specific ef- rayExpress has stopped importing GEO data, we will im-
fects and expression effects of specific mutants compared plement a direct data load from GEO to supplement our
to wild type samples. Morpheus also offers a range of load from ArrayExpress. Our goal is to provide a complete,D930 Nucleic Acids Research, 2021, Vol. 49, Database issue
Downloaded from https://academic.oup.com/nar/article/49/D1/D924/5940496 by guest on 30 May 2021
Figure 4. Heat Map of RNA-Seq Results. Expression heat map of RNA-Seq data from GXD expression results shown in Figure 2, rendered using the
Morpheus tool. (A) Heat map grid shows quantitative expression of genes (rows) from distinct bioreplicate sample sets (columns). Column labels are derived
from anatomical structure, experiment ID and bioreplicate set ID. Stars indicate mutant samples, wild type samples have no star. Common annotations
for a given metadata type (age, strain, sex, etc.) share the same color in that row (if all samples share the same metadata value, that row is not shown,
by default). Expression data rows (Gene Symbol) reflect average, quantile-normalized TPM values for the corresponding genes in each bioreplicate set,
using a color scheme designed to accommodate the wide dynamic range of TPM values in the data (see B). Cell values (metadata or TPM) are displayed
by hovering over the cell. Genes Adgre1 and Clec4f are marked (carets) for comparison in (C). (B) Heat map legend includes TPM range color key, guide
to usability options (sorting, filtering), pointers to data clustering tools and file saving, and links to documentation at the Morpheus resource. (C) Partial
GXD assay results (immunohistochemical staining) for two genes included in the RNA-Seq heat map (carets in A) reveal coexpression of these genes in
Kupffer cells.
non-redundant index of GXD-relevant RNA-Seq (bulk and The advantages of integrating RNA-Seq expression data
single cell) and microarray expression experiments from into GXD extend beyond the detailed quantitative perspec-
both repositories, with associated biological source meta- tive they provide (compared to RNA in situ or immuno-
data properly annotated and searchable. histochemistry experiments). As a whole-genome method,
We will continue to integrate RNA-Seq data from the EBI RNA-Seq brings more comprehensive information about
Expression Atlas that provide GXD a quantitative perspec- the absence of gene expression in specific tissues compared
tive of endogenous gene expression from wild-type and mu- to in situ studies. For in situ studies, a single section can
tant mice, covering the complete life span of the laboratory demonstrate gene expression, but extensive serial sectioning
mouse. While our literature curation efforts for classical ex- is required to show lack of expression, and this informa-
pression data types have focused on studies of gene expres- tion is often not reported. GXD’s Differential Expression
sion during embryonic development, and will continue to Search takes this sparsity of information about absence of
do so, we have always accepted direct submissions of post- expression into account. The algorithm for searches such as
natal expression data. With the addition of RNA-Seq data, ‘What genes are expressed in liver and not anywhere else?’
our coverage of postnatal expression information has now relies mostly on positive expression results, i.e. the search
increased significantly. will find genes for which there is evidence of expression inNucleic Acids Research, 2021, Vol. 49, Database issue D931
liver and no evidence of expression in any other structure REFERENCES
[see (2) for more detail]. We will revise this algorithm to take 1. Bult,C.J., Blake,J.A., Smith,C.L., Kadin,J.A., Richardson,J.E. and
advantage of the extensive absence of expression informa- the Mouse Genome Database Group. (2019) Mouse Genome
tion provided by RNA-Seq experiments. Including RNA- Database (MGD) 2019. Nucleic Acids Res., 47, D801–D806.
Seq data in differential expression searches will expand the 2. Smith,C.M., Hayamizu,T.F., Finger,J.H., Bello,S.M., McCright,I.J.,
Xu,J., Baldarelli,R.M., Beal,J.S., Campbell,J.W., Corbani,L.E. et al.
utility of these searches, and we plan to leverage this utility (2018) The mouse Gene Expression Database (GXD): 2019 update.
by providing additional support for differential expression Nucleic Acids Res., 47, D774–D779.
analyses in general. 3. Drabkin,H.J., Christie,K.R., Dolan,M.E., Hill,D.P., Ni,L.,
We plan to expand the accessibility and benefit of cell Sitnikov,D. and Blake,J.A. (2015) Application of comparative biology
in GO functional annotation: the mouse model. Mamm. Genome, 9,
type information in GXD by including annotations to the 574–583.
Cell Ontology (19) in our expression records. Such infor- 4. Ruzicka,L., Howe,D.G., Ramachandran,S., Toro,S., Van Slyke,C.E.,
mation is currently recorded in notes fields (as indicated in Bradford,Y.M., Eagle,A., Fashena,D., Frazer,K., Kalita,P. et al.
Figure 4C). The combined use of terms from the anatomy (2019) The Zebrafish Information Network: new support for
ontology and the cell ontology will refine our standardized non-coding genes, richer Gene Ontology annotations and the
Downloaded from https://academic.oup.com/nar/article/49/D1/D924/5940496 by guest on 30 May 2021
Alliance of Genome Resources. Nucleic Acids Res., 47, D867–D873.
representation of expression patterns and add new search 5. Fortriede,J.D., Pells,T.J., Chu,S., Chaturvedi,P., Wang,D.,
capabilities. This representation also enables future integra- Fisher,M.E., James-Zorn,C., Wang,Y., Nenni,M.J, Burns,K.A. et al.
tion of single-cell RNA-Seq (scRNA-Seq) data, for which (2020) Xenbase: deep integration of GEO & SRA RNA-seq and
GXD can provide important tools for further interpreta- ChIP-seq data in a model organism database. Nucleic Acids Res., 48,
D776–D782.
tion and analysis. For example, the marker sets that distin- 6. Antin,P.B., Yatskievych,T.A., Davey,S. and Darnell,D.K. (2014)
guish cell clusters discovered through scRNA-Seq studies GEISHA: an evolving gene expression resource for the chicken
must be analyzed further, such as by in situ experiments, embryo. Nucleic Acids Res., 42, D933–D937.
to confirm and characterize potential new cell types. GXD 7. Smith,C.M., Finger,J.H., Kadin,J.A., Richardson,J.E. and
currently records RNA in situ and immunohistochemistry Ringwald,M. (2014) The gene expression database for mouse
development (GXD): putting developmental expression information
data, including data published in conjunction with scRNA- at your fingertips. Dev. Dyn., 243, 1176–1186
Seq experiments, thus we are well positioned to support 8. Finger,J.H., Smith,C.M., Hayamizu,T.F., McCright,I.J., Xu,J.,
gene/marker-driven discovery of new cell types. This illus- Eppig,J.T., Kadin,J.A., Richardson,J.E. and Ringwald,M. (2015) The
trates the value of analytical cross-inspection of different mouse gene expression database: New features and how to use them
effectively. Genesis, 53, 510–522.
expression data types, facilitated by GXD’s integrated data 9. Hayamizu,T.F., Baldock,R.A. and Ringwald,M. (2015) Mouse
platform. anatomy ontologies: enhancements and tools for exploring and
integrating biomedical data. Mamm. Genome, 26, 422–430.
10. Finger,J.H., Smith,C.M., Hayamizu,T.F., McCright,I.J., Xu,J.,
USER SUPPORT Law,M., Shaw,D.R., Baldarelli,R.M., Beal,J.S., Blodgett,O. et al.
GXD provides support to its users through dedicated User (2017) The mouse Gene Expression Database (GXD): 2017 update.
Nucleic Acids Res., 45, D730–D736.
Support personnel, detailed on-line documentation and 11. Smith,C.M., Kadin,J.A., Baldarelli,R.M., Beal,J.S., Blodgett,O.,
quick tutorials. User Support can be contacted via email Giannatto,S.C., Richardson,J.E. and Ringwald,M. (2020) GXD’s
at mgi-help@jax.org or by clicking the ‘Contact Us’ link RNA-Seq and Microarray Experiment Search: using curated
in the navigation bar at the top of all web pages. Upon re- metadata to reliably find mouse expression studies of interest.
quest User Support will provide remote interactive train- Database (Oxford), 2020, baaa002.
12. Clough,E. and Barrett,T. (2016) The gene expression omnibus
ing sessions and on-site visits. The online documentation database. Methods Mol. Biol., 1418, 93–110.
can be accessed by clicking on the question mark in the 13. Athar,A., Füllgrabe,A., George,N., Iqbal,H., Huerta,L., Ali,A.,
upper corner of most pages. Quick tutorials (and links to Snow,C., Fonseca,N.A., Petryszak,R., Papatheodorou,I. et al. (2019)
other informational material) can be found on the Help ArrayExpress update - from bulk to single-cell expression data.
Nucleic Acids Res., 47, D711–D715.
tab of the GXD home page (http://www.informatics.jax.org/ 14. Papatheodorou,I., Fonseca,N.A., Keays,M., Tang,Y.A., Barrera,E.,
expression.shtml). Bazant,W., Burke,M., Füllgrabe,A., Fuentes,A.M., George,N. et al.
(2018) Expression Atlas: gene and protein expression across multiple
studies and organisms. Nucleic Acids Res., 46, D246–D251.
CITING GXD 15. Hicks,C. and Irizarry,R.A. (2014) When to use quantile
The following citation format is suggested when refer- normalization? bioRxiv doi: https://doi.org/10.1101/012203, 04
December 2014, preprint: not peer reviewed.
ring to data downloaded from GXD: These data were re- 16. The Gene Ontology Consortium (2019) The Gene Ontology
trieved from the Gene Expression Database (GXD), Mouse Resource: 20 years and still GOing strong. Nucleic Acids Res., 47,
Genome Informatics, The Jackson Laboratory, Bar Har- D330–D338.
bor, Maine, USA (URL: http://www.informatics.jax.org) 17. Smith,C.L. and Eppig,J.T. (2012) The Mammalian Phenotype
Ontology as a unifying standard for experimental and
on [date (month, year) when you retrieved the data cited]. high-throughput phenotyping data. Mamm. Genome, 23, 653–668.
To reference the database itself, please cite this article. 18. Bello,S.M., Shimoyama,M., Mitraka,E., Laulederkind,S.J.F.,
Smith,C.L., Eppig,J.T. and Schriml,L.M. (2018) Disease Ontology:
improving and unifying disease annotations across species. Dis.
FUNDING Model. Mech., 11, dmm032839.
GXD is supported by the Eunice Kennedy Shriver Na- 19. Bard,J., Rhee,S.Y. and Ashburner,M. (2005) An ontology for cell
types. Genome Biol., 6, R21.
tional Institute of Child Health and Human Develop-
ment (NICHD) of the National Institutes of Health (NIH)
[HD062499]. Funding for open access charge: NIH.
Conflict of interest statement. None declared.You can also read


