Interactive volume rendering using the Oculus Rift and the Visualization Toolkit - Jordy Perlee
←
→
Page content transcription
If your browser does not render page correctly, please read the page content below
Bachelor Informatica
Computer Science — University of Amsterdam

                                             Interactive volume rendering
                                             using the Oculus Rift and the
                                             Visualization Toolkit

                                             Jordy Perlee

                                             June 17, 2015

                                             Supervisor(s): R.G. Belleman (UvA)
                                             Signed: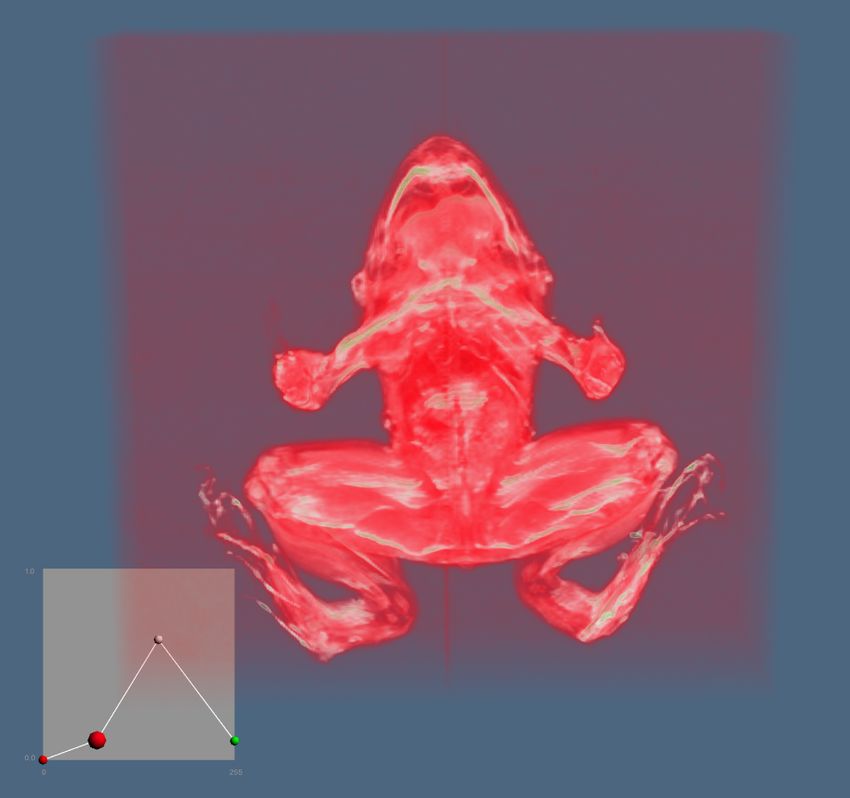
2
Abstract

During research, scientific visualization is used to gain an understanding of the gathered data.
Volume rendering is a visualization technique which renders the complete data set. Researchers
can precisely specify what parts of the data should be displayed by editing the opacity transfer
function and color transfer function, which specify the color and opacity of segments of the data
set. The application made in this thesis expands upon this by creating a virtual environment
displayed on the Oculus Rift from where the rendered volume can be inspected and the transfer
functions can be manipulated, searching for the extent to which this can help researchers in their
analyses. Here we show that this application is indeed capable of aiding researchers, limited
by the computational power of the system it runs on. The application produced is capable of
performing volume rendering and displaying the result on the Oculus Rift. From this virtual
environment researchers can manipulate the transfer functions to highlight interesting parts of
the data set. Because of the computational complexity of volume rendering, large data sets will
have to be scaled down in order for the application to remain responsive. This thesis demonstrates
how a complicated process such as volume rendering can be made intuitive, as well as allowing
researchers to view their data from different perspectives within a virtual environment. This
application is expected to provide a base for future work, where more powerful hardware and
more intuitive input mechanisms allow for the application to be expanded and improved upon.
2
Contents

1 Introduction                                                                                                                                                5
  1.1 Related work . . . . . . . . . . . . . . . . . . . . . . . . . . . . . . . . . . . . . .                                                                6

2 Design                                                                                                                                                      9
  2.1 OculusVTK . . . . . . . . . . . . . . . . . . . . . . . . . . . . . . . . . . . . . . .                                                                10
  2.2 Interaction within a virtual environment . . . . . . . . . . . . . . . . . . . . . . .                                                                 10

3 Implementation                                                                                                                                             11
  3.1 Extending the OculusVTK interactor . . . . . . . . . . . . . . . . . . . . . . . . .                                                                   11
  3.2 Manipulating the transfer functions . . . . . . . . . . . . . . . . . . . . . . . . . .                                                                12
  3.3 The control scheme . . . . . . . . . . . . . . . . . . . . . . . . . . . . . . . . . . .                                                               14

4 Experiments                                                                                                                                                17
  4.1 Setup . . . . . . . . . . . . . . . . . . . . . .                      .   .   .   .   .   .   .   .   .   .   .   .   .   .   .   .   .   .   .   .   17
  4.2 Real-time manipulation of transfer functions .                         .   .   .   .   .   .   .   .   .   .   .   .   .   .   .   .   .   .   .   .   17
  4.3 Performance of OculusVTK . . . . . . . . . .                           .   .   .   .   .   .   .   .   .   .   .   .   .   .   .   .   .   .   .   .   18
      4.3.1 The coral data set . . . . . . . . . . .                         .   .   .   .   .   .   .   .   .   .   .   .   .   .   .   .   .   .   .   .   18
      4.3.2 Uniform data set . . . . . . . . . . . .                         .   .   .   .   .   .   .   .   .   .   .   .   .   .   .   .   .   .   .   .   18

5 Results                                                                                                                                                    21
  5.1 Ease of use . . . . . . . . . .    .   .   .   .   .   .   .   .   .   .   .   .   .   .   .   .   .   .   .   .   .   .   .   .   .   .   .   .   .   21
  5.2 Performance . . . . . . . . . .    .   .   .   .   .   .   .   .   .   .   .   .   .   .   .   .   .   .   .   .   .   .   .   .   .   .   .   .   .   22
      5.2.1 The coral data set . .       .   .   .   .   .   .   .   .   .   .   .   .   .   .   .   .   .   .   .   .   .   .   .   .   .   .   .   .   .   22
      5.2.2 The uniform data set .       .   .   .   .   .   .   .   .   .   .   .   .   .   .   .   .   .   .   .   .   .   .   .   .   .   .   .   .   .   22

6 Conclusion                                                                                                                                                 25
  6.1 Future work . . . . . . . . . . . . . . . . . . . . . .                            .   .   .   .   .   .   .   .   .   .   .   .   .   .   .   .   .   26
      6.1.1 Different methods of user input . . . . . . .                                .   .   .   .   .   .   .   .   .   .   .   .   .   .   .   .   .   26
      6.1.2 Performance increase with the Oculus Rift .                                  .   .   .   .   .   .   .   .   .   .   .   .   .   .   .   .   .   26
      6.1.3 Using VTK event system . . . . . . . . . .                                   .   .   .   .   .   .   .   .   .   .   .   .   .   .   .   .   .   26
      6.1.4 Additional features . . . . . . . . . . . . . .                              .   .   .   .   .   .   .   .   .   .   .   .   .   .   .   .   .   27

A Examples of volume rendered data using OculusVTK                                                                                                           31

B Application user guide                                                                                                                                     35
  B.1 Build and install VTK . . . . . . . . . . . . . . . . . . . . . . . . . . . . . . . . .                                                                35
  B.2 Build and install the Oculus SDK . . . . . . . . . . . . . . . . . . . . . . . . . . .                                                                 35
  B.3 Building and using OculusVTK including interactive volume rendering . . . . . .                                                                        35

C Results of performance experiments                                                                                                                         37

D API documentation                                                                                                                                          41

                                                         3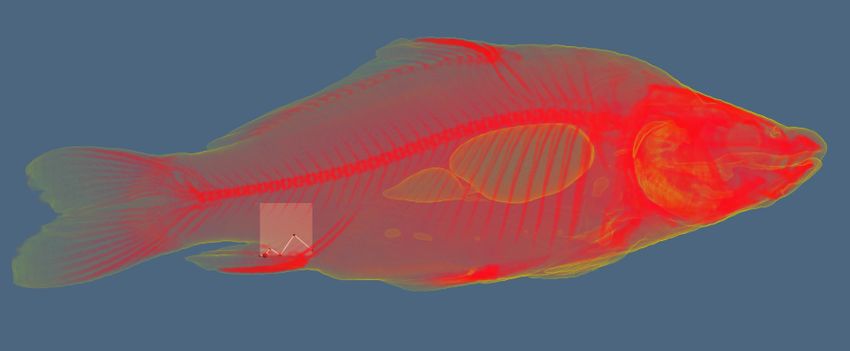
4
CHAPTER 1

                                                                            Introduction

Simulations and other scientific experiments can generate large amounts of numerical data. An-
alyzing this data and drawing conclusions from this data can, however, be troublesome due the
size and complexity of the data sets. For this reason, scientific visualization is used to convert
the numerical data into visual objects, which helps to understand the data and the underlying
patterns, and to draw conclusions [10]. A popular application to perform scientific visualization
is the Visualization Toolkit (VTK) [7].
    Within scientific visualization many different techniques exist [5]. A noteworthy one, and
the focus of this thesis, is volume rendering. Volume rendering differs from other rendering
techniques in that it uses the full data set [11], unlike other visualization techniques that extract
specific features from the data. These examples are shown in figure 1.1. The left image shows a
skull where multiple surfaces have been extracted and rendered, whereas the right image shows
the same data set rendered using volume rendering. In this case, volume rendering shows a better
approximation of the reality.

   (a) The surfaces of a skull and the surround-        (b) The same data set visualized using volume
   ing tissue extracted and visualized using sur-       rendering. In this example the skull is high-
   face rendering.                                      lighted using a higher opacity value.

              Figure 1.1: Volume rendering compared to isosurface rendering [12].

   Volume rendering finds its use in various fields of study such as the medical field, where the
data obtained from, for example, a computed tomography (CT) scan is rendered using volume
rendering [4]. The core of volume rendering lies in its opacity transfer function and color transfer
function. With volume rendering, ray casting is applied from the observer’s viewpoint, passing
through the data. Using an opacity transfer function and a color transfer function, every value

                                                    5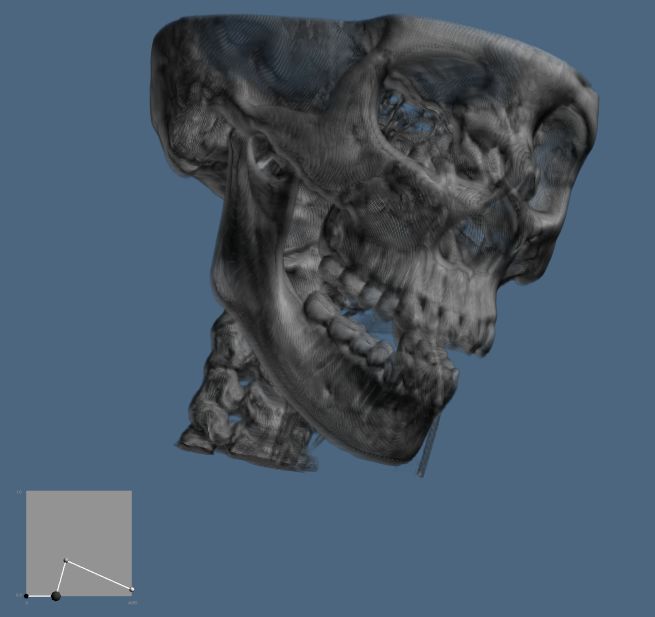
in the data set is assigned an opaqueness and color. The rays pass through the data and use
these values from the transfer functions to calculate the color of each pixel [11]. This allows for
precise control over the opacity and color of parts of the rendered data, and thus over what parts
of the data are displayed on screen.
    Virtual reality offers new ways of interacting with scientific visualizations, allowing for en-
hanced visual perception and interaction with the visualized data [3]. Because this enhanced
perception is expected to help researchers understand their data better than with normal vi-
sualization, this thesis will introduce a virtual environment to VTK. This virtual environment
is displayed using the Oculus Rift Development Kit 2 head-mounted display, which displays a
stereoscopic three-dimensional (3D) image to the user and is capable of tracking the head’s move-
ment and orientation [15]. Applications designed for virtual reality have extra requirements that
it should fulfill to provide a pleasant experience to users. For the Oculus Rift, these include a
response time of 20 milliseconds or less and to maintain a frame rate of 75 frames per second
[14].
    Because of the precise behaviour of the transfer functions, it is desirable that these functions
can be manipulated without having to leave the virtual environment. The goal of this thesis
therefor is to extend VTK to include real-time manipulation of a volume rendering pipeline from
within such a virtual environment. The accompanying research question is:
   • What is the extent to which VTK can utilize the Oculus Rift to help researchers in their
     analyses?

   In the next section related work is described and their influence is explained. The following
chapter contains details about the design of the application. The third chapter describes how the
application is implemented. The fourth chapter describes the experiments that were performed.
The fifth chapter provides an overview of the obtained results. The sixth and final chapter
provides an answer to the aforementioned research question, as well as recommendations for
future research.

1.1 Related work
Because manipulating the various parameters of a volume rendering pipeline, including the opac-
ity and color, is a precise operation, applications exist to make it more intuitive. One such
application is ParaView developed by Kitware Inc. [6], the developers of VTK. ParaView is an
application built on VTK used to make data visualization easier. A specific example, which also
became an influence for this thesis, is the method with which the opacity transfer function and
color transfer function in volume rendering can be manipulated. As can be seen in figure 1.2a,
ParaView uses a graph to manipulate these functions.
    The upper graph can be used to manipulate the opacity, where the X-axis represents the
scalar values in the data set and the Y-axis the opacity, ranging from 0.0 (fully transparent) to
1.0 (fully opaque). To create more complex and precise opacity functions, points can be added to
the graph. The lower graph represents the color transfer function, with the resulting colors also
showing in the opacity graph. By manipulating the lower graph, different colors can be assigned
to different values in the data set.
    The Cave Volume Renderer (CAVORE) [2, 1] provided a system that allows users to explore
three-dimensional data sets from within a virtual environment. It supports volume rendering
as well as real-time manipulation of its transfer functions. Whereas the manipulation of these
values is also possible in other application, in CAVORE this can be done from within the virtual
environment. As can be seen in figure 1.2b, CAVORE uses a graph-based approach to manipulate
the volume rendering pipeline similar to how it is done in ParaView.
    Both ParaView and the CAVORE use a similar visual editor to represent and manipulate
the transfer functions, instead of using plain text values. CAVORE also provides an example
of interaction with such a visual editor from within a virtual environment. In this thesis these
same ideas will be used and further explored, allowing for real time manipulation of the transfer
functions through graphs as well as immediate feedback of these manipulations. In the next
chapter these ideas will be used to design the application.

                                                 6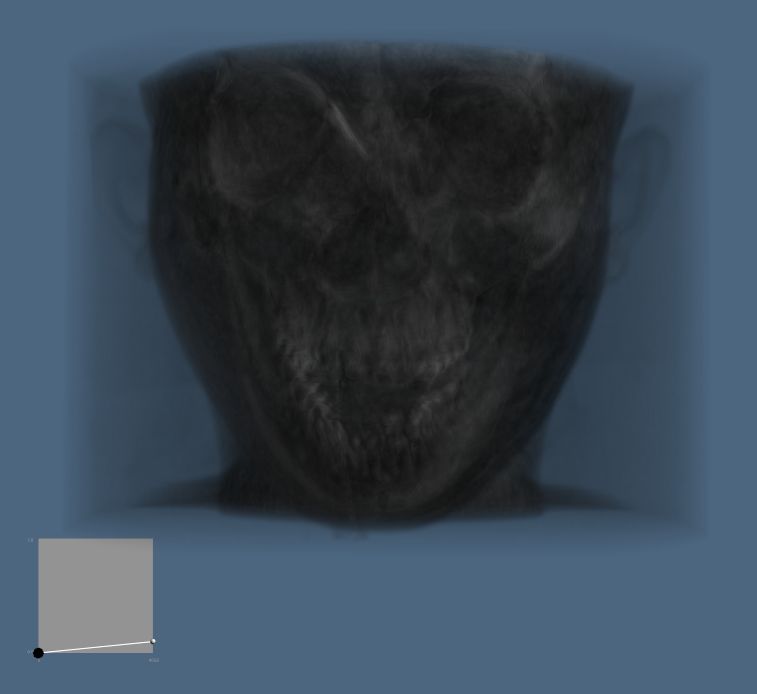
(a) ParaView’s Color Map Editor [8].

              (b) CAVORE’s transfer function editor [2, 1].

Figure 1.2: Graph based approaches for manipulating transfer functions.

                                   7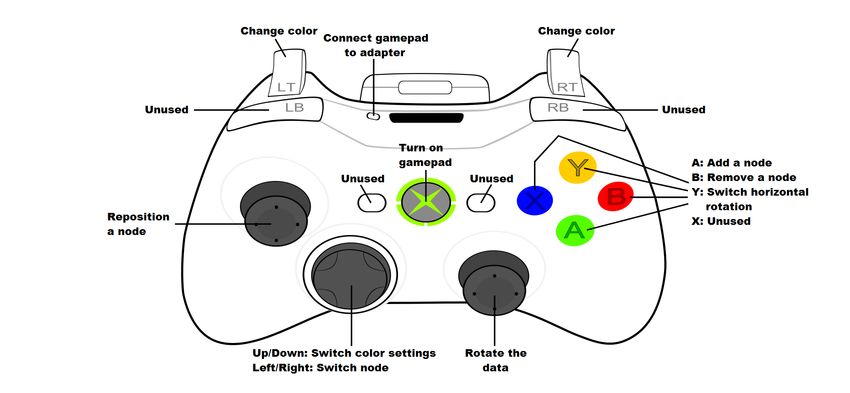
8
CHAPTER 2

                                                                                    Design

In this chapter an overview of the design of the interaction system will be provided. First an
overview about how the application is designed is given, as well as what choices are made with
regards to the design of the application. Following this is information about OculusVTK, the
library used for using VTK with the Oculus Rift.
    As mentioned in the introduction, the goal of this thesis is to create an interactive virtual
environment for VTK in which a volume rendering pipeline can be manipulated. This pipeline,
as can be seen in figure 2.1, contains two input segments which make up the rendered volume.
The first segment is the data that is to be rendered, the second segment contains the various
properties that can be set, including the color transfer function and the opacity transfer function.
The blue module and arrows in figure 2.1 indicate where the changes to the original pipeline are
made. In this application the interactor has been modified and links from the interactor to
the volume properties have been added, allowing the interactor to make changes to the volume
properties which are to be applied in the next render pass.

                   Figure 2.1: Simplified volume rendering pipeline in VTK.

   A number of requirements have been set up so that the application fulfills the aforementioned
goal. These requirements are:

   • The application must be able to perform volume rendering.

   • The rendered image must be displayed on the Oculus Rift.

   • The user must be able to, physically, move freely around the object.

   • The transfer functions must be manipulable from within the virtual environment.

                                                 9
2.1 OculusVTK
OculusVTK is a library for VTK developed by Casper van Leeuwen, visualization consultant
at SurfSARA. This library adds new classes to VTK that can be used from a normal pipeline.
OculusVTK consists of two main parts, the renderer and the interactor. The renderer adds the
capability of rendering stereoscopic 3D images to the Oculus Rift. The interactor allows for
interaction within this virtual environment. The interaction model provided allows for simple
movements within the virtual environment. These movements include moving forward, backward
and sideways, turning and rolling the camera and increasing the motion speed. The methods
supported for user input are keyboards, mouses and gamepads.
2.2 Interaction within a virtual environment
Following the aforementioned requirements, this application requires two forms of user interac-
tion. The first form is to be able to manipulate the object that is rendered, editing the opacity and
color using transfer functions. The second form is to be able to interact with the virtual world,
further exploring the rendered data by physically moving around it. This form is integrated in
OculusVTK.
For editing transfer functions, first a suitable representation for these functions has to be
chosen which is both intuitive and easily editable from within the virtual environment. The
chosen method is a visual editor following the examples set by CAVORE and ParaView, as
shown in figure 1.2.
10CHAPTER 3
Implementation
In this chapter insights on the technical aspects of the implementation of the application will be
given. The base of this application is to manipulate transfer functions through the use of a visual
editor in the virtual environment. The implementation consists of a number of steps. First a
custom interactor has to be attached to the interactor of OculusVTK. Then, an environment has
to be defined in which these transfer functions can be manipulated. Finally a control scheme
which allows for interaction with the transfer functions and the virtual environment has to be
implemented. For instructions on how to install and run this application, refer to appendix B.
3.1 Extending the OculusVTK interactor
In order to create a new interaction method for volume rendering, first the current interactor of
OculusVTK, as can be seen in figure 2.1, had to be modified, splitting the interactor up into two
parts. These two parts are highlighted in figure 3.1.
Figure 3.1: The interactor has been split into two parts. The events are generated by OculusVTK
and then passed to the volume interactor.
The upper module in figure 3.1 illustrates the original interactor. Every update cycle this
interactor collects the input from the keyboard, mouse and gamepad. The collected data is then
interpreted and stored in public variables. These variables include, amongst others, the current
displacement of the joysticks and which buttons have been pressed. The original version of this
interactor would immediately perform actions based on the interpreted data. This has been
edited, and a clear separation between the collection of data and handling events has been made.
11Furthermore, it has been edited to support a separate class which can handle the interpreted
events, thus overriding the local event handler.
This separate class is called the vtkVolumeInteractor, and is made specifically for this appli-
cation. In the main pipeline this class can be instantiated, and by using the function SetEven-
tHandler() from OculusVTK’s interactor class the event handler can be attached to OculusVTK.
Next to this, the event handler requires the references to the transfer functions used in the
pipeline, as well as the upper and lower bounds of the data set, which can be obtained from the
class that reads the source data.
Figure 3.2 shows the class diagram of this application, providing insight on how the new event
handler is attached to OculusVTK. OculusVTK’s interactor is called vtkInteractorStyleGame
and the event handler is called vtkVolumeInteractor. As can be seen, the vtkVolumeInteractor
class is fully separated, only connected to vtkInteractorStyleGame using two links. When these
links are severed and vtkVolumeInteractor is not included, the remainder of OculusVTK still
functions as expected and vtkInteractorStyleGame will handle the events it generates. The
vtkVolumeInteractor class uses two structs called point and history, which are used to define the
structures of nodes in the graph, which are doubly linked lists, and to keep record of the buttons
pressed in the previous frame respectively. This history is needed to recognize when a button
is being held for multiple frames, meaning no action is required. More information about the
vtkVolumeInteractor class can be found in appendix D.
Figure 3.2: A class diagram showing how the vtkVolumeInteractor is connected to the vtkInter-
actorStyleGame.
3.2 Manipulating the transfer functions
The core of this application is its ability for manipulating the transfer functions from within
the virtual environment. As mentioned before, this manipulation is built upon the ideology of
ParaView and CAVORE, using a visual editor to manipulate the transfer functions.
A graphical representation of the default editor is shown in figure 3.3a. The graph is rendered
using a vtkPlaneSource positioned in the origin of the virtual world. On this plane various nodes
can be placed, depicting key locations in the graph. These key locations are visualized using the
vtkSphereSource class. The graph itself is drawn as a line, connecting the key locations using
12linear interpolation. Any changes made in this editor are directly communicated to the respective
transfer functions, which are then applied in the next rendered frame.
The nodes in this graph serve two purposes. The first purpose is manipulating the opacity
transfer function using the values on the X-axis, which represents the scalar values of the data
set, and the values on the Y-axis, which represents the opaqueness ranging from 0.0 (fully
transparent) to 1.0 (fully opaque). These values are directly entered into the opacity transfer
function.
(a) Default transfer function editor. (b) Resulting transfer function.
Figure 3.3: The transfer function editor allows for the addition and removal of nodes, the move-
ment of nodes and the adjustment of the color. The X-axis of the editor shows the range of
scalar values in the data set, and the Y-axis shows the opacity. ranging from 0.0 to 1.0.
The second purpose of these nodes is manipulating the color transfer function. This is done
using the values on the X-axis as well as the color of the node. Similarly to the opacity transfer
function, these values are directly entered into the respective transfer function, and the inter-
polation between the different coloured nodes is linear. This means that, in the case of a red
node and a blue node, the color will linearly transition from red, to purple, to blue. The color
transfer function manipulator supports two different color settings. The first one, as shown in
figure 3.3a, is gray-scale. The second, as shown in figure 3.3b, is based on the hue-saturation-
value (HSV) color space with maximum saturation and value. These settings can be switched
for each individual node.
The default editor, shown in figure 3.3a, consists of two nodes on the edges of the editor and a
10 percent ramp, a common choice in volume rendering packages such as provided by ParaView.
The functionality supported by the nodes are the addition, removal, repositioning and recoloring
of nodes. When a node is added it is placed exactly in between the currently selected node
and the next node, so that it initially has no effect on the opacity transfer function. When the
rightmost node is selected, it is placed in between that node and the previous node. Nodes can
also be removed from the graph. When a node is removed the graph is recalculated, linearly
interpolating between the two nodes surrounding the removed node. Edge nodes can not be
removed.
When a node is selected, indicated by its increased size, it can be repositioned both hori-
zontally and vertically. Vertical movements affect only the opacity, whilst horizontal movements
affect both transfer functions. Nodes cannot be moved beyond the surrounding nodes and edge
nodes can only be moved vertically. A node can also be recolored using both color settings. The
initial color of a node is red.
133.3 The control scheme
The aforementioned actions all have to be mapped to a form of user input. The interaction in
this application is split up into two parts. The first part uses the input to manipulate the view
and position of the user in the virtual world. This is done using the positional and rotational
trackers in the Oculus Rift, and is handled by the OculusVTK library. The second part takes
the user input to manipulate objects in the virtual environment.
In order to interact with the visual editor a form of user input is required which also meets
the aforementioned requirements. More specifically, it should not limit the user to a specific
position, as is the case when using a mouse and a keyboard limiting the user to a desk. The
chosen method for user input is a gamepad, in this case the wireless Xbox 360 gamepad. This
controller is small, lightweight and it does not limit the user to a specific position. Furthermore,
it has a relative simple and recognizable button layout when compared to a normal keyboard,
which is important because the user cannot physically see the gamepad while wearing the Oculus
Rift. Figure 3.4 shows an overview of the available buttons on the gamepad.
Figure 3.4: Overview of the buttons on an Xbox 360 gamepad [9].
The left joystick is an analog joystick that measures the horizontal and vertical displacement
of the joystick relative to its center. Because it is analog, movements can be measured more
accurately than with digital buttons. For this reason this joystick is used to reposition nodes in
the graph. A downside is that joysticks suffer from deadzone, a radius around the center where
the joystick would come to a standstill. It would seem as if the joystick is in its center, but the
values registered are not exactly 0. Therefor, only displacements of more than 15 percent, which
was deduced by trial and error, are used.
The right joystick has the same properties as the left joystick. This joystick is used to rotate
the rendered data, making it easier to inspect the data from every angle. The rotation is applied
to the coordinate system of the vtkActor which represents the data. Horizontal displacements
cause a rotation around the Y-axis and vertical displacements cause a rotation around the X-axis.
The directional pad consists of four digital buttons located on top, bottom, right side and left
side. The left and right directional buttons are used to select a different node. By pressing the
left button, the newly selected node becomes the previous node of the currently selected node,
and by pressing the right button the newly selected node is the next node. Pressing left at the
very first node or right at the very last node has no effect. By pressing the up or down buttons
on the directional pad, the color settings can be switched from color to gray-scale and vice versa.
On the right side of the controller there are four digital face buttons labeled A, B, X and Y. In
video games the A button is often used to start or accept an action, while the B button is used to
decline an action or go back. For this reason, the A button is used to create a new node in between
the current node and its successor, whilst the B button removes the currently selected node. As
14the aforementioned analog sticks only measure displacement on two axes, whilst rotation can be
applied on three axes, the Y button switches the axis on which the horizontal displacement of
the right analog stick is applied to either the Y-axis or Z-axis.
On top of the controller there are two analog triggers which can measure how much pressure
is applied to the button. Because of its analog nature, these buttons are used to recolor a node.
By holding the right analog trigger, the color of a node increases in hue when in color, or in value
when in gray-scale. Pressing the left analog trigger makes the color transition go the other way.
The applied amount of force regulates the speed at which the application cycles through the
colors. Following the ideology of the circular nature of the HSV color space, when the maximum
or minimum hue is reached it will continue with the minimum or maximum hue respectively.
In the next chapter experiments will be carried out to test whether the application reaches
the goal set in the introduction and if it meets the requirements specified in the design. By
measuring the performance, results are gathered in order to provide an insightful answer to the
research question stated in the introduction.
1516
CHAPTER 4

                                                                     Experiments

This chapter consists of two parts. In the first part the experiments that test the implementation
with regards to the ease of use are discussed. In the second part the experiments that have been
carried out to measure the performance are discussed.

4.1 Setup
For all experiments the used setup was the same. The specifications of the used system are listed
in table 4.1.

 Processor                             Intel Core i7-5930K - 6 cores - Up to 3.5 GHz (3.7 GHz turbo)
                                       MSI NVIDIA GTX Titan Black -
 Graphical Processing Unit (GPU)
                                       6144 MB GDDR5 memory - 5,121 GFLOPS
 Random Access Memory (RAM)            16GB DDR4 - 2800MHz
                                       Sandisk Extreme USB 3.0 Flashdrive - 32 GB -
 Harddrive
                                       245 MB/s read - 100 MB/s write
                                       2 x 24 inch Full HD (1920x1080) displays - Oculus Rift DK2
 Displays
                                       with Full HD (1920x1080) display
 Operating System (OS)                 Ubuntu 14.10
 Controls                              Xbox 360 wireless gamepad

                Table 4.1: Specifications of the system used during experiments

   Because OculusVTK uses Graphical Processing Unit (GPU) ray casting for volume rendering,
the key component which will potentially become the bottleneck is the GPU. As mentioned in
table 4.1, the system used during experiments has a GTX Titan Black GPU, able to achieve a
performance of 5.121 ∗ 109 floating-point operations per second [13].

4.2 Real-time manipulation of transfer functions
As was mentioned in the introduction, the goal of this thesis is to create an application in which
transfer functions can be manipulated from a virtual environment. To make it real-time, these
changes should then immediately be applied on the rendered volume. In order to confirm this
functionality the application was tested extensively throughout the process. The researchers of
SurfSARA who developed OculusVTK were also invited to test the application.
   The tests performed consisted of the researchers using the application with only a brief
explanation of the controls. The researchers were then presented with the data sets shown in
appendix A. Using the application they had to modify the transfer functions to observe whether
everything worked as they expected it to work. Their comments, as well as notable examples of
the produced data sets, are discussed in the results.

                                               17
4.3 Performance of OculusVTK
In order to further answer the research question it is needed, next to the usability of the applica-
tion in terms of ease of use, to test its performance and determine if it can be used for real data
sets. Performance, in this case, is defined as the frame rate: the number of frames OculusVTK
can render per second.
4.3.1 The coral data set
For this experiment the application uses volume rendering to render a scan of coral, which
has resulted in a large data set with dimensions of 2000 by 2000 by 928 data points. To test
different sizes of data, this data set is then resized using a Lanczos-windowed sinc filter which is
implemented in the vtkImageResize class. The scale factors and resulting dimensions are listed
in table 4.2. These experiments were performed five times per scale factor, with and without the
Oculus Rift attached. During these experiments, the controller was turned off and the Oculus
Rift was put on a stand. This was to ensure that the viewport would remain the same during
the experiments. The opacity transfer function and color transfer function used were the default
settings, shown in figure 3.3a.
Scale factor X axis Y axis Z axis
1
/8 250 250 116
2
/8 500 500 232
3
/8 750 750 348
4
/8 1000 1000 464
5
/8 1250 1250 580
6
/8 1500 1500 696
7
/8 1750 1750 812
1 2000 2000 928
Table 4.2: Scale factors used during experiments and the resulting dimensions, measured in
number of scalar values per axis.
To measure the frame rate, the application hooks a callback to the EndEvent signal of the
renderer. This means that whenever the renderer is finished rendering a frame, it invokes an
EndEvent. All callbacks hooked to that event will then be called, including the frame rate
measuring callback. This callback requests the renderer’s most recent render time in second,
which it uses to calculate the frame rate for that single frame. This process is repeated 500 times,
measuring the highest frame rate achieved, the lowest frame rate achieved and the average of
all 500 measured frame rates. Because of the warning message generated by the Oculus SDK,
obfuscating the view and thus affecting the measurements, the measuring process does not start
together with the application. Instead, it waits 500 frames, allowing for the warning message to
be removed with the press of a button.
Because of the computational complexity of volume rendering, it is expected that the data set
would have to be downscaled significantly before a workable frame rate is achieved. Furthermore,
it is expected that the performance when rendering with Oculus Rift is approximately halved
compared to rendering without an Oculus Rift, because the scene effectively needs to be rendered
twice for the stereoscopic 3D effect. The effect of downscaling is expected to approximate a linear
trend.
4.3.2 Uniform data set
To confirm the results gathered in the previous experiment and to rule out the possibility that
the results were dependant of the used data set, a second experiment was run. The data set used
in this experiment is a cuboid with the same dimensions as described in table 4.2. This data set
is uniformly filled with the value 10 and the opacity is set to 1 percent. These values have been
chosen because they approximate the performance of the coral data set when the scale factor
18is set to 1. For each scale, the experiment is run three times, measuring the minimal, maximal
and average frame rate achieved. The setup of the experiment is the same as in the previous
experiment.
1920
CHAPTER 5
Results
In this chapter the results of the previously mentioned experiments are discussed. First the
ease of use is evaluated using the comments from the researchers from SurfSARA, then the
performance measurements are examined and discussed.
5.1 Ease of use
The ease of use of the application became apparent during the experiments. The researchers were
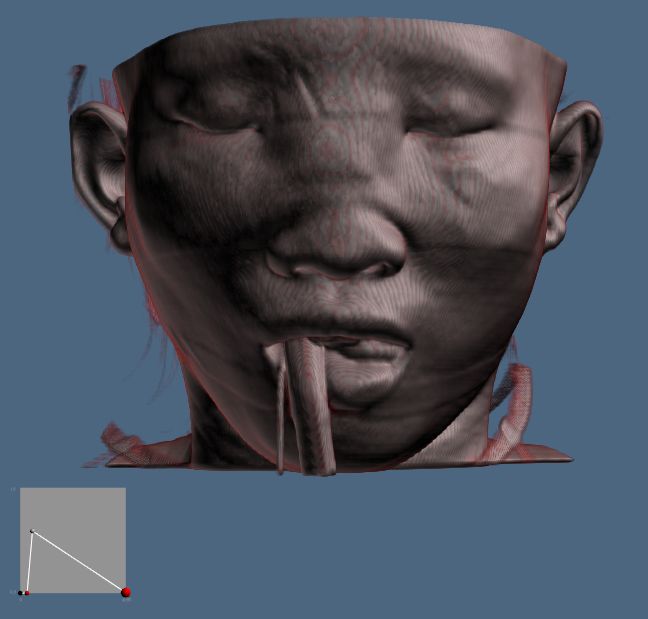
able to quickly highlight interesting parts of the data, as can be seen in figure 5.1. Figure 5.1a
shows the initial data set and figure 5.1b shows the same data set with different transfer functions.
In this second image, the object in the forehead is now visible.
(a) The data with default transfer functions. (b) The data with custom transfer functions.
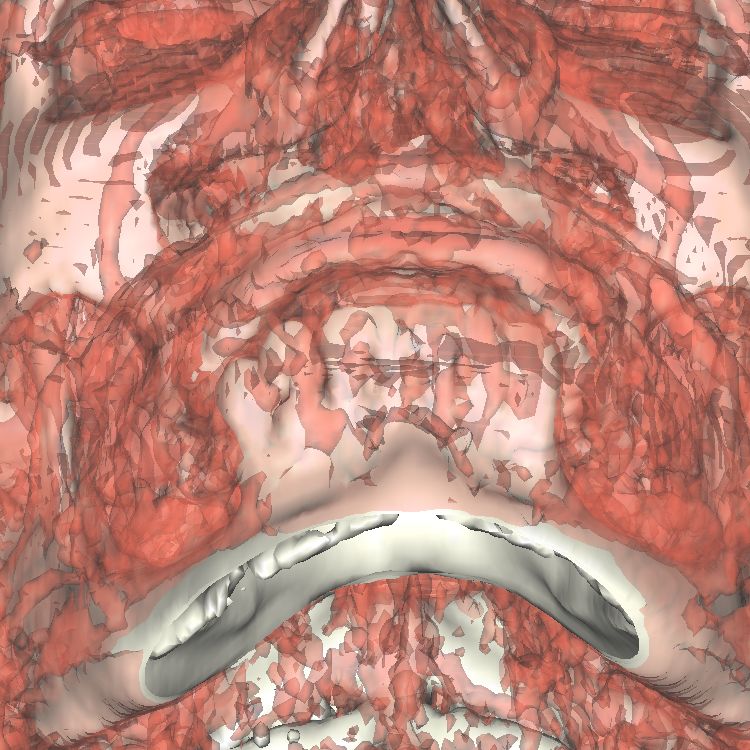
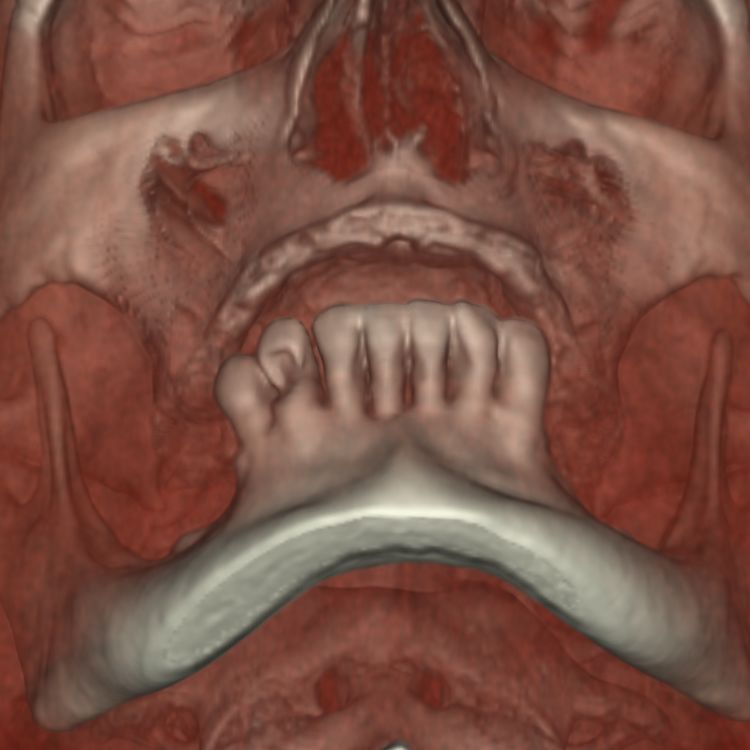
Figure 5.1: This data set contains a CT scan of a head. The red color indicates hard objects,
revealing a hard object in the forehead.
Next to the ability to focus on desired aspects, the ease of the use of the application also led
to discovering new aspects of data sets. An example is shown in figure 5.2, where a previously
unknown flower pattern is now clearly visible.
While using the application, the researchers mentioned that editing the transfer functions was
a lot easier than it was with CAVORE. Furthermore, they mentioned that the editing process
felt intuitive and that the learning time was short, evident from the ease with which the images
above could be produced. The performance of the application was considered good as well.
The orientation in the virtual environment, however, left something to be desired. Rotating
the rendered volume did not feel intuitive, and while the movement of the head was often used
21Figure 5.2: Flower pattern on the scan of a piggy bank.
to further inspect the data, it currently had little effect.
5.2 Performance
In this section the results gathered from the performance experiments are discussed using a graph
to summarize the data. For an overview of the all the data gathered, refer to appendix C.
5.2.1 The coral data set
Figure 5.3 shows the results from the performance tests using the coral data set. As expected, the
green line depicting the performance without Oculus Rift rendering shows a better performance
in general, and the performance decreases as the data set increases in size. What is, however,
unexpected, is that the performance of the experiment including Oculus Rift rendering exceeds
that of the normal rendering at a scale factor of 2 /8 . Furthermore, the line does not completely
approximate a linear equation. When the setup without Oculus Rift reaches a scale factor of
1
/8 , the performance increases more than expected. The same goes for the setup with Oculus
Rift at a scale factor of 2 /8 . In the latter case, the performance shows just a very faint increase
when transitioning to an even lower scale. The transitioning between 1 /8 and 3 /8 , omitting 2 /8 ,
does however look like it approximates a linear trend.
5.2.2 The uniform data set
Figure 5.4 shows the result of the performance tests using the uniform data set. When compared
to figure 5.3, there is little difference except for the decrease in the minimum framerate when
the Oculus Rift is used and the scale factor decreases. Also, for both setups a higher average
framerate is measured when the scale factor increases compared to the coral data set. The average
performance of both setups behave very similar to that of the previous test. Especially notable
is the peak at 2 /8 , where the Oculus Rift renderer again outperforms the normal renderer.
22Figure 5.3: Results of the performance test using the coral data set. For both with and without
Oculus Rift, the upper line indicates the highest frame rate reached, the middle line the average
frame rate and the last one the lowest frame rate. All values are the average of five experiments.
The standard deviation of the average line was too small to graphically display.
Figure 5.4: Results of the performance test using the uniform data set. For both with and
without Oculus Rift, the upper line indicates the highest frame rate reached, the middle line the
average frame rate and the last one the lowest frame rate. All values are the average of three
experiments. The standard deviation of the average line was too small to graphically display.
2324
CHAPTER 6

                                                                          Conclusion

In the introduction the goal of this thesis was described as to extend VTK with an application
to manipulate a volume rendering pipeline in real-time from within a virtual environment. The
accompanying research question was to what extent this application could help researchers in
their analyses. To answer this question, usability tests were performed with the help of the
researchers at SurfSARA who worked on OculusVTK, and performance tests were done using a
large, currently used data set and a similarly shaped uniform data set, in an attempt to find the
limit of a data set’s size before the application will not be able to properly process and render it
with a decent framerate. As mentioned in the Oculus Best Practices Guide, the frame rate which
should be aimed for is 75 frames per second to reduce strain and ensure a pleasant experience
[14]. However, as volume rendering by itself is computationally very heavy, evident from the
results in figures 5.3 and 5.4, the minimum performance for this application is defined as twenty
frames per second, which is when the application was still responsive enough to edit the transfer
functions. The reading used for this is the average performance, as the low minimum rate which
is experienced, especially with the Oculus Rift attached, often lasts no longer than one or two
frames, with the experiment measuring a total of five hundred frames.
    As shown in the first section of the previous chapter, the goal has been reached. This
application is capable of letting users manipulate the transfer functions in real-time, from within
the virtual environment. The requirements listed in the design chapter have also been met. The
application is able to perform volume rendering and to render this image to the Oculus Rift.
Transfer functions can be created and manipulated in an intuitive manner using the gamepad.
The user is also able to physically move through the virtual environment, only limited by the
cables and camera of the Oculus Rift. Currently, however, these movements have very little effect
due to the scale of the data sets.
    This application is also capable of aiding researchers in their analyses. The data sets used
during the development and experiments have all been obtained from researchers, and appendix
A shows examples of how this application can aid researchers highlight interesting parts of a data
set. The extent to which this application can help in these analyses, however, is still limited. As
volume rendering is a computationally heavy task, the real-time performance leaves much to be
desired. This can be seen in figures 5.3 and 5.4. As the size of the data set increases, the frame
rate rapidly decreases, limiting the size of the used data set to an approximate maximum 1000
by 1000 by 464 data points, or 764,000,000 data points in total. In reality, this limit lies even
lower because of the opacity transfer functions. Some of the rays that are cast terminate early
because the result is already fully opaque, meaning a large number of data points is not used
during calculations.
    At this limit the renderer without Oculus Rift performs slightly better than twenty frames
per second. If the technical requirements in the Oculus Best Practices Guide are to be followed,
this application would be deemed unusable on the Oculus Rift. Comments from the researchers,
however, suggest that the current performance on relatively small data sets such as used in
figure 5.1 is sufficient.
    From this it can be concluded that this application is capable of aiding researchers in their

                                                25
analyses. Due to computational limits of computers, however, this application requires larger
data sets to be resized in order to remain responsive. Smaller data sets such as shown in figure 5.1
pose no problem.
6.1 Future work
While this application serves for a good proof of concept, it still has many areas where it could
be improved. The most notable ones will be listed in this section. These improvement points
focus on making the application more intuitive and thus easier to use, as well as improving its
extendability for future researchers wanting to improve or customize the application.
6.1.1 Different methods of user input
Whilst the use of the gamepad proved intuitive, it was not without its issues. Most notably
was the rotation, which felt counter intuitive because the analog joystick only supports two
degrees of freedom. And, although the creation of the transfer functions worked well, researchers
voiced their desire for a system where they could draw the transfer functions using their hands,
thus requiring gesture recognition accurate enough to recognize the drawn graphs. For this,
input devices such as the Razer Hydra or the new motion controls for the Oculus Rift consumer
edition, called Oculus Touch, can be used. The Oculus Touch enables the tracking of hands
and the use of motions, it comes with a few classic control options such as buttons, triggers and
analog sticks, as well as providing haptic feedback through vibrations [16].
6.1.2 Performance increase with the Oculus Rift
The results shown in figures 5.3 come as unexpected, as theory would suggest that using the
Oculus Rift would approximately halve the performance. However, these results show a sudden
increase in performance when the scale factor is 2 /8 , where the Oculus Rift renderer even out-
performs the normal renderer. For this reason a second performance test using uniform data
was carried out. In both experiments at the same exact scale factor of 2 /8 , however, a peak
performance was measured when the Oculus Rift was attached. It was first thought that this
was an issue with the then existing bug in clipping planes, where a part of the data that was
not immediately obvious would be cut off, reducing the time it takes to render a frame. Another
hypothesis was that this specific data set simply performed better under those certain circum-
stances. To test whether these suspicions were accurate, the clipping bug was traced and fixed
and the results in figure 5.4 were gathered. These results proved both hypotheses to be false, the
performance when using an uniform data set with those specific dimensions and with the Oculus
Rift attached followed the same trend, outperforming the normal renderer.
Because this went beyond the scope of the thesis, this has not yet been further researched.
It is possible that this is caused by a bug in OculusVTK or VTK, meaning it is possible to
gain more performance than it currently outputs. It is also possible that this is caused by a
number of factors which somehow make it easier for the GPU to render the image as displayed
on the Oculus Rift. In any case, this performance peak may be an interesting subject for further
research.
6.1.3 Using VTK event system
As can be seen in figure 3.2, the vtkVolumeInteractor class currently requires a two-way link to the
vtkInteractorStyleGame class in order to function. This limits the extendability of OculusVTK
to only members of the vtkVolumeInteractor class. An alternative to this system would be to
use the event system provided with VTK. This event system allows callbacks to be configured
so they are called when a certain event coming from a certain class instantiation is triggered.
In this case, the vtkInteractorStyleGame class could trigger an event when it has gathered the
information from the various inputs, and the vtkVolumeInteractor class could configure the event
handler to respond to that event. This would mean that the ‘handler’ link in figure 3.2 can be
removed and that the system is not limited to just members of the vtkVolumeInteractor class.
266.1.4 Additional features
The researchers who tested this application showed their desire for additional features which
could not be implemented within the time frame. The first feature is to port the application
to Windows, or potentially even make it cross-platform. Currently OculusVTK makes use of
Linux-specific functions and libraries for handling a gamepad and performing various render
calls, limiting it to just Linux. The second feature is to improve the head tracking of the Oculus
Rift. Currently the head tracking is done using OculusVTK, but the displacement does not
match the scale of the data sets. This causes the feeling as if there is no movement at all.
The third feature requested is to improve the controls for rotating the data. Currently they feel
counter-intuitive because the application uses the object’s axes to rotate it, and these axes rotate
along with the object. Thus, after a few rotations the controls can feel very counter-intuitive.
The fourth feature is to be able to save and load transfer functions. This could be extended
upon by being able to load templates for transfer functions, as is done in ParaView
2728
Bibliography

 [1] Eric Barnes. Giant virtual reality chamber boosts 3D echo accuracy.           http://www.
     auntminnie.com/index.aspx?sec=ser&sub=def&pag=dis&ItemID=76986.
 [2] R.G. Belleman. Interactive exploration in virtual environments. PhD thesis, University of
     Amsterdam.
 [3] Carolina Cruz-Neira, Daniel J Sandin, and Thomas A DeFanti. Surround-screen projection-
     based virtual reality: the design and implementation of the cave. In Proceedings of the 20th
     annual conference on Computer graphics and interactive techniques, pages 135–142. ACM,
     1993.

 [4] Robert A Drebin, Loren Carpenter, and Pat Hanrahan. Volume rendering. In ACM Siggraph
     Computer Graphics, volume 22, pages 65–74. ACM, 1988.
 [5] Charles D Hansen and Chris R Johnson. Visualization handbook. Academic Press, 2011.
 [6] Kitware Inc. ParaView. http://www.paraview.org/overview/.

 [7] Kitware Inc. The Visualization Toolkit. http://www.vtk.org/.
 [8] Kitware Inc. Using the Color Map Editor in ParaView - The Basics. http://www.kitware.
     com/blog/home/post/573, November 2013.
 [9] Johnanth. Button layout of a wireless Xbox 360 controller. https://en.wikipedia.org/
     wiki/Xbox_360_Controller.
[10] Daniel A Keim. Information visualization and visual data mining. Visualization and Com-
     puter Graphics, IEEE Transactions on, 8(1):1–8, 2002.
[11] Marc Levoy. Display of surfaces from volume data. Computer Graphics and Applications,
     IEEE, 8(3):29–37, 1988.
[12] Ryan A. Rossi. Scientific Visualization. http://www.ryanrossi.com/sv3.php.
[13] TechPowerUp. MSI GTX TITAN BLACK. http://www.techpowerup.com/gpudb/b2760/
     msi-gtx-titan-black.html.

[14] Oculus VR. Oculus Best Practices Guide. http://static.oculus.com/sdk-downloads/
     documents/Oculus_Best_Practices_Guide.pdf.
[15] Oculus VR. Oculus Rift Development Kit 2. https://www.oculus.com/ja/dk2/.
[16] Oculus VR. The Oculus Rift, Oculus Touch, and VR Games at E3. https://www.oculus.
     com/en-us/blog/the-oculus-rift-oculus-touch-and-vr-games-at-e3/.

                                               29
30
APPENDIX A
Examples of volume rendered data using
OculusVTK
Figure A.1: This data set contains the same scan as figure 5.1. The two figures show different
results using different transfer functions. On the left image, the scar between the eyes show
where the hard object visible in figure 5.1b entered.
Figure A.2: This data set displays the scan of a fish. Because of the transfer functions used, the
organs and skeleton of the fish are clearly visible.
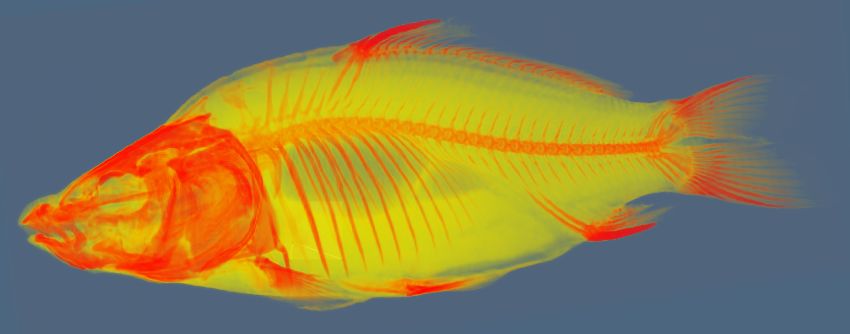
31Figure A.3: This data set displays the scan of a fish. A different transfer function makes the
skeleton and body of the fish clearly visible.
Figure A.4: This data set displays the scan of a piggy bank. Because of the transfer functions
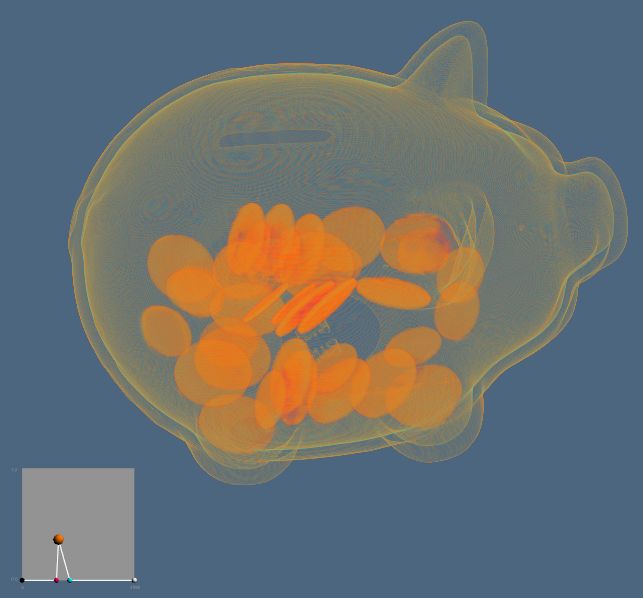
used, the coins inside are visible.
32Figure A.5: This data set displays the scan of a mummy. Because of the transfer functions used,
the skeleton is clearly visible. Notable are the missing front teeth.
Figure A.6: This data set displays the scan of a frog.
3334
APPENDIX B

                                                Application user guide

In this chapter a description will be provided on how to build and use the application on Ubuntu
14.10. The build guide for OculusVTK was originally written by SurfSARA, and was adapted
to work for this application.

B.1 Build and install VTK
For this application VTK version 6.2.0 is required due to the rewrite of the rendering back-end,
named OpenGL2. A version of the source of VTK 6.2.0 is provided in the folder extern/. Extract
the archive and run cmake. In the cmake configuration, change VTK RENDERING BACKEND
from OpenGL to OpenGL2. Under Module, enable Module vtkIOXdmf2 and Module vtkxdmf2.
Compile and install VTK using sudo make install.

B.2 Build and install the Oculus SDK
The Oculus SDK version required by OculusVTK is 0.4.4, which is provided in the folder extern/.
Extract the archive and follow the instructions in the README to build the Oculus SDK. After
this, export OCULUS SDK ROOT DIR to the build folder.

B.3 Building and using OculusVTK including interactive volume ren-
    dering
Run cmake and build the source code using make. After building, run the application using
./src/oculus vtk/oculus viewer -d [head/frog/pig/fish/mummy/coral]. For use of an Xbox 360
gamepad, it is recommended to use the xboxdrv driver, using the default settings. (sudo xboxdrv
--silent). If other gamepads or drivers are used, then make sure the axes and buttons are set
according to the following scheme:

Axes:
Axis 0:   Left joystick, X. (-32767; 32767; default 0)
Axis 1:   Left joystick, Y. (-32767; 32767; default 0)
Axis 2:   Right joystick, X. (-32767; 32767; default 0)
Axis 3:   Right joystick, Y. (-32767; 32767; default 0)
Axis 4:   Right trigger. (-32767; 32767; default -32767)
Axis 5:   Left trigger. (-32767; 32767; default -32767)
Axis 6:   D-pad, X. (-32767; 32767; default 0)
Axis 7:   D-pad, Y. (-32767; 32767; default 0)

                                                 35
Buttons:
0: A
1: B
2: X
3: Y
4: Left shoulder button
5: Right shoulder button
6: Back
7: Start
8: Home
9: Left joystick button
10: Right joystick button
36APPENDIX C
Results of performance experiments
7 6 5 4 3 2 1
Scale factor 1 /8 /8 /8 /8 /8 /8 /8
Average frame rate 8.39 11.05 12.87 19.64 23.97 29.67 35.86 53.48
Run 1 Minimum frame
7.85 10.43 10.78 19.12 17.26 29.36 35.20 29.54
rate
Maximum frame
8.58 11.77 13.41 20.00 24.42 29.92 36.20 54.43
rate
Average frame rate 8.35 10.86 12.83 19.63 23.95 29.77 35.68 53.95
Run 2 Minimum frame
7.34 10.44 12.26 19.25 22.81 29.50 22.41 52.75
rate
Maximum frame
8.59 11.80 13.43 19.94 24.41 30.01 36.17 54.63
rate
Average frame rate 8.31 10.83 12.82 19.60 24.06 29.59 35.91 53.93
Run 3 Minimum frame
7.34 10.40 12.10 18.72 23.55 19.78 35.43 53.14
rate
Maximum frame
8.54 11.73 13.43 19.99 24.43 30.02 36.24 54.56
rate
Average frame rate 8.32 10.76 12.82 19.63 23.96 29.75 35.82 53.26
Run 4 Minimum frame
7.33 10.29 12.24 19.25 22.76 29.25 34.97 28.50
rate
Maximum frame
8.58 11.75 13.47 19.92 24.39 30.03 36.13 54.55
rate
Average frame rate 8.29 10.80 12.81 19.61 24.05 29.77 35.67 53.88
Run 5 Minimum frame
7.37 10.08 10.18 19.16 23.61 29.36 22.66 53.13
rate
Maximum frame
8.55 11.74 13.38 19.94 24.45 30.17 36.26 54.68
rate
Table C.1: Performance of OculusVTK on the coral data set. Tests are run without Oculus Rift.
377 6 5 4 3 2 1
Scale factor 1 /8 /8 /8 /8 /8 /8 /8
Average frame rate 5.29 7.16 8.23 13.71 17.55 25.22 41.39 42.57
Run 1 Minimum frame
5.27 6.40 7.19 13.68 17.72 17.19 17.95 25.33
rate
Maximum frame
5.78 7.20 9.42 13.74 17.84 25.49 45.39 47.31
rate
Average frame rate 5.28 7.16 8.13 13.69 17.77 25.25 41.53 43.58
Run 2 Minimum frame
4.86 7.16 7.18 11.20 17.73 25.15 17.90 40.28
rate
Maximum frame
5.78 7.16 9.41 13.78 17.85 25.37 44.80 47.53
rate
Average frame rate 5.28 7.16 8.13 13.69 17.77 25.24 41.45 43.59
Run 3 Minimum frame
4.86 7.15 8.13 11.16 17.71 25.16 17.93 40.94
rate
Maximum frame
5.78 7.18 8.14 13.77 17.83 25.36 44.31 46.53
rate
Average frame rate 5.26 7.16 8.13 13.70 17.74 25.23 40.81 43.15
Run 4 Minimum frame
4.86 7.16 7.18 11.22 13.79 25.17 17.90 25.38
rate
Maximum frame
5.78 7.18 8.15 13.76 17.86 25.32 45.11 48.46
rate
Average frame rate 5.28 7.16 8.29 13.67 17.74 25.15 40.95 43.70
Run 5 Minimum frame
5.27 6.42 7.19 11.16 13.79 17.87 17.94 39.99
rate
Maximum frame
5.78 7.18 9.42 13.78 17.83 25.49 45.01 49.59
rate
Table C.2: Performance of OculusVTK on the coral data set. Tests are run with Oculus Rift.
387 6 5 4 3 2 1
Scale factor 1 /8 /8 /8 /8 /8 /8 /8
Average frame rate 14.24 17.19 18.46 21.57 25.02 29.74 36.42 54.22
Run 1 Minimum frame
11.39 13.31 18.15 21.16 17.44 29.39 34.76 52.94
rate
Maximum frame
14.48 17.50 18.80 22.07 25.46 30.05 36.95 55.03
rate
Average frame rate 14.30 17.24 16.97 21.48 25.22 29.56 36.52 54.24
Run 2 Minimum frame
14.04 17.00 16.66 21.12 24.57 19.50 34.92 53.04
rate
Maximum frame
14.55 17.49 17.23 21.98 25.48 30.01 37.09 54.94
rate
Average frame rate 14.21 17.07 16.42 21.47 25.20 29.73 36.53 53.78
Run 3 Minimum frame
11.44 12.82 14.25 15.90 24.70 29.32 32.26 51.53
rate
Maximum frame
14.51 17.39 18.66 21.78 25.52 30.03 37.08 54.74
rate
Table C.3: Performance of OculusVTK on the uniform data set. Tests are run without Oculus
Rift.
7 6 5 4 3 2 1
Scale factor 1 /8 /8 /8 /8 /8 /8 /8
Average frame rate 8.14 9.43 11.18 14.04 17.81 25.33 43.38 43.68
Run 1 Minimum frame
7.22 9.39 9.45 11.24 13.90 17.96 25.27 25.54
rate
Maximum frame
8.25 9.46 11.35 17.87 28.26 26.53 45.28 49.52
rate
Average frame rate 8.15 9.42 11.19 14.05 17.82 25.22 42.39 43.5
Run 2 Minimum frame
8.10 8.20 10.06 13.54 17.79 17.97 25.25 25.52
rate
Maximum frame
8.19 9.56 11.55 17.88 17.91 26.58 44.88 47.00
rate
Average frame rate 8.15 9.43 11.18 14.34 17.80 25.32 42.29 43.95
Run 3 Minimum frame
8.02 9.30 11.14 13.67 13.77 18.00 18.13 25.14
rate
Maximum frame
8.28 9.55 11.22 17.85 18.43 26.13 44.44 48.05
rate
Table C.4: My caption
3940
APPENDIX D

                                                  API documentation

This chapter contains the documentation for the vtkVolumeInteractor class. This documentation
was generated by doxygen, exported to PDF and imported into this thesis. Only the section
about the vtkVolumeInteractor is included.

                                             41
30 Class Documentation
6.15 vtkVolumeInteractor Class Reference
#include
Collaboration diagram for vtkVolumeInteractor:
vtkInteractorStyle
vtkInteractorStyleGame
::movement_t
movement
vtkInteractorStyleGame
::trigger_t
triggers
gp_event gamepadEv
gamepadState GamepadHandler
gamepad
gp_state
vtkInteractorStyleGame buttonPressed
vtkInteractorStyleGame
::buttons_t keyboardSpeed
gamepadSpeed
vtkInteractorStyleGame
gamepaddt
::motionfactor_t
mousedt
previous
next
vtkInteractorStyleGame handler
::deltaMovement_t
vtkVolumeInteractor root
::point selected
vtkVolumeInteractor source
previouslyPressed
vtkVolumeInteractor
::history
Classes
• struct history
• struct point
Public Member Functions
• void SetEventSource (vtkInteractorStyleGame ∗src, vtkRenderer ∗ren)
• void HandleEvents (float dt)
• void SetOpacityTransferFunction (vtkPiecewiseFunction ∗opac)
• void SetColorTransferFunction (vtkColorTransferFunction ∗color)
• void SetVolumeActor (vtkVolume ∗actor)
• void SetBounds (double lower, double upper)
• void SetDeadzone (double deadzone)
Static Public Member Functions
• static vtkVolumeInteractor ∗ New ()
Protected Member Functions
• vtkVolumeInteractor ()
Generated on Wed Jun 17 2015 00:54:06 for Interactive volume rendering in OculusVTK by Doxygen6.15 vtkVolumeInteractor Class Reference 31
Private Member Functions
• void CreateSphere (point ∗node)
• void SetSelectedSphere (point ∗node)
• void UpdateLine ()
• void UpdateOpacity ()
• void UpdateColor ()
Private Attributes
• struct vtkVolumeInteractor::history previouslyPressed
• vtkRenderer ∗ CurrentRenderer
• vtkInteractorStyleGame ∗ source
• double minPlane
• double maxPlane
• double planeWidth
• double lowerRange
• double upperRange
• double deadzone
• double maxLJoystickSpeed
• double maxRJoystickSpeed
• double maxTriggerSpeed
• bool switchRotation
• point ∗ root
• point ∗ selected
• vtkSmartPointer< vtkPoints > lineAnchors
• vtkSmartPointer< vtkLineSource > lineSource
• vtkSmartPointer< vtkActor > lineActor
• vtkPiecewiseFunction ∗ opacity
• vtkColorTransferFunction ∗ color
• vtkVolume ∗ actor
6.15.1 Constructor & Destructor Documentation
6.15.1.1 vtkVolumeInteractor::vtkVolumeInteractor ( ) [protected]
6.15.2 Member Function Documentation
6.15.2.1 void vtkVolumeInteractor::CreateSphere ( point ∗ node ) [private]
This function creates a sphere object for a new node. This function is for internal use.
6.15.2.2 void vtkVolumeInteractor::HandleEvents ( float dt )
This function is called by the source every time step, and handles all events that happened during that timestep.
6.15.2.3 static vtkVolumeInteractor∗ vtkVolumeInteractor::New ( ) [static]
6.15.2.4 void vtkVolumeInteractor::SetBounds ( double lower, double upper )
This function is used to obtain the lowest and highest value that occurs in the dataset.
Generated on Wed Jun 17 2015 00:54:06 for Interactive volume rendering in OculusVTK by Doxygen32 Class Documentation
6.15.2.5 void vtkVolumeInteractor::SetColorTransferFunction ( vtkColorTransferFunction ∗ color )
This function is used to obtain the color transfer function defined in the volume rendering pipeline.
6.15.2.6 void vtkVolumeInteractor::SetDeadzone ( double deadzone )
This function is used to set the deadzone of the gamepad’s joysticks. The default value is 0.15. (15%)
6.15.2.7 void vtkVolumeInteractor::SetEventSource ( vtkInteractorStyleGame ∗ src, vtkRenderer ∗ ren )
Set the source of events. The source calls the HandleEvents function and provides the necessary gamepad data,
as well as the current renderer. This function is to be called by the source and will soon become obsolete.
6.15.2.8 void vtkVolumeInteractor::SetOpacityTransferFunction ( vtkPiecewiseFunction ∗ opac )
This function is used to obtain the opacity transfer function defined in the volume rendering pipeline.
6.15.2.9 void vtkVolumeInteractor::SetSelectedSphere ( point ∗ node ) [private]
This function sets a node as selected so it can be moved and altered. A selected node has an increased size to
differentiate it from the other nodes. This function is for internal use.
6.15.2.10 void vtkVolumeInteractor::SetVolumeActor ( vtkVolume ∗ actor )
This function is used to obtain the volume actor defined in the volume rendering pipeline.
6.15.2.11 void vtkVolumeInteractor::UpdateColor ( ) [private]
This function updates the color transfer function of the volume renderer using the values of the nodes. This function
is for internal use.
6.15.2.12 void vtkVolumeInteractor::UpdateLine ( ) [private]
This function updates the line between the nodes. This function is for internal use.
6.15.2.13 void vtkVolumeInteractor::UpdateOpacity ( ) [private]
This function updates the opacity transfer function of the volume renderer using the values of the nodes. This
function is for internal use.
6.15.3 Member Data Documentation
6.15.3.1 vtkVolume∗ vtkVolumeInteractor::actor [private]
6.15.3.2 vtkColorTransferFunction∗ vtkVolumeInteractor::color [private]
6.15.3.3 vtkRenderer∗ vtkVolumeInteractor::CurrentRenderer [private]
6.15.3.4 double vtkVolumeInteractor::deadzone [private]
Generated on Wed Jun 17 2015 00:54:06 for Interactive volume rendering in OculusVTK by DoxygenYou can also read