An analysis of the functionality of selected websites presenting data on air traffic
←
→
Page content transcription
If your browser does not render page correctly, please read the page content below
Polish Cartographical Review
Vol. 52, 2020, no. 4, pp. 162–175
DOI: 10.2478/pcr-2020-0014
Received: 20.01.2021
KATARZYNA KRAWCZYŃSKA, IZABELA KARSZNIA Accepted: 28.02.2021
University of Warsaw
Faculty of Geography and Regional Studies
km.krawczynsk2@student.uw.edu.pl
https://orcid.org/0000-0001-5510-8770; i.karsznia@uw.edu.pl
An analysis of the functionality of selected websites presenting data
on air traffic
Abstract. The subject of the article is the assessment and comparison of the functionality of websites
presenting flight data and the current location of aircraft on the map. The following websites were assessed:
Flightradar24 (flightradar24.com), RadarBox24 (radarbox24.com), Flightaware (flightaware.com) and Plane-
finder (planefinder.com). The credibility of the presented data and the range of functions available on the
websites were analyzed in detail. A number of functions included in data sets were compared to the examined
websites. Additionally, the possibilities of expanding the analyzed websites and extending the scope of their
functions were determined. The issue of using data from air traffic data websites for scientific research was
also examined.
Keywords: functionality, websites, air traffic, flights, Warsaw Chopin Airport
1. Introduction as well as their compatibility, also between the
four websites.
The result of the development of air traffic
and maps appearing on the Internet are websi- 2. The functionality of online maps
tes presenting the location of planes on maps.
They are primarily used by ordinary users who Today, there is an increasing tendency to make
want to view the current position of a plane flown maps available online and thus increasingly
by a family member or a friend, or check a plane used in everyday life. Today, everyone uses
which they currently see in the sky. They can maps on the Internet, as they visualize a wide
also look up the volume of air traffic at a selected variety of content.
location on Earth. Apart from amateur users, The definitions of the terms defining various
such websites are also used by aviation pro- types of maps on the Internet are not precise.
fessionals such as airport operators and pilots. What is more, there are many different classi-
In addition to the current location of the aircraft, fications (M. Kukułka 2011). Despite the diffe-
such websites also provide flight data from rences in defining them, it is easy to notice some
previous days along with their routes. Also, the common elements. Depending on the author,
websites provide a range of functions facilitating the division is more or less detailed. M. Kukułka
browsing by the user and obtaining additional (2011) distinguishes between online maps, data
information. Some functions and data are also sets, and geoportals. A more detailed division
available after purchasing the paid version. includes: electronic versions of paper maps, elec-
This article analyses the functionality of four tronic maps, electronic atlases, Internet mapping
websites: flightradar24.com, radarbox24.com, services and mobile solutions (T. Nowacki,
flightaware.com and planefinder.com. The aim T. Opach 2010). In both of these classifications,
of the research was to determine the functio- the important differentiating factors are interac-
nality of the examined websites and their cred tivity, the number of functions and their advance-
ibility. Their functions and data were analyzed, ment, as well as the scope and variety of data.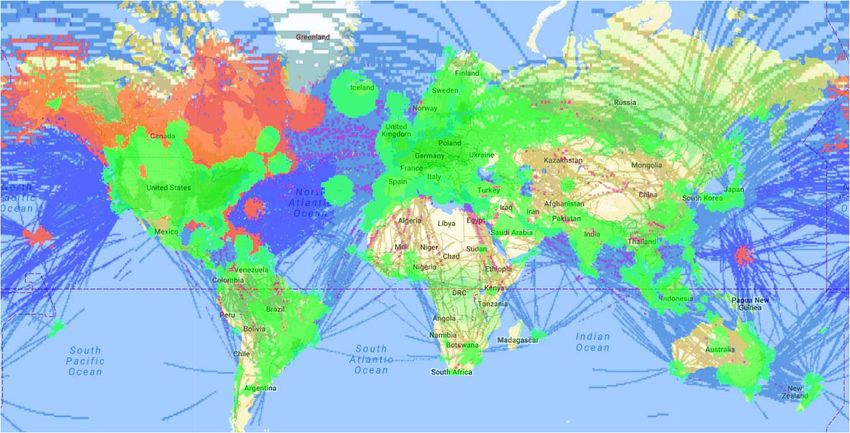
An analysis of the functionality of selected websites presenting data on air traffic 163 Currently, the functionality of websites is one – identification functions, of the important elements indicating their quality – orientation functions, (A. Fernandez et al. 2011). This means that pro- – cartometric functions, blems related to functionality may significantly – analytical functions, hinder the recipient from fully taking advantage – external communication functions. of the options offered on the websites. It should The second way to classify interactive func- also be noted that the topic of website function- tions is to divide them into: ality has been insufficiently explored in relation – general functions, to the aspects of cartographic visualization – navigation functions, (A.M. Nivala et al. 2008). – didactic functions, The concept of functionality can be defined – cartographic and visualization functions, in two ways. On the one hand, it can be defined – GIS functions (A. Macioch, G. Malmon 2010). as a science aimed at developing websites in An important element of examining the func- such a way that their use is not complicated for tionality of data sets is the user and the adapta- the user (P.J. Kowalski 2006 after M. Pearrow tion of the application interface to his competences, 2002). Within this definition, P.J. Kowalski (2006) because the user does not need to have carto- distinguished three features of functionality. graphic knowledge of cartographic information They are: systems. When the website is thus tailored to – usability, the needs of users, it can be defined as “user- – accessibility, -friendly” (M.H. Tsou, J.M. Curran 2008). “User – practicality. studies” or “user-centered design” focus on At the same time, functionality can be defined making the use of websites as easy as possible as all the functions of a given application. Usa- for the user. In order to obtain knowledge that will bility then becomes a concept with a broader be useful in the development and expansion of meaning, and functionality (as a whole of func- data sets, tests are carried out among users tions) is its essential element (P.J. Kowalski (R. Roth et al. 2015, R. Roth et al. 2017). 2012). This article focuses primarily on the functionality of websites in the context of the 3. Visualizing the dynamics of phenomena included functions. The use of data sets is closely related to the The dynamics of phenomena are presented use of their interactive functions, i.e. those that on a map showing an element changing over enable interaction with the map user. Therefore, time, assuming either interaction with the user functionality and interactivity are interdependent or its absence, while the user entering into such (A. Macioch, G. Malmon 2010). The very concept interaction does not take control and does not of interactivity is not easy to define because it determine the visualization of dynamics (T.A. Slo- is not fully clear, which can be seen in the works cum et al. 2001). One of the elements distin- of many authors. In the context of visualiza- guishing a map presenting the dynamics of tion, it can be translated as “a system that phenomena from other maps is the appearance changes its visual data display in response to of an additional variable – time (D. DiBiase et al. user input” (J.W. Crampton 2002, p. 88). The 1992). interactivity associated with the use of data The dynamics of phenomena can be divided sets creates a relationship between the user into three categories: motion dynamics, state and the map, which is expressed in mutual inter- dynamics, and complex dynamics. Motion dy- action (A. Macioch, G. Malmon 2010). namics means the movement of a given object The functionality of websites with online maps over time. State dynamics is a situation of can be equated with the sum of interactive changing certain characteristics of an object – functions, which are, in a way, a combination qualitative or quantitative. On the other hand, of interactivity and functionality (A. Macioch, complex dynamics are when both factors occur G. Malmon 2010). Therefore, these functions simultaneously (M.W. Meksuła 2001). M.W. Mek- should be classified into the most relevant cat suła additionally distinguishes two types of egories. M. Okonek (2010) distinguishes six visualization of the dynamics of phenomena – types of these functions: indirect and direct methods. Indirect methods – navigation functions, are divided into single maps and series of maps.
164                            Katarzyna Krawczyńska, Izabela Karsznia

Multiphase, balance, and type maps are single        and its functions or use attention-grabbing
maps, while comparative, overlay and double-         symbols or sound effects. Another difficulty for
-sided maps are series of maps. Direct methods       the user may be an attempt to provide too much
are animated maps (M.W. Meksuła 2001).               information on a single map. The solution seems
   It is animated maps that seem to be an            to be the use of relatively simple symbols and
important tool for presenting the dynamics of        providing the option to filter the data. The fourth
phenomena today. By showing various types            challenge is the fact that users have less con-
of changes, they help the user to understand         fidence in animations than in static maps. There-
the essence of the presented phenomenon              fore, a short instruction on how to use the map
(M. Harrower 2001). Moreover, they show move-        can be included (M. Harrower 2003).
ment or development directly, and animation             The studied websites use basic animations.
of phenomena refers to dynamics (M. Harrower         The user can view the movement of planes in
2001, J.B. Morrison 2000). The development           real time or recreate the route of a given flight
of such maps is facilitated by the possibilities     that has already taken place, within the time
offered by the Internet, which then also creates     range in which such data is available on a given
conditions for sharing them (M. Harrower 2004).      website. This is due to the fact that the analyzed
   The construction of animated maps may cause       websites focus mainly on the presentation of
some difficulties in reading them. According to      up-to-date flight data, which does not require
M. Harrower (2003), four such problems can be        the use of more advanced animations.
distinguished. In a situation where the user is
not able to note key information on a changing       4. Selected websites presenting data
map, it can be referred to as a “disappearance”      on air traffic
error. In such a situation, it is best to give the
viewer control, e.g. to pause and play the ani-         The analyzed websites present data on air
mation at any pace or repeat it. Another problem     traffic. Their main elements are maps showing
is the matter of attention. The user, looking at     the current location of planes in the airspace.
the map, should have no doubts where he needs        In addition, the websites contain information
to focus his attention, i.e. where a given pheno-    on the route of completed flights, flight duration,
menon occurs, and he should not have difficulties    flight schedules, and much more. The websites
finding important functions. It is therefore ne-     listed below have been selected because they
cessary to ensure a logical layout of the map        present current flights directly on the map. They

                         Fig. 1. A map of the airspace monitored by RadarBox24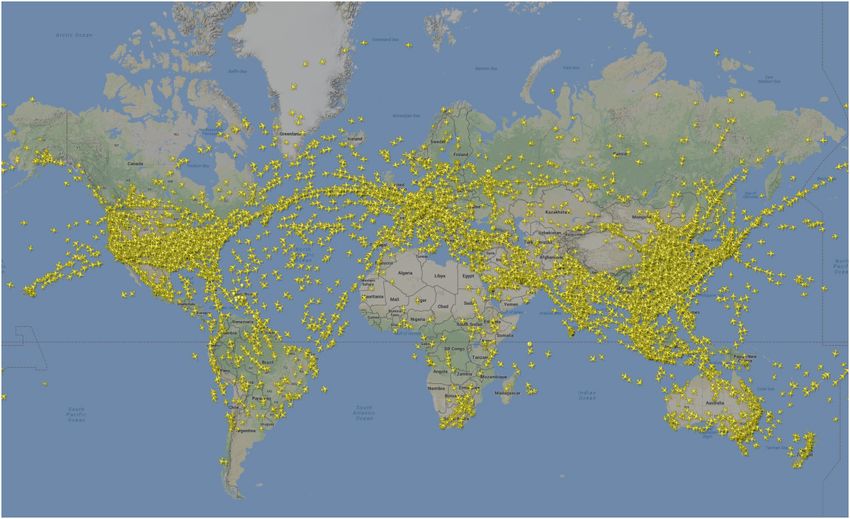
An analysis of the functionality of selected websites presenting data on air traffic                165

                              Fig. 2. A map of the airspace monitored by Flightradar24

are also the most popular websites of this type              4.2. Flightradar24
on the Internet, as reflected by their position in
the Google search engine.                                       Flightradar24.com was established in 2006.
                                                             It is also based on receivers given to private
4.1. Radarbox24                                              individuals – volunteers. In addition to various
                                                             systems, it also uses radar data and satellite
   The company was founded in 2007 and is                    systems. According to the data available on the
based in the United States and Europe. Radar-                website, Flightradar24 has the largest network
                                                             of ADS-B receivers – over 20,000. Thanks to
box24.com, like the other websites, is based
                                                             this, it provides data on over 180,000 flights used
on the ADS-B (Automatic Dependent Surveil-
                                                             by over 2 million users daily. Figure 2 shows
lance-Broadcast) system, which is used to track
                                                             the extent of the airspace monitored by Flight-
aircraft equipped with a transmitter of this system.         radar242.
Additionally, other systems are also used. The
ADS-B system transmits the position of the air-
                                                             4.3. Flightaware
craft and other flight data using radio waves. The
signal is received by a network of receivers on
the ground owned by Radarbox24 volunteers.                      Flightaware is the oldest of the described
For this reason, the range of the area where                 websites, and is also the first site that provided
the planes are “tracked” does not cover the                  access to data on the current position of aircraft
                                                             around the world, since it was created in 20053.
whole Earth (fig. 1). According to the informa-
                                                             Flightaware retrieves data from air traffic control
tion available on the website, an average of
about 40,000 people from over 150 countries
                                                                2
use the website each day1.                                          https://www.flightradar24.com/about (access 13.04.2019)
                                                                3
                                                                  https://www.reuters.com/article/us-airlines-flightradar24/
                                                             flightradar24-finds-not-just-planespotters-flockingto-its-
  1
      https://www.radarbox24.com/about (access 16.03.2019)   website-idUSKBN0O31Q720150518 (access 11.04.2019)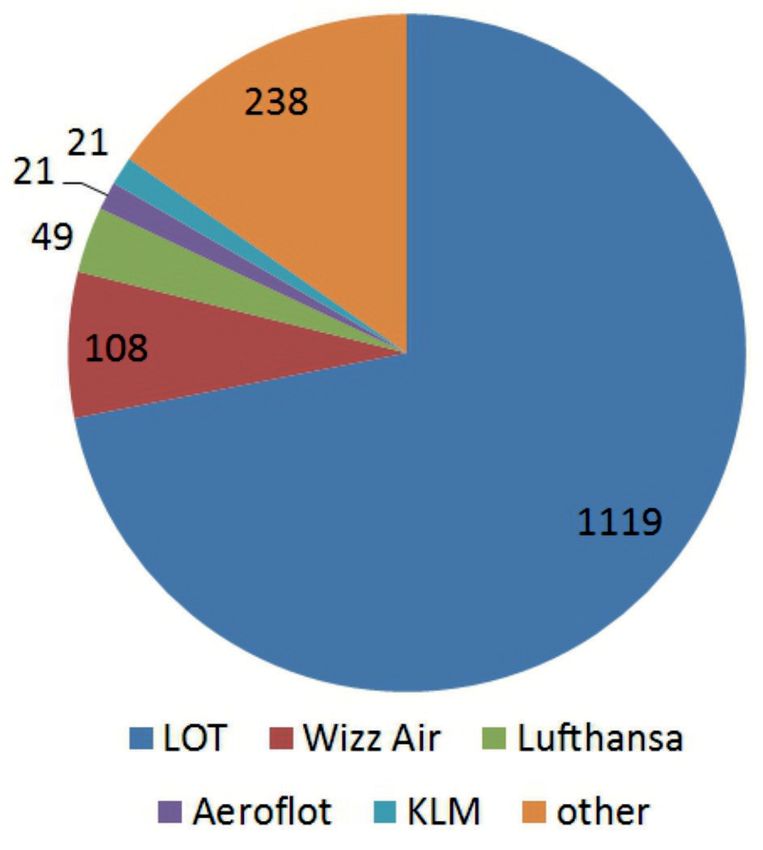
166 Katarzyna Krawczyńska, Izabela Karsznia
Fig. 3. A screenshot of an interactive airspace map monitored by Flightaware
systems in 45 countries, from its own ADS-B The functional analysis covered three basic
ground stations in over 190 countries, and from steps. After reviewing the content of research
a satellite system4. The extent of the area mo- and studies published by various authors, a table
nitored by Flightaware is shown in figure 3. was created to determine the presence of in-
dividual interactive functions in the analyzed
websites. The scheme of the research metho-
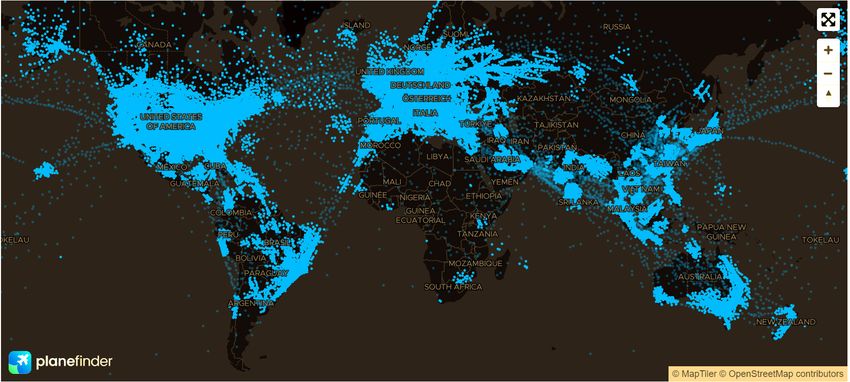
4.4. Planefinder
dology is presented in figure 5.
The table was developed on the basis of the
The website was created in 2009, initially as description of the electronic map functions pro-
an application for iOS5. It is this fact that distin- posed by A. Macioch and G. Malmon (2010).
guishes it from the other sites. They were first First, a list was made that presented all the
created as websites, and then applications were functions listed in their article, excluding a few
developed on their basis. This is why the way that were considered unhelpful in the context
the data is presented is slightly different. It is of the analyzed websites. Ultimately, however,
more useful and clear when used on mobile the table presents only the functions that were
devices. Planefinder also has its own network available in at least one website. In relation to the
of receivers. It is shown in figure 4. proposal by A. Macioch and G. Malmon (2010),
the name of one of the functions “access to
5. Research methodology a table with statistical data” was also changed
to “access to statistical data” to take into account
Four websites presenting data on air traffic also other methods of data presentation. The
were selected for the analysis (flightradar24.com, table uses a score according to which each
radarbox24.com, flightaware.com, and plane- website received 0 or 1 point for each function.
finder.net). The choice of websites was determined 0 means that the function is absent, and 1 means
that the function is present. However, its quality
by the fact that they presented the current lo-
was not assessed. 0.5 points were awarded
cation of planes on the map and their popularity
when a given function is available in the paid
on the Internet.
version of the website. It was also granted in
one case, when the function appeared partially
4
https://flightaware.com/about/ (access 11.04.2019) on a given website, as a query for location (co-
5
https://planefinder.net/about (access 27.04.2019) ordinates and height).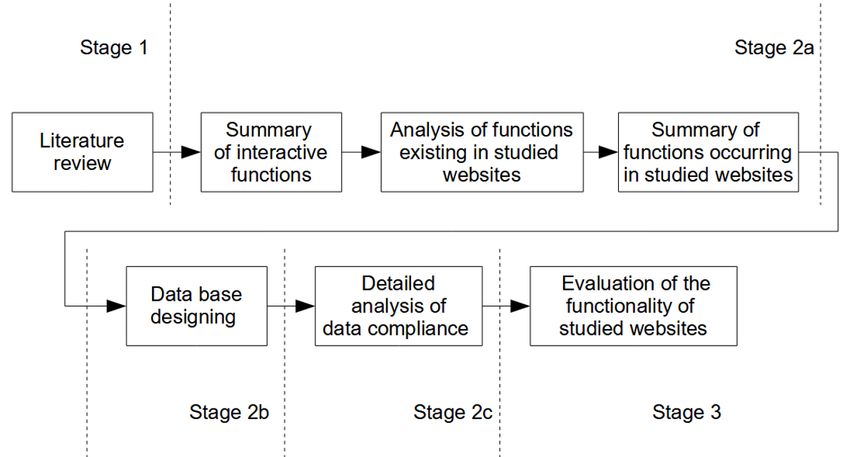
An analysis of the functionality of selected websites presenting data on air traffic     167

                Fig. 4. A screenshot of an interactive airspace map monitored by Planefinder

   The next step was to design a database in              parture time, actual time of arrival, airline, and
which information available on the websites was           distance travelled. The analyzed websites were
collected and organized. The database has been            the sources of this data. The database includes
divided into two parts: a list of flights taking          flights from one point of departure – the Warsaw
place on particular days during the week and              Chopin Airport, located in the Warsaw district
a summary of detailed information on flights              of Okęcie. This choice was determined by the
over two days. The following information about            fact that it is the largest and most important
flights is compiled in the first part: flight date,       airport in Poland. Only departures from Chopin
departure airport, arrival airport, days of the week      Airport were analyzed, arrivals were not taken
of the flight, and flight number. In the second           into account.
part, they also include the following data: flight           The ports of departure and arrival are defined
duration, departure time according to schedule,           by the names of the cities they belong to and the
time of arrival according to schedule, actual de-         IATA (International Air Transport Association)

                             Fig. 5. Research methodology (source: own study)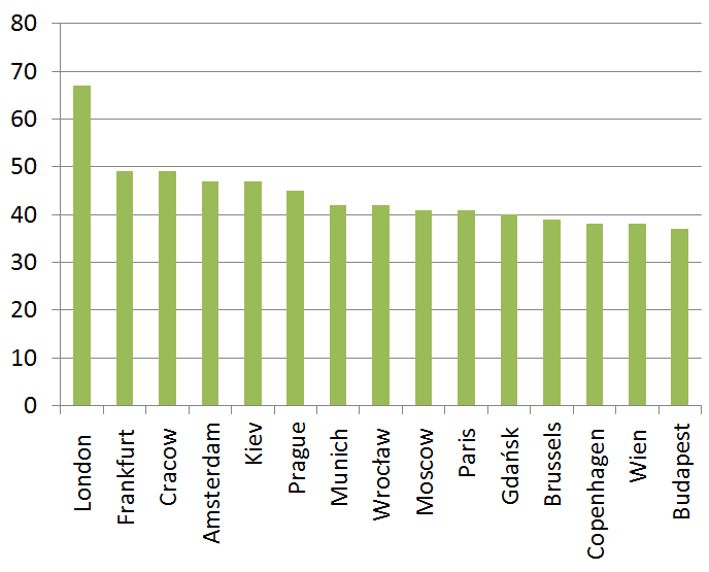
168 Katarzyna Krawczyńska, Izabela Karsznia
codes for each airport. Flightradar24 was selec electronic maps relating to other issues and
ted as the main data source for developing the would limit the scope to the functions that were
database because it presents data in the most included in the analyzed websites, which could
clear and complete way. The development of result in the lack of an important function being
the database on the basis of data obtained overlooked.
mainly from one website ensured its consistency. The presented list is subjective because due
Data on distance travelled available from Flight- to the specificity of websites and their narrow
aware was also used. However, in the absence scope, some functions have a different form
of data on the Flightradar24 website, Flightaware than in typical map websites.
or RadarBox24 were used. The database was According to the summary, Flightradar24 re-
attached to the work by K. Krawczyńska (2019), ceived the highest number of points, which in-
on the basis of which this article was prepared. dicates its highest functionality in accordance
In the final stage, a detailed analysis was with the methodology adopted in this research.
carried out to compare the compliance, com- Flightaware and RadarBox24 obtained similar
pleteness and consistency of the information results, while Planefinder received the lowest
of the four websites. For this purpose, flight number of points.
information was obtained, which is available in It is also important to analyse the partial results
each of the analyzed websites, and its com- in each category, where there were slight differ
pliance with other websites was compared. ences from the final score. In the case of navi-
40 flights were randomly selected, diversified gation functions, the same highest score was
in terms of space and time, taking into account achieved by Flightradar24 and RadarBox24.
the most important airports and areas important On the other hand, the number of didactic, car-
for aviation. Then, the compliance of the most im- tographic and visualization functions was the
portant data between the websites was analyzed. same for all the websites and they were the
Among the 40 selected flights, 10 flights were same functions. In the GIS function category,
analyzed during their duration, and 30 were ana- the analyzed websites had the lowest number
lyzed after they were completed. In the case of of functions (from 2 to 0.5 points).
the former, the current location of flights on the Summing up, Flightradar24 showed the
map was compared at the same time in each greatest functionality. RadarBox24 and Flight-
of the websites and it was determined which of aware had a comparable number of analyzed
them represents the most accurate position of functions with slight deviations in terms of their
the aircraft, and in relation to completed flights, types used in these websites. Planefinder turned
their routes were compared. All the above stages out to be the least functional in this comparison.
allowed for drawing conclusions on the evalu- The analysis showed that the analyzed websites
ation of the functionality of the analyzed websites. do not differ significantly in terms of functionality
and often have similar functions. This is also
6. Results reflected by the total number of 57 functions
included in the analysis and the 18,5-24 points
The result of the analysis of the functions scored by websites.
provided by the studied websites is a summary Another element of analysing the websites
in the form of a table. The dominant types of was the development of the database. It covers
functions were defined (general, navigation, di- one week (March 25–31, 2019). As mentioned
dactic, cartographic and visualization, GIS func- earlier, the detailed analysis was done for two
tions). The results are presented in Table 1. days in the analyzed week. It included Monday,
The websites also include other functions that due to the highest number of flights, and Satur-
have not been analyzed, because the above list day, with the fewest flights. The database was
was prepared on the basis of a set of functions attached to the work by K. Krawczyńska (2019).
included in the article by A. Macioch and G. Mal- After the database was developed, the obtained
mon (2010). It should be noted that another results were analyzed. The number of all flights
way to analyse functionality may be to record from Warsaw Chopin Airport was 1,556. The
all the functions contained in each of the web- number of flights is summarized in a diagram
sites. However, this method would make it im- showing the division by consecutive days of the
possible to compare to some extent with other week (fig. 6.).An analysis of the functionality of selected websites presenting data on air traffic 169
Table 1. Comparison of the functionality of studied websites
Function type Function Flightradar24 Radarbox24 Flightaware Planefinder
General Mode selection 1 0,5 1 1
functions
Data export 0,5 0 0 0
Language selection 0 0 1 0
Bookmarks posting 0,5 0 0 1
Labels 1 1 1 1
Settings 1 1 1 1
Tool tips 1 1 0 0
Help 1 1 1 0
Home page 1 1 1 1
Sum 7 5,5 6 5
Navigation Spatial object selection 1 1 1 1
functions
Zooming in and out
1 1 1 1
of the map
Map moving 1 1 1 1
Map rotation 1 1 0 0
Geographic names index 1 1 1 0
Geographic names
1 1 1 1
searching
Position tracking 1 1 1 1
Time selection 1 1 1 1
Animation 1 1 1 1
Sum 9 9 8 7
Didactic Photos 1 1 1 1
functions
Texts 1 1 1 1
Graphics 1 1 1 1
Sum 3 3 3 3
Carthographic Layer display/conceal 1 1 1 1
and visualization
Graphical form/data
functions 1 1 1 1
visualization modification
Data selection 1 1 1 1
Sum 3 3 3 3
GIS functions Location query (coordinates
1 1 1 0,5
and altitude)
Access to statistical data 1 0 1 0
Sum 2 1 2 0,5
Total 24 21,5 22 18,5
source: own study based on A. Macioch, G. Malmon (2010)170 Katarzyna Krawczyńska, Izabela Karsznia
Fig. 6. The number of flights on particular days of the week from Warsaw Chopin Airport (25–31.03.2019)
(source: own study based on data from flightradar24.com, flightaware.com, and radarbox24.com)
Most flights took place on Monday (238 – Munich and Wrocław (42 flights each), Moscow
15.3% of all flights during the week). Next was and Paris (41 flights each), Gdańsk (40), Brus-
Friday (237 – 15.2%), Wednesday (233 – 15%), sels (39) Copenhagen and Vienna (38 each),
then Sunday (226 – 14.5%), Thursday (225 – and Budapest (37). Based on the graph (fig. 8)
14.5%) and Tuesday (217 – 13.9%). The smal- it is also worth noting that the dominant flight
lest number of flights took place on Saturday destinations are mainly foreign destinations
(180 – 11.6%). (80%), while domestic flights are less impor-
In the next stage, the most important desti- tant (20%).
nations for flights from Chopin Airport were The next element of the analysis was airlines
determined. They are presented in figure 7. that most often fly from Chopin Airport (fig. 9).
The main destinations are London (67 flights). LOT Polish Airlines is of the greatest importance.
Frankfurt and Cracow (49 flights each), as well
as Amsterdam and Kiev (47 flights each) also
turned out to be important destinations from
the Warsaw airport. Among the 15 important
destinations, there were also: Prague (45 flights),
Fig. 8. The main destinations of flights from Warsaw
Fig. 7. The main destinations of flights from Warsaw Chopin Airport (25–31.03.2019) – division
Chopin Airport (25–31.03.2019) into domestic and foreign destinationsAn analysis of the functionality of selected websites presenting data on air traffic 171
This carrier handles over 70% of all departures
from the analyzed airport. Other important air-
lines are WizzAir, i.e. Hungarian low-cost airlines
(almost 7%) and the German national carrier
Lufthansa (over 3%). The top five carriers also
included Russian Aeroflot and Dutch KLM. Each
of these operators handles approximately 1.4%
of flights from the Warsaw airport.
In addition, flight delays were analyzed, which
was achieved thanks to a detailed analysis
that took into account two days of the week –
Monday and Saturday. The delays have been
calculated based on the difference between the
planned and actual departure times. On Mon-
day, the average delay was 26 minutes and on
Saturday it was 19 minutes. On the basis of
this comparison, it was found that there were
longer maximum delays on Monday than on
Fig. 9. The dominant airlines for flights
Saturday. There were delays of more than two
from Warsaw Chopin Airport (25–31.03.2019)
hours on Monday, while on Saturday the maxi-
mum delays were between one and two hours.
On both days, delays ranging from 15 to 30 mi- of a table is attached to the work by K. Kraw-
nutes were the most common. Over 35% of flights czyńska (2019).
were delayed on each of the days. On Satur- The tables include flight numbers according
day, more flights began before the scheduled to IATA and ICAO (International Civil Aviation
departure. Tables 2 and 3 present the delays Organization), place of departure and arrival
recorded on Monday and Saturday. (city names) with IATA codes for the airport,
In addition, 40 flights were compiled for a more departure time according to the schedule and
detailed analysis, including 30 that had already actual departure time and time of arrival ac-
taken place and 10 that were ongoing at the cording to the schedule, as well as the name of
time of the study. The comparison in the form the airline. In addition, the tables for ongoing
flights include: estimated time of arrival, flight
Table 2. Delays on Monday 25.03.2019
Number Percentage Table 3. Delays on Saturday 30.03.2019
Delay of flights share of all
flights [%] Number Percentage
Delay of flights share of all
>2 h 3 1.26 flights [%]
>1-2 h 9 3.78 >1 h 4 2.22
>30 min - 1 h 49 20.59 >30 min - 1 h 22 12.22
>15-30 min 88 36.97 >15-30 min 68 37.78
>10-15 min 50 21.01 >10-15 min 36 20.00
>5-10 min 29 12.18 >5-10 min 27 15.00172 Katarzyna Krawczyńska, Izabela Karsznia duration, remaining flight time, distance travelled the actual arrival and departure times, while the and distance remaining, altitude, latitude and flight duration is generally given for all flights longitude, as well as a comparison of informa- with a given number. Between the other sites, tion on the position of the aircraft presented on the flight duration often differed by up to an hour. the maps on the analyzed websites. The tables Considering the function of presenting the for completed flights include: flight (departure) position of aircraft on the map (in the case of date, actual arrival time, flight duration and a com- 30 analyzed flights), it was noticed that in areas parison of the routes presented on the maps such as Europe and the United States, accurate on the analyzed websites. flight route data is usually complete. The situ- There were differences between the sites, ation is different over the oceans and seas, as such as a five-minute delay in aircraft location well as over Africa and some regions of Asia, data (altitude and latitude) on Flightaware com- where routes are usually marked according to pared to other sites. It was also noticed that predictions. Sometimes complete location data some websites present additional flight data. for flights over Australia and South America are The duration of flights was calculated by each also missing. Over the oceans, in areas close of the websites in a different way, hence there to islands, the flight path is recorded – possibly are differences between them. In addition, on within the range of the receiver. the Planefinder website, it was not possible to It can be generally assumed that the flight find exact data on arrival and departure times, routes presented on the websites usually coin- scheduled times, as well as the exact duration cided to a large extent. It was also noted that of a specific flight. Flightradar24 usually has the most complete After a detailed analysis of ten selected flights data in terms of routes, while Flightaware pre- during their duration, different in terms of time sents just slightly less complete data. Radar- and range, certain regularities were noticed. Box24, on the other hand, often contains very First of all, usually the websites did not differ limited data. It is most difficult to find complete significantly in terms of the geographical loca- routes on Planefinder. While the rest of the tion of the aircraft. There were situations when sites present much more complete route informa- a website presented a location that differed tion, this site does not contain much of the data. significantly from the others, but no regularity was found here. The times of departure and 7. General conclusions arrival usually overlapped either for all websites or were repeated simultaneously on two websites. 7.1. Functionality analysis Often, there were also differences of several minutes between the sites. Taking into account Based on the functionality table and the the duration of the flight and the estimated time small number of points obtained by each of the remaining to complete the flight, it can be seen websites, it can be concluded that the examined that even half an hour differences were noted. websites cover a narrower scope than a typical There were quite significant differences in data set for which a set of functions has been latitude or longitude values that could reach developed. At the same time, some of the unused 1.5 degrees or even a maximum of almost functions, for example the function of importing 2.5 degrees. In some cases, this was the differ- and exporting data, could enhance these sites ence between Flightaware and RadarBox24 / with additional possibilities. To facilitate access Flightradar24. and increase the number of users, it would suf- The time remaining until the end of the flight fice to add a language selection feature, which usually differed between the data on the web- is only available on Flightaware. sites of the selected websites, with the maximum Tool tips, i.e. information about a given func- difference being around 50 minutes. Usually, the tion explaining how to use it, are available only height value did not differ significantly. There on two websites. Introducing them could make were also individual errors, for example in the it much easier to use the maps and under- case of altitude or arrival/departure times. When stand the functions. The map rotation function, analysing 30 completed flights, it was noticed which enables 3D visualization, could be omitted that Planefinder does not provide arrival and because in the websites where it is available, it departure times according to the schedule and is in the authors’ opinion inaccurate and useless,
An analysis of the functionality of selected websites presenting data on air traffic               173

and therefore unnecessary. It makes the web-                  Aviation Authority concern the whole of Poland
site more attractive visually but is not informative.         and only foreign flights, and also include depar-
   A significant difficulty is also the lack of geo-          tures and arrivals, unlike the developed data-
graphical plane coordinates on Planefinder.                   base, which only includes departures. In addition,
Adding it would increase the credibility to the web-          the Civil Aviation Authority data presents the
site, as it displays the position of the aircraft.            number of passengers, while the developed da-
The possibility of adding identification points               tabase shows the number of flights.
could also appear on the described websites.                      In the study on the number of passengers
This would make it easier to adapt the map to                 served at Polish airports by city in international
different studies or observations. On the other               regular traffic in 2017 and 2018, London was
hand, the function of selecting and changing                  mentioned as the most important destination,
the thematic content would certainly simplify                 followed by Frankfurt. This is in line with the data
the visual perception of the map and expand                   compiled from the database. Also in the top
the scope of data presented on the websites.                  fifteen cities to which planes fly from Chopin
   Other cartographic and visualization functions,            Airport there are 8 destinations given in the sta-
such as adding your own objects or changing                   tistics of the Civil Aviation Authority. Thus, 8 out
the cartographic projection, could also increase              of 12 foreign destinations listed in the data com-
the functionality of the websites and allow                   piled on the basis of the database coincided
people involved in various types of research                  with the statistical data of the Civil Aviation
related to the thematic scope of these pages to               Authority. They were: London, Frankfurt, Amster-
use them in various research. GIS functions                   dam, Kiev, Munich, Paris, Brussels and Copen-
are not necessary for such websites, but one                  hagen. This may mean that other airports in
of them – distance and area measurement –                     Poland handle flights to other destinations listed
could be useful.                                              in the Civil Aviation Authority statistics more
                                                              often than Chopin Airport.
7.2. Database analysis                                            When comparing the most important carriers
                                                              operating flights from Chopin Airport, determined
   On the basis of the created database, it can               on the basis of the created database with the
be concluded that the analyzed websites can                   main airlines operating in Poland, it can be seen
be used to analyse traffic at Warsaw Chopin                   that 3 out of 5 airlines from the top five are the
Airport. However, this assessment is largely                  same (LOT, Wizz Air and Lufthansa). Data for
general and in order to be able to conduct com-               the whole of Poland was also prepared by the
prehensive analyses, it would be necessary to                 Civil Aviation Authority and concerns the number
obtain data from a longer period, which would                 of departing passengers by carriers, served at
be difficult due to the short time of data availa-            Polish airports in domestic and international
bility (from about a week to 10 days depending                regular traffic in 2017 and 20187. In these sta-
on the website) and its quantity. For these                   tistics, Ryanair is the most important airline
reasons, and because of errors and gaps in the                in Poland. However, it does not operate from
data, the creation of a large, comprehensive                  Chopin Airport and therefore does not appear
database for one period is significantly difficult.           in the summary in this article. On the other hand,
The research described in this article was in-                LOT Polish Airlines operate here, which handle
tended to show the possibilities of such analyses             over 70% of flights from Chopin Airport.
and their subsequent use. Nevertheless, it was                    The research carried out by M.P. Peterson,
possible to notice certain regularities and draw              P. Hunt and K. Weiß (2017) can be cited here.
conclusions.                                                  They carried out analyses to determine the
   The main destinations of flights from Warsaw,              number of people using air transport traveling
determined using the database, are partially in               over a given area. The authors counted the
line with the statistics provided by the Civil                so-called Air Population on the basis of current
Aviation Authority6. However, the data of the Civil           data on the location of aircraft and data on the

   6                                                             7
     http://www.ulc.gov.pl/_download/regulacja_rynku/staty-        http://www.ulc.gov.pl/_download/regulacja_rynku/staty-
styki/2018/4-kw-2018/wg_metropolii_regularne_kw42018.         styki/2018/4-kw-2018/wg_przew_out_regularne_kw42018.
pdf (access 26.04.2019)                                       pdf (access 26.04.2019)
174 Katarzyna Krawczyńska, Izabela Karsznia
aircraft model, on the basis of which the number database covers a specified period of time and
of seats for passengers was determined. Then, data useful for the purpose of this study.
using the flight load indicators for the given air-
lines, the searched values were calculated. 8. Conclusions
One common conclusion can be drawn from
the cited article and this paper that the websites This research shows that the presented
presenting air traffic data can be used for quan- websites (flightradar24.com, radarbox24.com,
titative analyses and examining the regularities flightaware.com and planefinder.com) are useful
of air traffic, and the data can be presented by for examining air traffic and its regularities. The
means of maps and charts. functionality test was carried out in three stages,
consisting of the development of a functionality
7.3. Detailed analysis table, designing a database, and detailed anal-
ysis of the websites.
Detailed analysis showed that the data from This study uses a ready-made set of functions
the analyzed websites is usually consistent, but developed for electronic maps (A. Macioch,
G. Malmon 2010). When examining the scope
there are situations when they differ significantly.
of functions of the described websites, it can be
In conclusion, we find that the websites seem
noticed that it is narrower than in typical map
to be very helpful as a compatible single source
websites, which are usually not so specialized
of data in specific cases where the data does
and concern more general issues. Some of the
not contradict each other. The websites offer
examined functions would not be useful in air
various options, data, studies and data search
traffic sites. When using a specific range of func-
possibilities. Therefore, if users encounter a pro-
tions, it was also noticed that there were no
blem finding information on one site, they can
functions that could increase the functionality
usually find it on another and then use the former
and make it much easier for users to use the
again. An example may be the fact that on websites.
Flightradar24 the register of flights departing Since functionality may also concern the
from a given airport allows viewing the register scope of data that the websites have and the
of flights only up to one day back. RadarBox24, possibility of using them, a database was also
on the other hand, allows users to roll back up created and the possibilities of its subsequent
to 8 days. Therefore, when users find the flight use were established. The collected data and
they are looking for on RadarBox24, they can their elaboration can be used to create various
search for it on Flightradar24 by taking its num- maps in order to better visualize the studied
ber from RadarBox24. This is just one of the ways issue, the more so as such data is not easy to
to combine data from these sites. obtain due to its strategic nature. For example,
An additional argument is the fact that the you can create a map of the most important
examined websites are usually compatible with destinations of flights from Chopin Airport,
each other and their data do not differ from each grading their importance using a route diagram
other. Each of the websites differs in terms of that would specify the number of flights per
the data presented, which means that instead week. This can also be represented by a point
of using just one website, users can use several diagram map, however, a route diagram map
at the same time. For example, route data can better shows the movement that is visualized
be taken from Flightradar24, and route data or on the basis of these maps.
altitude data can be sourced from Flightaware. Another example is the map of the actual flight
In this way, the websites can complement one time from Warsaw to other airports in Poland.
another. Some websites have more precise For this purpose, it would be necessary to cal-
data (e.g. location data) or simply have more culate the average flight duration to all Polish
data available (e.g. they may show most of the cities on the list, and then develop a map using
routes). the isochrones method. This is obviously not an
It should also be noted that this article is not exhaustive list of maps that can be developed.
an exhaustive study of the analyzed websites. The concept of functionality is complex and
Only some of the functions available on the web- may also apply to the general functioning of
sites have been analyzed, and the developed websites and their suitability for use, also inAn analysis of the functionality of selected websites presenting data on air traffic 175 research. One of the factors that make websites Summing up, it is not easy to determine the useful is their credibility and accuracy. It was most functional website in all the examined examined through a detailed analysis in which areas. However, as mentioned above, to in- data from particular websites were compared. crease the likelihood of data accuracy and the Typical errors and inconsistencies included range of functions and data, several websites variations in flight duration, no exact data on can be used simultaneously to collect and part of the route, and no data of any kind on compile data. the route. Literature Crampton J.W., 2002, Interactivity types in geogra- In: Does animation facilitate learning? An evalua- phic visualization. “Cartography and Geographic tion of the congruence and equivalence hypotheses. Information Science” Vol. 29, no. 2, pp. 85–98; Doctor’s thesis, Stanford University, pp. 1–12, https:// DOI: 10.1559/152304002782053314 www.learntechlib.org/p/115900/ (access 2.01.2019). DiBiase D., MacEachren A.M., Krygier J.B., Reeves C., Nivala A.M., Brewster S., Sarjakoski T.L., 2008, Usa- 1992, Animation and the role of map design in scien- bility evaluation of web mapping sites. “The Carto- tific visualization. “Cartography and Geographic In- graphic Journal” Vol. 45, no. 2, pp. 129–138; DOI: formation Systems” Vol. 19, no. 4, pp. 201–214; 10.1179/174327708X305120 DOI:10.1559/152304092783721295 Nowacki T., Opach T., 2010, Mapy i atlasy elektro- Fernandez A., Insfran E., Abrahão S., 2011, Usability niczne. In: J. Pasławski (ed.), Wprowadzenie do kar- evaluation methods for the web: A systematic map- tografii i topografii, Wrocław: Nowa Era, pp. 386–406. ping study. “Information and Software Technology” Okonek M., 2010, Lokalizacyjne serwisy mapowe w No. 53, no. 8, pp. 789–817. Polsce – zakres treści, geowizualizacje, funkcje Harrower M., 2001, Visualizing change: Using carto- interaktywne. “Polski Przegląd Kartograficzny” T. 42, graphic animation to explore remotely-sensed data. no. 3, pp. 211–226. ”Cartographic Pespectives” No. 39, pp. 30–42; DOI: Peterson M.P., Hunt P., Weiß K., 2017, Mapping air 10.14714/CP39.637 population. “Journal of Geovisualization and Spa- Harrower M., 2003, Tips for designing effective ani- tial Analysis” Vol. 1, no. 4; DOI: 10.1007/s41651- mated maps. “Cartographic Pespectives” No. 44, 017-0005-3 pp. 63–65; DOI: 10.14714/CP44.516 Pearrow M., 2002, Funkcjonalność stron interneto- Harrower M., 2004, A look at the history and future of wych. Gliwice: Helion. animated maps. ”Cartographica” Vol. 39, no. 3, Roth R.E., Çöltekin A., Delazari L., Filho H.F., Griffin A., pp. 33–42; DOI: 10.3138/7MN7-5132-1MW6-4V62 Hall A., Korpi J., Lokka I., Mendonça A., Ooms K., Kowalski P.J., 2006, Problem funkcjonalności pre- van Elzakker C.P., 2017, User studies in cartography: zentacji kartograficznych w internetowych serwi- opportunities for empirical research on interactive sach informacyjnych. In: Społeczna i edukacyjna maps and visualizations. “International Journal of rola kartografii w Polsce. “Materiały Ogólnopolskich Cartography” Vol. 3, (Sup. 1), pp. 61–89; DOI: Konferencji Kartograficznych” T. 26, Warszawa, 10.1080/23729333.2017.1288534 pp. 103–127. Roth R.E., Ross K.S., MacEachren A.M., 2015, User- Kowalski P.J., 2012, Mapa jako praktyczny interfejs centered design for interactive maps: A case study serwisu internetowego. “Archiwum Fotogrametrii in crime analysis. “SPRS International Journal of Kartografii i Teledetekcji” T. 23, pp. 159–168. Geo-Information” Vol. 4, no. 1, pp. 262–301; DOI: Krawczyńska K., 2019, Analiza funkcjonalności wy- 10.3390/ijgi4010262 branych serwisów internetowych prezentujących Slocum T.A., Blok C., Jiang B., Koussoulakou A., dane o ruchu lotniczym. University of Warsaw, Montello D., Fuhrmann S., Hedley N., 2001, Cogni- Faculty of Geography and Regional Studies. tive and usability issues in geovisualization. “Carto Kukułka M., 2011, Nowe aspekty metodyczne pro- graphy and Geographic Information Science” Vol. 28, jektowania serwisów map internetowych. “Polski no. 1, pp. 61–75; DOI: 10.1559/152304001782173998 Przegląd Kartograficzny” T. 43, nr 3, pp. 239–251. Tsou M.H., Curran J.M., 2008, User-centered design Macioch A., Malmon G., 2010, Funkcje interaktywne approaches for web mapping applications: A case współczesnych map elektronicznych. “Polski Prze- study with USGS hydrological data in the United gląd Kartograficzny” T. 42, nr 4, pp. 331–353. States. In: M.P. Peterson (ed.), International per- Meksuła M.W., 2001, Kartograficzne sposoby pre- spectives on maps and the Internet. “Lecture Notes zentowania dynamiki zjawisk. “Polski Przegląd in Geoinformation and Cartography”, Berlin, Hei- Kartograficzny” T. 33, nr 4, pp. 329–338. delberg: Springer, pp. 301–321; DOI: 10.1007/978- Morrison J.B., 2000, The complex nature of animation. 3-540-72029-4_20
You can also read