Carbon emissions and removals from forests: new estimates, 1990-2020
←
→
Page content transcription
If your browser does not render page correctly, please read the page content below
Earth Syst. Sci. Data, 13, 1681–1691, 2021
https://doi.org/10.5194/essd-13-1681-2021
© Author(s) 2021. This work is distributed under
the Creative Commons Attribution 4.0 License.

             Carbon emissions and removals from forests: new
                          estimates, 1990–2020
         Francesco N. Tubiello1 , Giulia Conchedda1 , Nathan Wanner1 , Sandro Federici2 , Simone Rossi3 , and
                                                 Giacomo Grassi3
                                         1 Statistics
                                                 Division, FAO, Rome, 00153, Italy
                       2 Institute
                                for Global Environmental Strategies, IGES, Hayama, 240-0112, Japan
                         3 European Commission Joint Research Centre, EC JRC, Ispra, 21027, Italy

                           Correspondence: Francesco N. Tubiello (francesco.tubiello@fao.org)

                                     Received: 20 July 2020 – Discussion started: 3 August 2020
                            Revised: 2 March 2021 – Accepted: 9 March 2021 – Published: 26 April 2021

       Abstract. National, regional and global CO2 emissions and removals from forests were estimated for the pe-
       riod 1990–2020 using as input the country reports of the Global Forest Resources Assessment 2020. The new
       Food and Agriculture Organization of the United Nations (FAO) estimates, based on a simple carbon stock
       change approach, update published information on net emissions and removals from forests in relation to (a) net
       forest conversion and (b) forest land. Results show a significant reduction in global emissions from net forest
       conversion over the study period, from a mean of 4.3 in 1991–2000 to 2.9 Gt CO2 yr−1 in 2016–2020. At the
       same time, forest land was a significant carbon sink globally but decreased in strength over the study period,
       from −3.5 to −2.6 Gt CO2 yr−1 . Combining net forest conversion with forest land, our estimates indicated that
       globally forests were a small net source of CO2 to the atmosphere on average during 1990–2020, with mean
       net emissions of 0.4 Gt CO2 yr−1 . The exception was the brief period 2011–2015, when forest land removals
       counterbalanced emissions from net forest conversion, resulting in a global net sink of −0.7 Gt CO2 yr−1 . Im-
       portantly, the new estimates allow for the first time in the literature the characterization of forest emissions
       and removals for the decade just concluded, 2011–2020, showing that in this period the net contribution of
       forests to the atmosphere was very small, i.e., a sink of less than −0.2 Gt CO2 yr−1 – an estimate not yet re-
       ported in the literature. This near-zero balance was nonetheless the result of large global fluxes of opposite sign,
       namely net forest conversion emissions of 3.1 Gt CO2 yr−1 counterbalanced by net removals on forest land of
       −3.3 Gt CO2 yr−1 . Finally, we compared our estimates with data independently reported by countries to the
       United Nations Framework on Climate Change, indicating close agreement between FAO and country emissions
       and removals estimates. Data from this study are openly available via the Zenodo portal (Tubiello, 2020), with
       DOI https://doi.org/10.5281/zenodo.3941973, as well as in the FAOSTAT (Food and Agriculture Organization
       Corporate Statistical Database) emissions database (FAO, 2021a).

1   Introduction                                                   roughly 4–5 Gt CO2 yr−1 in recent decades (e.g., Tubiello,
                                                                   2019). Additional important anthropogenic emissions and re-
Emissions from agriculture, forestry and other land uses rep-      movals of CO2 are located directly on forest land, in relation
resent nearly a quarter of world total anthropogenic emis-         to processes linked to forest management or degradation.
sions (Smith et al., 2014; IPCC, 2019). Importantly, the CO2          There is nonetheless significant disagreement between car-
component of these emissions is generated on land at the           bon cycle models on the one side and national greenhouse
margin between farm and natural ecosystems, largely in re-         gas inventories (NGHGIs) on the other on the quantification
lation to processes that convert land for agricultural use,        of the combined emissions and removals of CO2 from all
such as deforestation and drainage of peatlands, generating

Published by Copernicus Publications.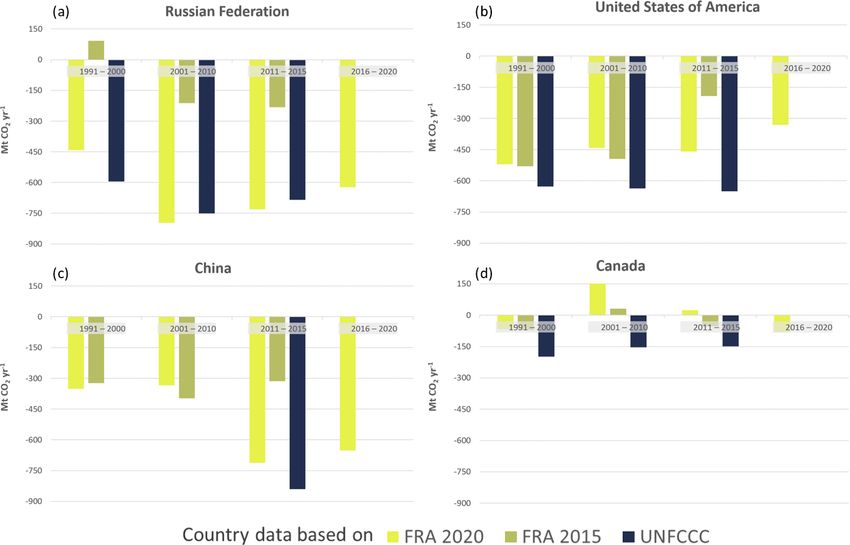
1682                          F. N. Tubiello et al.: Carbon emissions and removals from forests: new estimates, 1990–2020

these land processes, though it is being increasingly shown         scribing the methods used in this work, we also discuss their
that most differences are due to boundaries and definitional        limitations and uncertainties and the scope for comparing
issues (e.g., Grassi et al., 2018, 2021). Greatly simplifying       FAO estimates to UNFCCC country data.
and limiting our scope to forests, terrestrial carbon cycle
models have tended to focus on the CO2 emissions from               2.1   Gap-filling
deforestation and forestry activities (land use change pro-
cesses defined under the term ELUC ), while NGHGIs have             The FRA 2020 data used herein are forest land area – as a
typically added removals on forest land beyond those linked         total and for its two sub-categories, i.e., naturally regener-
to forestry practices, which the models tend to not consider        ating forest area (including both primary and secondary for-
to be anthropogenic. These forest removals in NGHGI coun-           est) and planted forest area – and carbon stock in above- and
terbalance the positive emissions, resulting in near-zero es-       below-ground living biomass. Data cover the period 1990–
timated total net contributions of forests to the atmosphere        2020. We gap-filled missing carbon stock data when needed
(Grassi et al., 2018). Beyond the critical issues of the dif-       by using relevant regional averages of carbon stock density
ferences in boundaries and definitions between the two ap-          (carbon stock per unit forest land area), multiplied by coun-
proaches, which are addressed elsewhere (e.g., Grassi et al.,       try forest land area. Additionally, we checked the consistency
2021), there is a significant need to improve the underly-          of forest land area values against its two sub-components. In
ing activity input data used by both approaches. To this end,       the few cases when such consistency was violated, we re-
the Food and Agriculture Organization of the United Nations         computed naturally regenerating forest area as the difference
(FAO) collects, analyses and disseminates at regular intervals      between forest land and planted forest area. The slightly re-
a wealth of country-based forest statistics through its Global      vised dataset was used as input into the emissions calcula-
Forest Resources Assessment (FRA), describing the status            tions. It is openly available via the Zenodo portal (Tubiello,
of forests with data at the country, regional and global level      2020), with DOI https://doi.org/10.5281/zenodo.3941973, as
(FAO, 2020). FRA activity data of forest land area and carbon       well as via the FAOSTAT database (FAO, 2021a).
stock serve as critical inputs for estimates of forest carbon
fluxes by the FAO (Federici et al., 2015; FAO, 2021b) and           2.2   Forest definition
other major international efforts (e.g., Friedlingstein et al.,
2019; IPCC, 2019; Houghton and Nassikas, 2017). This pa-            The term forest land used herein follows the international
per describes the forest statistics available at the FAO to esti-   FAO land use definitions (FAO, 2020b), also adopted by the
mate emissions and removals of CO2 from forests that, being         UN system for environmental economic accounting (FAO
based on a simple though powerful (and replicable) carbon           and UN, 2020), based on the FRA. As a land use cate-
stock change method, generate data that can serve as bound-         gory, the FAO definition of forest land comprises areas un-
ary conditions to help evaluate more complex terrestrial car-       der forestry production, forest conservation (including nat-
bon model results and NGHGI data. Our analysis highlights           ural parks), and in general any area regulated administra-
new trends based on the use of FRA 2020 input data, doc-            tively in terms of destination and use (including unman-
umenting the differences with respect to the previous use of        aged forests) as long as three basic biophysical conditions
FRA 2015. Finally, it compares results to national data inde-       are met, namely (i) minimum tree height of 5 m at maturity,
pendently reported by countries to the United Nations Frame-        (ii) overall crown cover greater than 10 % and (iii) minimum
work Convention on Climate Change (UNFCCC).                         of 0.5 ha in extension. (for complete definitions see, e.g., the
                                                                    FAO Land Use questionnaire: http://www.fao.org/economic/
                                                                    ess/ess-home/questionnaires/en/, last access: March 2021).
2   Material and methods                                               Countries reporting forest land data to the FAO are ex-
                                                                    pected to adhere to the above definitions and explicitly
The estimates of CO2 emissions and removals from forests            present how the conversion from national land use categories
made by the FAO and published in FAOSTAT (Food and                  to the FAO categories was done. However, the uncertainty
Agriculture Organization Corporate Statistical Database)            in the related area and stock estimates remains largely unre-
(FAO, 2021b) are computed by applying a simplified car-             ported. The magnitude of these uncertainties can vary signif-
bon stock change method based on the 2006 Intergovern-              icantly depending on the underlying estimation and/or map-
mental Panel on Climate Change (IPCC) Guidelines for Na-            ping methodology. It has been recently shown that estimates
tional Greenhouse Gas Inventories (IPCC, 2006). Previous            based on land use and land cover information derived from
estimates covered the period 1990–2015, using as inputs ac-         remote sensing can result in differences of up to 20 % at
tivity data from the FRA 2015 (Federici et al., 2015). This         the regional level, largely due to the difficulty of mapping
work extends the FAO estimates of emissions and removals            land cover characteristics to land use status (FAO, 2021b).
to 2020, by adding new input data for the period 2015–2020          For well-defined forest land areas, typical uncertainties in
while incorporating any revision in time series that may have       national forest inventories may be nonetheless an order of
occurred in the FRA 2020 with respect to FRA 2015. In de-           magnitude smaller. For lack of additional knowledge on how

Earth Syst. Sci. Data, 13, 1681–1691, 2021                                          https://doi.org/10.5194/essd-13-1681-2021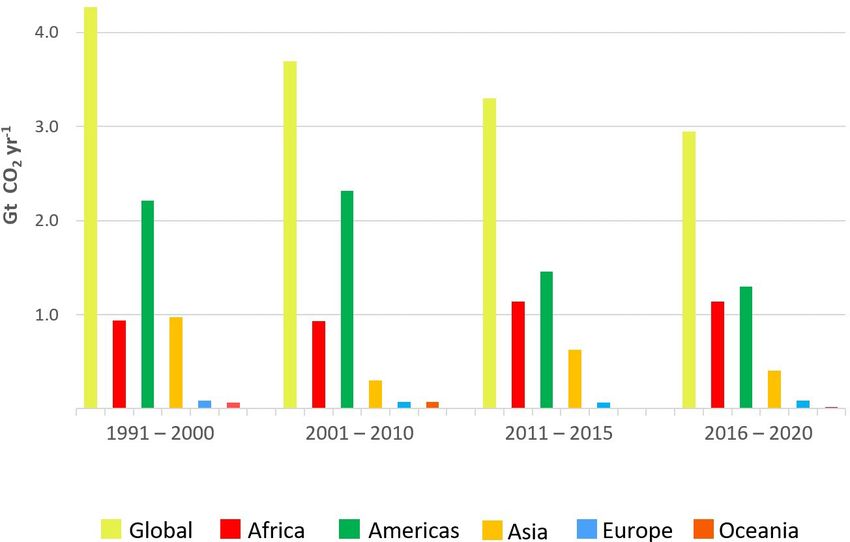
F. N. Tubiello et al.: Carbon emissions and removals from forests: new estimates, 1990–2020                                     1683

uncertainty in local measurements would propagate to na-
tional and regional scales, we applied the generic uncertainty
suggested by the IPCC for FAO activity data (20 %) to the
forest land area and biomass stock data used in this work.
   In terms of comparison with UNFCCC data, we note that
the FAO forest land use definitions used herein may dif-
fer from those used by countries for reporting their national
greenhouse gas (GHG) inventories (NGHGIs), for instance
in relation to minimum forest area thresholds or in criteria
to assign land use status. Furthermore, country reporting of
emissions and removals data to the UNFCCC is limited to
areas of managed forest, as per IPCC guidelines, while the
FAO land use definitions comprise both managed and un-
managed forests, as discussed above. In practice, such dif-
ferences may often be small, considering that a large portion
of the world’s forest land area in many countries is adminis-
                                                                   Figure 1. The three main carbon fluxes considered in this paper,
tratively regulated. Finally, we note that the FAO forest land
                                                                   consisting of emissions from net forest conversion (NFC), emis-
area considered herein does not track separately, as done in-      sions and removals on forest land (FL), and their aggregate, repre-
stead in UNFCCC reporting, the two sub-components for-             senting total net emissions/removals from forests (ER). Photo copy-
est land remaining forest land (FL-FL) and newly converted         right: Francesco N. Tubiello.
forest land. This is often overlooked in the literature, where
FAO estimates of forest land emissions and removals may
be incorrectly compared to UNFCCC data for FL-FL (e.g.,            conversion, NFC, and emissions/removals from forest land,
Petrescu et al., 2020).                                            FL (Fig. 1).

2.3   Emissions and removals                                       2.3.1   Emissions from net forest conversion
The estimates presented herein provide information on total        For each country a, total carbon stock Ba and time period ti ,
net emissions and removals from forests, in total as well as by    the emissions from net forest conversion, NFCa (ti ), in Eq. (1)
component processes. Specifically, for each country a and to-      were computed as the positive carbon flux to the atmosphere
tal carbon stock Ba , the total forest emissions/removals, ERa ,   associated with net forest land area loss, tracked separately
were computed as a simple carbon stock change as follows:          for sub-categories naturally regenerating forest, NRa , and
                                                                   planted forest, PLa , as follows:
ERa (ti ) = −1Ca (ti )
        = −[Ba (ti ) − Ba (ti−1 )]                                 NFCa (ti ) =
        = NFCa (ti ) + FLa (ti ),                           (1)    − [Ba (ti−1 )/Aa (ti−1 )]{min[NRa (ti ) − NRa (ti−1 ), 0]
                                                                   + min[PLa (ti ) − PLa (ti−1 ))], 0]}.                          (2)
where biomass stock information was derived from the FRA
2020 as indicated in the previous section, and ti = 1990,             Thus net forest conversion tracks losses of both naturally
2000, 2010, 2015, 2020 represents FRA years. The minus             regenerating (including primary and secondary forests) and
sign was used to adhere to the convention of considering           planted forest areas. It should be noted that in cases when
emissions to be positive fluxes to the atmosphere, corre-          net forest land area change is positive, indicating net area
sponding to decreases in forest carbon stock, and vice versa       gains, NFC is zero by definition, and the relevant emis-
to consider removals to be negative fluxes, i.e., from the at-     sions/removals are instead accounted for on forest land (see
mosphere into forest land, corresponding to increases in for-      next section). A number of limitations apply to the compu-
est carbon stock. We note that the estimates in Eq. (1) are        tation of emissions in Eq. (2). First, results are limited by
robust as well as easily replicable by anyone having access        the lack of carbon stock data by forest sub-component, re-
to FRA data. At the same time, it is noted that the FAO car-       sulting in the need to apply a single value for both naturally
bon stock change estimates include only two of the five car-       regenerating forest and planted forest. Considering that the
bon pools typically reported by countries according to the         majority of forest area losses in the FRA 2020 pertain to the
IPCC. This difference may affect the magnitude of the esti-        natural forest component, however, the use of a single carbon
mated C stock changes, although likely not the sign, because       density value in Eq. (2) is not a significant issue to this end.
of biophysical linkages across carbon pools. The net forest        At the same time, carbon stock density can be expected to
signal to the atmosphere, ER, was split into two mutually          be higher in natural forests than the average biomass stock
exclusive components, specifically emissions from net forest       (which also includes carbon stock in plantations), implying

https://doi.org/10.5194/essd-13-1681-2021                                          Earth Syst. Sci. Data, 13, 1681–1691, 2021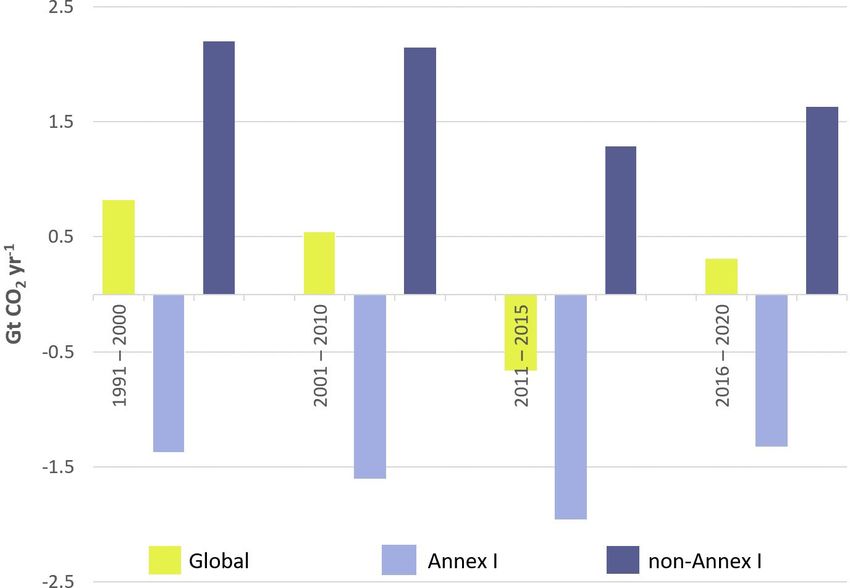
1684                            F. N. Tubiello et al.: Carbon emissions and removals from forests: new estimates, 1990–2020

that the NFC emissions computed in Eq. (2) are likely under-      2.4   Comparisons to UNFCCC data
estimates. Furthermore, we note that Eq. (1) above does not
depend on the availability of carbon stock values by forest       A final consideration on the limitations of the approach pre-
sub-component. A second important limitation to Eq. (2) is        sented herein concerns the underlying drivers of the emis-
that forest losses are computed net of forest area gains tak-     sions/removals estimates, i.e., whether they could be labeled
ing place over the same period. The underlying activity data      as anthropogenic or natural fluxes. On the one hand, the def-
used as input do not in fact allow separate tracking of gross     initions underlying Eqs. (1)–(3) make the association impos-
gains and losses. Thus in terms of comparison to the UN-          sible within our approach. On the other, a bit more can be
FCCC, FAO net forest conversion data would roughly cor-           said in practice. This is because human intervention is typ-
respond to the sum of UNFCCC-reported land use changes            ically required to determine land use changes, such as the
from forest land to non-forest land for those countries using     establishment of specific activities, for instance agriculture,
the so-called “IPCC approach 1” to land use representation,       preventing natural forest regrowth and recovery following
which like our estimates relies on net area changes. By con-      forest loss. To this end, and within the limitations discussed
trast, use of more accurate national forest inventories, with     above, net forest conversion, representing permanent forest
more detailed identification of gross area fluxes, would gen-     loss in the FAO statistics, can be considered virtually all an-
erate larger differences between FAO estimates and the cor-       thropogenic in nature and is hence a good proxy for human-
responding UNFCCC country data for this category. Finally         driven deforestation. Conversely, only a portion of the emis-
and importantly, estimates in Eq. (2) are limited by the un-      sions/removals estimated on forest land can be considered
derlying uncertainty in the activity data. Simple error prop-     anthropogenic. At the same time, recent work shows that
agation of the component uncertainties in area and carbon         the anthropogenic portion of this component can be substan-
stock discussed in the previous section give an uncertainty in    tial once the concept of “managed land” is expanded beyond
NRC emissions of roughly 50 %. This is consistent with val-       forestry practices to include all forest areas except in very re-
ues used for land use change emissions estimates published        mote places (Grassi et al., 2021). Nonetheless, because of the
in recent IPCC reports (IPCC, 2019) and in relevant carbon        above complexities, we chose not to determine a priori the
cycle literature (Friedlingstein et al., 2019). For coherence,    anthropogenic portion of our emissions/removals estimates.
we applied this uncertainty value to ER and FL estimates.         Instead, we complemented our analysis of results with a com-
                                                                  parison between our estimates of emissions and removals and
2.3.2   Emissions and removals on forest land                     the anthropogenic fluxes submitted by countries to the UN-
                                                                  FCCC. In this context, although it is recognized that coun-
For any country a, total carbon stock Ba and time period ti in    tries report data to both the FAO and UNFCCC, we reserve
Eqs. (1) and (2) above, the emissions/removals on forest land,    herein the term “country data” for the emissions/removals re-
FLa (ti ), were computed as the residual between total forest     ported by countries to the UNFCCC.
carbon stock change and net forest conversion as follows:            To this end, we used country data on LULUCF (Land Use,
                                                                  Land Use Change and Forestry) accessed at the UNFCCC
FLa (ti ) = ERa (ti ) − NFCa (ti ).                        (3)    data portal (UNFCCC, 2020) and complemented with in-
                                                                  formation from national Biennial Update Reports (BURs).
The emissions/removals computed in Eq. (3) represent the
                                                                  While data from Annex I countries (AI) are fairly complete
net carbon flux to or from the atmosphere located within
                                                                  over the period 1990–2018, data from non-Annex I (NAI)
the boundaries of forest land area, arising from a combina-
                                                                  countries are sparse, although they are becoming increas-
tion of carbon stock and forest area changes between succes-
                                                                  ingly available through BURs. Given these data limitations,
sive FRA periods. These changes in principle may arise from
                                                                  a full comparison was possible only for Annex I countries
both anthropogenic and natural causes, including legacy ef-
                                                                  for the FRA periods 1990–2000, 2001–2010 and 2011–2015.
fects of deforestation prior to the study period, afforesta-
                                                                  First, we compared results of Eq. (3) with aggregate Annex
tion, forest management, climate signals, and the impacts
                                                                  I reporting of emission/removal for the category “4.A For-
on plant growth of nitrogen deposition and increased atmo-
                                                                  est land” (UNFCCC, 2020). To gain further insights, we also
spheric CO2 concentrations. As discussed above, we asso-
                                                                  separately analyzed emissions/removals on forest land re-
ciated an uncertainty level of 50 % to estimates in Eq. (3),
                                                                  ported by individual countries in their national GHG invento-
consistently with those computed for the emissions from net
                                                                  ries (NGHGIs), focusing on those reporting large sinks, i.e.,
forest conversion and in line with the uncertainty used in the
                                                                  Canada, Russian Federation and the United States of Amer-
literature.
                                                                  ica among Annex I parties and China among non-Annex I
   Within the differences highlighted above, with regards to
                                                                  parties. We also compared our results for net forest conver-
land accounting approaches and differences in national for-
                                                                  sion to available non-Annex I country data from Brazil and
est definitions, the FAO emissions/removals on forest land
                                                                  Indonesia, representing large emission sources – according
largely correspond to those used by countries in their report-
                                                                  to FAOSTAT estimates, the first- and third-largest emitters,
ing to the UNFCCC with respect to forest land.
                                                                  respectively, in this category (FAO, 2021a). Unfortunately,

Earth Syst. Sci. Data, 13, 1681–1691, 2021                                        https://doi.org/10.5194/essd-13-1681-2021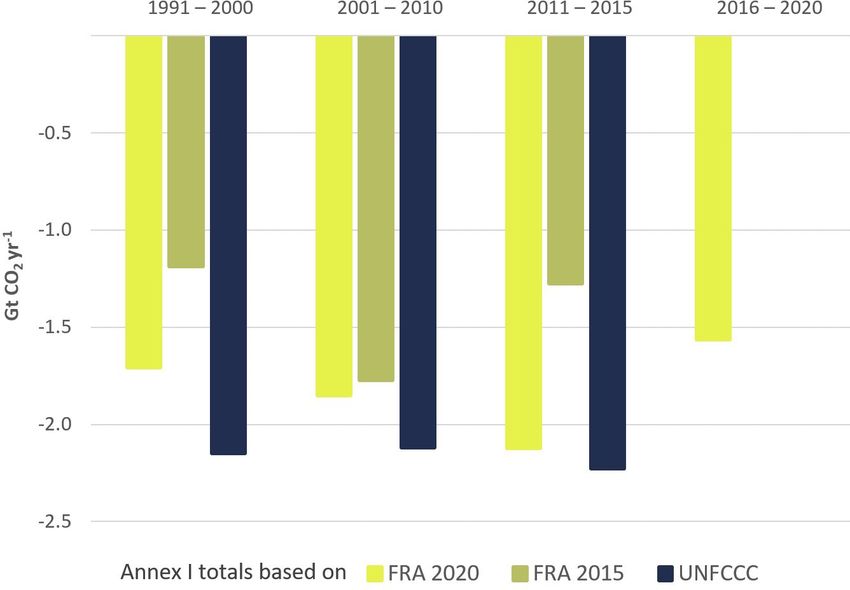
F. N. Tubiello et al.: Carbon emissions and removals from forests: new estimates, 1990–2020                                 1685

no BUR submissions have been made so far by the Demo-
cratic Republic of Congo – the second-largest emitter from
deforestation according to FAOSTAT data – which therefore
could not be included in this comparison exercise. Data for
NAI countries were sourced from China’s second Biennial
Update Report (UNFCCC, 2018a), Brazil’s third Biennial
Update Report (UNFCCC, 2019) and Indonesia’s second Bi-
ennial Update Report (UNFCCC, 2018b).

2.5    Structure of the datasets and online access

The FAO emissions and removals estimates and associated
area information statistics are disseminated in the FAOSTAT
Emissions Land Use/Forest Land domain as yearly statistics       Figure 2. Estimates of emissions from net forest conversion (NFC)
over the period 1990–2020 (FAO, 2021a) for 220 countries         based on FRA 2020 for global (acid green) and regional (Africa:
and territories. Annual mean fluxes are obtained by divid-       red; Americas: green; Asia: gold; Europe: sapphire; Oceania: or-
ing the outcomes of Eqs. (1)–(3) by the relevant underlying      ange) totals in Gt CO2 yr−1 .
FRA time period intervals, i.e., by 5 or 10 years. They there-
fore refer to the following periods: 1991–2000, 2001–2010,
2011–2015 and 2016–2020. For completeness, values for the        to 2015, from 4.3 to 3.3 Gt CO2 yr−1 , less than previously es-
year 1990 were set equal to the averages computed for 1991–      timated over the same period using the FRA 2015 (−40 %). It
2000, and the full period of analysis was referred to as 1990–   decreased by another 10 % to 2.9 Gt CO2 yr−1 during 2016–
2020. Data include, by country and year, forest land area and    2020. For the period 2016–2020, the Americas and Africa
area of net forest conversion (in 1000 ha), emissions from net   were nearly equal contributors but with markedly opposite
forest conversion, emissions/removals on forest land, and to-    trends compared to the period 1991–2000. Specifically with
tal emissions/removals from forests (in kt CO2 ). The carbon     respect to the two time periods, emissions in the Americas
stock in living biomass (in Mt C) is available under the FAO-    nearly halved, from 2.2 to 1.3 Gt CO2 yr−1 , while they in-
STAT database Inputs/Land Use (FAO, 2021b). Data are dis-        creased in Africa, from 0.9 to 1.1 Gt CO2 yr−1 . Asia was the
seminated by country and by standard FAO regional aggre-         third region in terms of emissions from net forest conversion,
gations and special groups, including the Annex I and non-       showing a slight decrease, from 0.6 to 0.4 Gt CO2 yr−1 over
Annex I country grouping relevant to UNFCCC reporting.           the same time periods (Fig. 2).

                                                                 3.2   Emissions and removals on forest land
3     Results
                                                                 Emissions/removals on forest land showed a net sink over
We present below the main findings of annual CO2 emis-           the entire period 1990–2020, with a mean removal of
sions/removals estimates from net forest conversion, forest      −3.3 Gt CO2 yr−1 globally. This forest carbon flux was
land, and their aggregate total emissions and removals from      nearly equally divided between Annex I (−1.8 Gt CO2 yr−1 )
forest for the period 1990–2020, computed for more than          and non-Annex I countries (−1.5 Gt CO2 yr−1 ) (Table 1).
200 countries and territories, based on Eqs. (1)–(3) above.      Additionally, we computed that the new FAO estimates in-
Emissions and removals are expressed in annual means             dicated a stronger forest sink than previously estimated us-
(Gt CO2 yr−1 ) relative to the relevant FRA period. Results      ing FRA 2015 data, i.e., on average 1.0 Gt CO2 yr−1 (35 %)
are presented at the global level, by Annex I and non-Annex      stronger due to larger estimated sinks in Europe (dominated
I countries, and by region, where relevant. Differences with     by trends in the Russian Federation) and Asia (China).
estimates based on earlier FRA 2015 input data are also dis-        At the same time, the estimated global forest land sink
cussed, where of interest.                                       weakened in strength over the study period, with the world
                                                                 total mean decreasing from −3.5 to −2.6 Gt CO2 yr−1 , i.e.,
3.1    Emissions from net forest conversion                      about a 20 % decrease from 1990 to 2020. The period 2011–
                                                                 2015 represented an exception to this decreasing trend, show-
Results show that carbon fluxes to the atmosphere from net       ing the strongest forest sink over the study period, with mean
forest conversion were significant, with world total means of    world total rates of −4.0 Gt CO2 yr−1 . In terms of regional
3.7 Gt CO2 yr−1 for the period 1990–2020, and almost en-         distribution and averaged over the period 1990–2020, Eu-
tirely located in non-Annex I countries, which contributed       rope, the Americas and Asia nearly equally contributed to
more than 90 % of the world total (Table 1). In terms of tem-    the estimated forest land removals, within a narrow range of
poral trends, the global mean decreased by 20 % from 1990        −1.0 to −1.2 Gt CO2 yr−1 , with Europe (including the Rus-

https://doi.org/10.5194/essd-13-1681-2021                                       Earth Syst. Sci. Data, 13, 1681–1691, 2021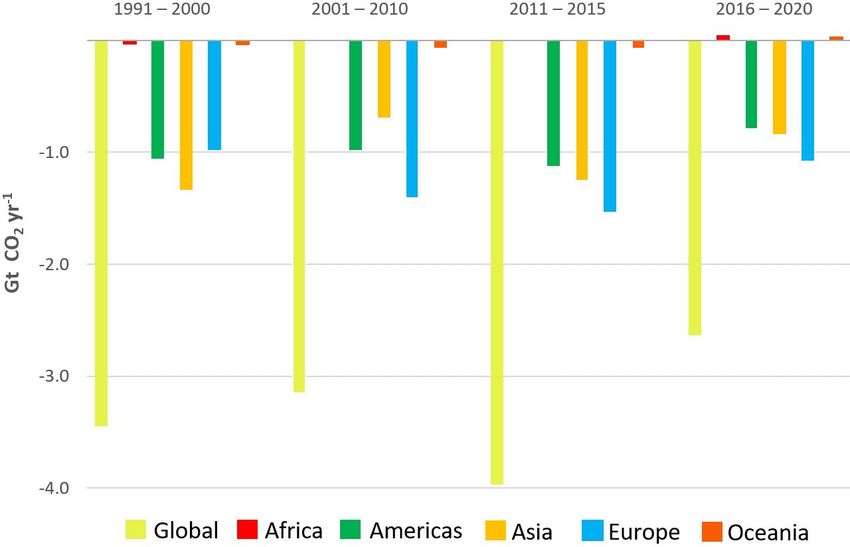
1686                          F. N. Tubiello et al.: Carbon emissions and removals from forests: new estimates, 1990–2020

Table 1. Estimates of total emissions and removals from forests (ER), net forest conversion (NFC) and emissions/removals on forest land
(FL) for world, Annex I and non-Annex I totals, based on FRA 2020 and FRA 2015 (Gt CO2 yr−1 ).

                                                                 FRA 2020                 FRA 2015
                                                           ER      NFC       FL     ER      NFC       FL
                                1991–2000                  0.8      4.3     −3.5    1.8       4.7    −2.9
                                Annex I countries        −1.4       0.3     −1.7   −1.0       0.2    −1.2
                                Non-Annex I countries     2.2       3.9     −1.7    2.8       4.5    −1.7
                                2001–2010                  0.5      3.7     −3.1    1.2       3.7    −2.6
                                Annex I countries        −1.6       0.3     −1.9   −1.4       0.4    −1.8
                                Non-Annex I countries     2.1       3.4     −1.3    2.6       3.3    −0.8
                                2011–2015                −0.7       3.3     −4.0    1.1       2.9    −1.9
                                Annex I countries        −2.0       0.2     −2.1   −1.1       0.1    −1.3
                                Non-Annex I countries     1.3       3.1     −1.8    2.2       2.8    −0.6
                                2016–2020                  0.3      2.9     −2.6
                                Annex I countries        −1.3       0.2     −1.6
                                Non-Annex I countries     1.6       2.7     −1.1
                                2011–2020                −0.2       3.1     −3.3
                                Annex I countries        −1.7       0.2     −1.9
                                Non-Annex I countries     1.5       2.9     −1.5
                                1990–2020 average          0.4      3.7     −3.3
                                Annex I countries        −1.5       0.3     −1.8
                                Non-Annex I countries     1.9       3.4     −1.5
                                1990–2015 average          0.4      3.8     −3.4    1.4       4.0    −2.5
                                Annex I countries        −1.6       0.3     −1.8   −1.2       0.3    −1.4
                                Non-Annex I countries     2.0       3.6     −1.6    2.6       3.7    −1.1

sian Federation) being the largest contributor. Conversely,
forest land in Africa was a source to the atmosphere, with
mean emissions increasing significantly from 2000 to 2015,
i.e., from 1.4 to 43 Mt CO2 yr−1 (Fig. 3). By associating net
forest land emission to forest degradation, as done in Fed-
erici et al. (2015), our results suggest a significant relative
increase in forest degradation (defined as carbon stock re-
duction in forest land) in Africa over the last 20 years.

3.3    Total emissions and removals from forests

Our estimates show that the net effects of emissions from
net forest conversion and removals on forest land were a
small net source of CO2 emissions to the atmosphere, with
a world total mean of 0.4 Gt CO2 yr−1 over the 1990–2020
period. This new estimated value was significantly less than          Figure 3. Estimates of the emissions/removals on forest land (FL)
reported earlier based on FRA 2015 data (Table 1). It is              based on FRA 2020 for global (acid green) and regional totals
further of interest to note that the estimated small global           (Africa: red; Americas: green; Asia: gold; Europe: sapphire; Ocea-
source was the result of a balance of larger fluxes: a net sink       nia: orange) in Gt CO2 yr−1 .
on forest land, largely located in UNFCCC Annex I coun-
tries (−1.5 Gt CO2 yr−1 ), counterbalanced by a net emission

Earth Syst. Sci. Data, 13, 1681–1691, 2021                                                https://doi.org/10.5194/essd-13-1681-2021
F. N. Tubiello et al.: Carbon emissions and removals from forests: new estimates, 1990–2020 1687
Figure 4. Estimates of total emissions/removals from forests (ER), Figure 5. Comparison of estimates of emissions/removals on forest
based on FRA 2020, for global (acid green), Annex I (lavender) and land (FL) for Annex I totals in Gt CO2 yr−1 , based on FRA 2020
non-Annex I (purple navy) totals in Gt CO2 yr−1 . (acid green) and FRA 2015 (olive green), to the Annex I totals re-
ported by countries to the UNFCCC (cadet blue).
Table 2. Estimates of emissions/removals on forest land for Annex I
countries, based on FRA 2020 and FRA 2015, compared to country
data reported to the UNFCCC (Gt CO2 yr−1 ). 3.4 Comparisons with the UNFCCC
Annex I total emissions/removals 3.4.1 Forest land
FRA 2020 FRA 2015 UNFCCC As discussed in the Material and methods section, we first
1991–2000 −1.7 −1.2 −2.1 compared our estimates of emissions/removals on forest land
2001–2010 −1.9 −1.8 −2.1 to data reported by Annex I countries, i.e., for category
2011–2015 −2.1 −1.3 −2.2 “4.A Forest land” in their national GHG inventory (UN-
2016–2020 −1.6 FCCC, 2020). In the aggregate, e.g., summing up all coun-
1991–2015 −1.8 −1.4 −2.2
try data and averaging over the period 1990–2015, our esti-
average mates agreed in both sign and magnitude with the UNFCCC
country data (14 % relative absolute error). Specifically, our
estimates indicated a mean sink of −1.8 Gt CO2 yr−1 vs.
−2.2 Gt CO2 yr−1 reported. Using the FRA 2015 in earlier
source from net forest conversion, mainly in non-Annex I
work (Federici et al., 2015) had given a 33 % smaller sink
countries (1.9 Gt CO2 yr−1 ).
(Table 2). Our estimates were particularly well aligned with
A more detailed analysis focusing on trends over time
country reporting for the period 2010–2015, i.e., within 5 %,
(Fig. 4) revealed two notable new findings of our analysis
predicting a sink on forest land of −2.1 Gt CO2 yr−1 vs.
with respect to previous results. First, the period 2015–2020
−2.2 Gt CO2 yr−1 reported. As in the previous case, earlier
saw a reversal of the decreasing trend in non-Annex I sources
sink estimates based on the FRA 2015 were 40 % smaller
and the increasing trend in Annex I sinks seen for the period
(Fig. 5).
1990 to 2015. Specifically, non-Annex I sources from net for-
Comparisons of estimated emissions/removals on forest
est conversion began to increase again in 2016–2020, from
land for specific countries with large reported sinks con-
1.3 to 1.6 Gt CO2 yr−1 , while Annex I sinks on forest land be-
firmed the good overall agreement found for Annex I par-
gan decreasing in strength, from −2.0 to −1.3 Gt CO2 yr−1 .
ties in aggregate. For instance, on average over the period
Second, and remarkably, forests acted as a net overall sink
1990–2015, our estimates of forest land sinks for the Russian
of atmospheric CO2 during 2011–2015, averaging nearly
Federation were within 5 % of those reported by the country
−0.7 Gt CO2 yr−1 , largely a result of decreased emissions
NGHGI. Agreement with NGHGI data was even closer after
from net forest conversion in this period, counterbalanced by
the year 2000; i.e., for the period 2001–2010 our estimates
a strong sink on forest land. Conversely, the FAO had previ-
indicated a mean sink on forest land of −800 Mt CO2 yr−1
ously estimated for the same period, based on FRA 2015 in-
versus country data of −750 Mt CO2 yr−1 and a mean sink
put data, a net emission source of 1.1 Gt CO2 yr−1 (Table 1).
of −730 Mt CO2 yr−1 versus −680 Mt CO2 yr−1 for the pe-
riod 2011–2015 (Fig. 6). Comparisons for the USA were also
encouraging, albeit with larger differences than found for the
Russian Federation. On average over the period 1991–2010,
https://doi.org/10.5194/essd-13-1681-2021 Earth Syst. Sci. Data, 13, 1681–1691, 20211688 F. N. Tubiello et al.: Carbon emissions and removals from forests: new estimates, 1990–2020
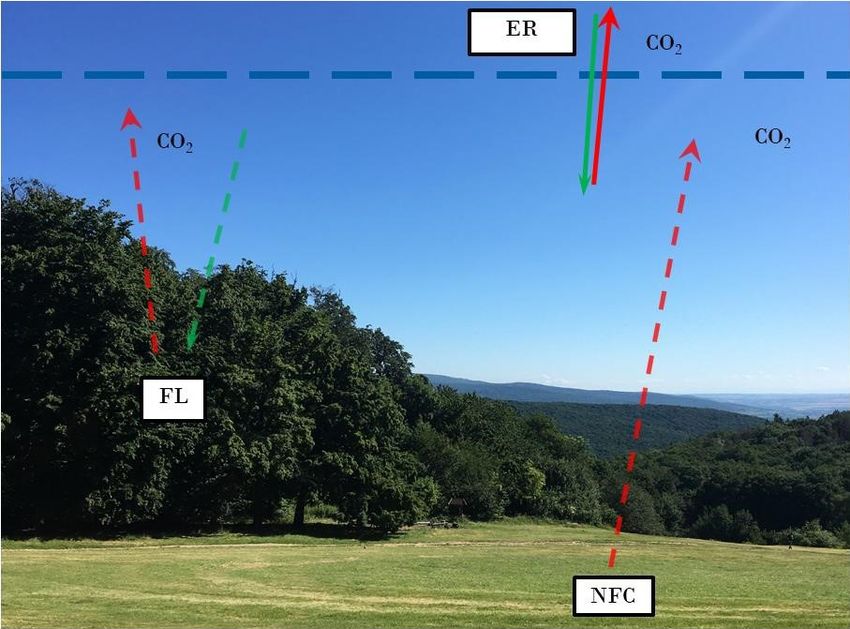
Figure 6. Comparison of estimates of emissions/removals on forest land (FL) for the Russian Federation (a), USA (b), China (c) and
Canada (d) in Mt CO2 yr−1 , based on FRA 2020 (acid green) and FRA 2015 (olive green), to country data reported to the UNFCCC (cadet
blue).
the FAO estimates were of a 25 % smaller sink on forest land to a net sink of −150 Mt CO2 yr−1 in the country data. Fi-
compared to the NGHGI country data. Averaged over the pe- nally, our estimates for the most recent period, 2016–2020,
riod 2011–2015 our estimates were 29 % smaller than the for which there is however no available NGHGI data yet
country data, or −460 and −650 Mt CO2 yr−1 , respectively. from the country, began to show a sink on forest land, of
We performed comparisons for China, using data from the −80 Mt CO2 yr−1 , thus indicating a possible alignment with
country’s second Biennial Update Report (2018), to extend NGHGI data in recent years. A possible reason for the dis-
our analysis to non-Annex I countries reporting large sinks crepancies found in this case may relate to differences in land
on forest land. Specifically, we used national data on to- use definitions, particularly those related to managed forest
tal removals from LULUCF (Land Use, Land Use Change land. For the purpose of the NGHGI, in fact, the area of man-
and Forestry) for the period 2011–2015. We concluded that aged forests defined by Canada is 65 % of the total forest
China LULUCF data were a good proxy for forest land land area reported to the FAO (Canada’s seventh National
data, considering that (1) zero emissions from net forest Communication and third Biennial Report, 2017, UNFCCC,
conversion were indicated in the same BUR, and (2) emis- 2017; Ogle et al., 2018).
sions from cropland and grassland – the other main compo-
nent of LULUCF within a national inventory – were likely
3.4.2 Net forest conversion
small, as indicated by independent emissions estimates pub-
lished in FAOSTAT (FAO, 2021a). Within these assump- We also compared estimates of emissions from net forest
tions, our estimates of a sink on forest land in China for conversion with data reported to the UNFCCC. As discussed
the period 2011–2015 agreed well with country data (within in the Material and methods section, FAO estimates of emis-
20 % of country data), i.e., −710 Mt CO2 yr−1 compared to sions from net forest conversion are proxies for deforestation
−840 Mt CO2 yr−1 reported to the UNFCCC (Fig. 6). emissions data. The two countries for which relevant data
Conversely, our estimates of emissions/removals on forest were available were Brazil and Indonesia. For Brazil, we
land did not agree well with those reported by Canada. Our compared our estimates of net forest conversion directly to
results indicated a net source on forest land, declining from deforestation emissions from the country’s BUR. For Indone-
2000 to 2015, whereas the NGHGI country data reported sia, we compared our estimates to the sum of LULUCF emis-
a progressively smaller sink over the same period (Fig. 6). sions arising from land use change to cropland and grassland
Specifically for the period 2011–2015, our estimates indi- – assuming, in line with current understanding of deforesta-
cated a weak net source, about 23 Mt CO2 yr−1 , compared tion trends in this country, that land converted to cropland
Earth Syst. Sci. Data, 13, 1681–1691, 2021 https://doi.org/10.5194/essd-13-1681-2021F. N. Tubiello et al.: Carbon emissions and removals from forests: new estimates, 1990–2020 1689
Figure 7. Comparison of estimates of emissions from net forest conversion (NFC) for Brazil (a) and Indonesia (b) in Mt CO2 yr−1 , based
on FRA 2020 (acid green) and FRA 2015 (olive green), to country data reported to the UNFCCC for deforestation (cadet blue).
and grassland in Indonesia originated largely from loss of on forest land of −3.3 Gt CO2 yr−1 (Table 1). Both fluxes,
forest land area. For Indonesia, for the period 1991–2000, and hence the overall net near-zero balance for forests, were
our estimates of emissions from net forest conversion greatly shown to be in very good agreement with the data reported
overestimated country data for deforestation, by over a fac- by countries in national GHG inventories and in line with
tor of 10 (Fig. 7). Conversely, for the more recent period independent findings by Grassi et al. (2021). At the same
2011–2015, they were on average within 25 % of country time, the consistency of our estimates with those of terrestrial
data, specifically 180 Mt CO2 yr−1 vs. country data of 165 carbon cycle models was limited to the anthropogenic car-
Mt CO2 yr−1 . Our estimates further suggested a 50 % de- bon flux from forests to the atmosphere (i.e., IPCC, 2019).
crease in emissions from net forest conversion in the period Results further showed that, with respect to the previous
2016–2020, for which however BUR data are not yet avail- decade 2001–2010, emissions from net forest conversions
able (Fig. 7). had decreased by 15 %, while removals on forest land had
For Brazil, our estimates were in good agreement (within decreased by 5 %. Further analysis of the underlying FRA
10 %) of country data over the period 1990 to 2015, i.e., 2020 data (not shown) indicated that such decreases were
on average 1.4 vs. 1.5 Mt CO2 yr−1 according to reported due to a reduced pace of natural expansion and afforesta-
data (Fig. 7). More in detail by decade, our estimates were tion in Annex I countries, which have functioned historically
1.4 vs. 1.9 Gt CO2 yr−1 during 1991– 2000 and 1.6 vs. (1990–2020) as forest sinks, as well as a decrease in for-
1.6 Gt CO2 yr−1 over 2001–2010. Conversely, for the period est loss in non-Annex I countries, which have represented
2010–2015, our estimates of emissions from net forest con- the bulk of deforestation. The new estimates also show that
version were significantly higher than reported in the BUR. over the earlier period 1991–2010, forests were a smaller net
source of emissions than previously calculated (Federici et
4 Discussion al., 2015). Largely due to much stronger sinks on forest land
estimated using the new FRA 2020 as opposed to FRA 2015
The availability of new forest area and carbon stock data data, respectively, for Europe (+0.7 Gt CO2 yr−1 ) and Asia
from the FRA 2020 enabled a new analysis of the role of (+0.6 Gt CO2 yr−1 ).
forests in generating CO2 emissions and removals at the The main new finding of this work is the large estimated
country, regional and global level during the period 1990– sink on forest land over the period 2011–2015, averaging
2020. In particular, the new information allowed us, for the −4.0 Gt CO2 yr−1 , causing the overall net negative carbon
first time in the literature, to estimate emissions and removals flux from forests highlighted in the Results section. Notable
relative to the most recent decade, covering the period 2011– contributors to this forest land sink were the Russian Fed-
2020. Our findings indicate that in the decade just concluded eration, USA, China, Indonesia and India, which all had
the net contribution of forests to the atmosphere, represent- stronger carbon uptake compared to the previous 2001–2010
ing the combination of emissions from net forest conversion period. Comparisons with country data reported to the UN-
and removals on forest land, was very small, i.e., an over- FCCC support our estimates, indicating that they represent
all emission sink of less than −0.2 Gt CO2 yr−1 , estimated an improvement compared to previous results. In particular,
for the first time in the literature for this period. It nonethe- the good agreement between our new estimates and country
less resulted from the balance of large global fluxes of op- NGHGI data on emissions/removals on forest land and emis-
posite sign, namely mean net forest conversion emissions sions from net forest conversion suggests that the definition
of 3.1 Gt CO2 yr−1 , counterbalanced by mean net removals of forest land area underlying both FAO and UNFCCC re-
https://doi.org/10.5194/essd-13-1681-2021 Earth Syst. Sci. Data, 13, 1681–1691, 20211690 F. N. Tubiello et al.: Carbon emissions and removals from forests: new estimates, 1990–2020
porting was consistent across the countries considered; i.e., Competing interests. The authors declare that they have no con-
they considered most of the forest land area reported to the flict of interest.
FAO to be managed for UNFCCC purposes, confirming the
analysis provided in the Material and methods section of this
paper. This implies that, limited to the countries tested and Disclaimer. The views expressed in this publication are those of
within the range of limitations discussed earlier in this paper, the authors and do not necessarily reflect the views or policies of
the estimates of emissions and removals from forests pro- the FAO.
vided in this paper can be considered largely anthropogenic.
Finally, the good agreements found between our estimates
Acknowledgements. We thank our colleagues from the FAO
and country reports support the finding of a large anthro-
Forestry Division who provided data, insight and expertise that
pogenic sink on forest land for the period 2011–2015, leaving greatly assisted our research. We are grateful to the staff of the FAO
open the possibility, in need of verification in coming years, Statistics Division for overall support and in particular to Giorgia
that even when considering deforestation, the world forests De Santis for her preliminary analysis of the FRA 2020 data used as
were a small sink rather than a source of atmospheric carbon input into this work, Griffiths Obli-Layrea for UNFCCC data pro-
during this period. In fact, the discussed progressive reduc- vision, and Amanda Gordon for FAOSTAT data maintenance and
tion in the overall forest source observed across the two most dissemination. We are likewise thankful to the Forest Resources As-
recent decades is consistent with these findings. sessment Process and its funders for provision of data that made this
work possible.
5 Data availability
Financial support. This research has been supported by the
The emissions and removals data, alongside input activ-
FAO’s regular budget funds, 2019–2020.
ity data of forest land area and carbon stock, are dissem-
inated in FAOSTAT (FAO, 2021a). An exact replica of
the data used for this paper is available as open access at Review statement. This paper was edited by David Carlson and
https://doi.org/10.5281/zenodo.3941973 (Tubiello, 2020). reviewed by Marieke Sandker and one anonymous referee.
6 Conclusions
References
Estimates of CO2 emissions and removals from forests were
updated based on the most recent FRA 2020 data and by ap- FAO: Global Forest Resources Assessment 2015, How are the
plying a simple yet robust, transparent and easily replicable world’s forests changing? Second edition, Food and Agriculture
carbon stock change approach. Over the period 1990–2020, Organization of the United Nations, Rome, Italy, available at:
results confirmed known country, regional and global trends, http://www.fao.org/3/a-i4793e.pdf (last access: January 2021),
FAO, Rome, 2016.
providing additional detail to specific dynamics while ex-
FAO: Global Forest Resources Assessment 2020: Main Report,
tending available information to the period 2016–2020. Im- available at: http://www.fao.org/documents/card/en/c/ca9825en
portantly, the new estimates allowed for the first time the (last access: January 2021), FAO, Rome, 2020.
characterization of forest emissions and removals for the FAO: FAOSTAT Emissions – Land Use, Forest Land, available
decade just concluded, 2011–2020, showing that in this pe- at: http://www.fao.org/faostat/en/#data/GF (last access: January
riod the net contribution of forests to the atmosphere was a 2021), FAO, Rome, 2021a.
very small sink, i.e., less than −0.2 Gt CO2 yr−1 . This near- FAO: Land statistics. Global, regional and country trends, 1990–
zero balance was nonetheless the result of large global fluxes 2018. FAOSTAT Analytical Brief Series No. 15. Rome, Italy.
of opposite sign, namely net forest conversion emissions of Available at: http://www.fao.org/3/cb2860en/cb2860en.pdf (last
3.1 Gt CO2 yr−1 counterbalanced by net removals on forest access: January 2021), FAO, Rome, 2021b.
land of −3.3 Gt CO2 yr−1 . FAO and UN: System of Environmental-Economic Accounting
for Agriculture, Forestry and Fisheries (SEEA AFF), Rome,
https://doi.org/10.4060/ca7735en, 2020.
Federici, S., Tubiello, F. N., Salvatore, M., Jacobs, H., and Schmid-
Author contributions. FNT led the research and development.
huber, J.: New estimates of CO2 forest emissions and removals:
GG contributed data analysis and country comparisons. NW de-
1990–2015, Forest Ecol. Manage., 352, 89–98, 2015.
veloped the original code and conducted FAOSTAT and FRA data
Friedlingstein, P., Jones, M. W., O’Sullivan, M., Andrew, R. M.,
analysis. SF, SR and GG supported the analysis of forest emissions
Hauck, J., Peters, G. P., Peters, W., Pongratz, J., Sitch, S., Le
and country comparisons. All authors contributed to writing the
Quéré, C., Bakker, D. C. E., Canadell, J. G., Ciais, P., Jack-
manuscript.
son, R. B., Anthoni, P., Barbero, L., Bastos, A., Bastrikov, V.,
Becker, M., Bopp, L., Buitenhuis, E., Chandra, N., Chevallier,
F., Chini, L. P., Currie, K. I., Feely, R. A., Gehlen, M., Gilfillan,
D., Gkritzalis, T., Goll, D. S., Gruber, N., Gutekunst, S., Har-
Earth Syst. Sci. Data, 13, 1681–1691, 2021 https://doi.org/10.5194/essd-13-1681-2021F. N. Tubiello et al.: Carbon emissions and removals from forests: new estimates, 1990–2020 1691 ris, I., Haverd, V., Houghton, R. A., Hurtt, G., Ilyina, T., Jain, Petrescu, A. M. R., Peters, G. P., Janssens-Maenhout, G., Ciais, P., A. K., Joetzjer, E., Kaplan, J. O., Kato, E., Klein Goldewijk, K., Tubiello, F. N., Grassi, G., Nabuurs, G.-J., Leip, A., Carmona- Korsbakken, J. I., Landschützer, P., Lauvset, S. K., Lefèvre, N., Garcia, G., Winiwarter, W., Höglund-Isaksson, L., Günther, D., Lenton, A., Lienert, S., Lombardozzi, D., Marland, G., McGuire, Solazzo, E., Kiesow, A., Bastos, A., Pongratz, J., Nabel, J. E. M. P. C., Melton, J. R., Metzl, N., Munro, D. R., Nabel, J. E. M. S., S., Conchedda, G., Pilli, R., Andrew, R. M., Schelhaas, M.-J., and Nakaoka, S.-I., Neill, C., Omar, A. M., Ono, T., Peregon, A., Dolman, A. J.: European anthropogenic AFOLU greenhouse gas Pierrot, D., Poulter, B., Rehder, G., Resplandy, L., Robertson, E., emissions: a review and benchmark data, Earth Syst. Sci. Data, Rödenbeck, C., Séférian, R., Schwinger, J., Smith, N., Tans, P. P., 12, 961–1001, https://doi.org/10.5194/essd-12-961-2020, 2020. Tian, H., Tilbrook, B., Tubiello, F. N., van der Werf, G. R., Wilt- Smith, P., Bustamante, M., Ahammad, H., Clark, H., Dong, H., shire, A. J., and Zaehle, S.: Global Carbon Budget 2019, Earth Elsiddig, E .A., Haberl, H., Harper, R., House, J., Jafari, M., Syst. Sci. Data, 11, 1783–1838, https://doi.org/10.5194/essd-11- Masera, O., Mbow, C., Ravindranath, N. J., Rice, C. W., Rob- 1783-2019, 2019. ledo Abad, C., Romanovskaya, A., Sperling, F., and Tubiello, Grassi, G., House, J., Kurz, W. A., Cescatti, A., Houghton, R. A., F. N.: Agriculture, Forestry and Other Land Use (AFOLU), in Peters, G. P., Sanz, M. J., Viñas, R. A., Alkama, R., Arneth, A., Working Group III contribution to the IPCC 5th Assessment Bondeau, A., Dentener, F., Fader, M., Federici, S., Friedlingstein, Report, Climate Change 2014: Mitigation of Climate Change, P., Jain, A. K., Kato, E., Koven, C. D., Lee, D., Nabel, J. E. edited by: Edenhofer, O., Pichs-Madruga, R., Sokona, Y., Fara- M. S., Nassikas, A. A., Perugini, L., Rossi, S., Sitch, S., Viovy, hani, E., Kadner, S., Seyboth, K., Adler, A., Baum, I., Brunner, N., Wiltshire, A., and Zaehle, S.: Reconciling global-model esti- S., Eickemeier, P., Kriemann, B., Savolainen, J., Schlömer, S., mates and country reporting of anthropogenic forest CO2 sinks, von Stechow, C., Zwickel, T., and Minx, J. C., Cambridge Uni- Nat. Clim. Change, 8, 914–920, https://doi.org/10.1038/s41558- versity Press, Cambridge, UK, New York, NY, USA, 2014. 018-0283-x, 2018. Tubiello, F. N.: Greenhouse Gas Emissions Due to Agriculture, in: Grassi, G., Stehfest, E., Rogelj, J., van Vuuren, D., Cescatti, A., Encyclopedia of Food Security and Sustainability, edited by: Fer- House, J., Nabuurs, G., Rossi, S., Alkama, R., Viñas, R. A., ranti, P., Berry, E. M., Anderson, J. R., Elsevier, vol. 1, 196–205, Calvin, K., Ceccherini, G., Federici, S., Fujimori, S., Gusti, M., ISBN 9780128126875, 2019. Hasegawa, T., Havlik, P., Humpenöder, F., Korosuo, A., Perugini, Tubiello, F. N.: FAOSTAT Forest land emissions (version July L., Tubiello, F. N., and Popp, A.: Critical adjustment of land mit- 2020), Zenodo, https://doi.org/10.5281/zenodo.3941973, 2020. igation pathways for assessing countries’ climate progress, Nat. UNFCCC: Canada’s Seventh National Communication on Cli- Clim. Change, accepted, 2021. mate Change and Third Biennial Report—Actions to meet Houghton, R. A. and Nassikas, A. A.: Global and re- commitments under the United Nations Framework Con- gional fluxes of carbon from land use and land cover vention on Climate Change, avaialble at: https://unfccc.int/ change 1850–2015, Global Biogeochem. Cy., 31, 456–472, files/national_reports/national_communications_and_biennial_ https://doi.org/10.1002/2016GB005546, 2017. reports/application/pdf/82051493_canada-nc7-br3-1-5108_ IPCC: IPCC Guidelines for National Greenhouse Gas Inventories eccc_can7thncomm3rdbi-report_en_04_web.pdf (last access: (NGHGI): available at: https://www.ipccnggip.iges.or.jp/public/ March 2021), 2017. 2006gl/ (last access: January 2021), 2006. UNFCCC: The People’s Republic of China Second Biennial Up- IPCC: Summary for Policymakers, in: Climate Change and Land: date Report on Climate Change, available at: https://unfccc.int/ an IPCC special report on climate change, desertification, land sites/default/files/resource/China2BUR_English.pdf (last access: degradation, sustainable land management, food security, and March 2021), 2018a. greenhouse gas fluxes in terrestrial ecosystems, edited by: UNFCCC: Indonesia’s Second Annual Update Report, available Shukla, P. R., Skea, J., Calvo Buendia, E., Masson-Delmotte, at: https://unfccc.int/sites/default/files/resource/Indonesia-2nd_ V., Pörtner, H.-O., Roberts, D. C., Zhai, P., Slade, R., Connors, BUR.pdf (last access: March 2021), 2018b. S., van Diemen, R., Ferrat, M., Haughey, E., Luz, S., Neogi, S., UNFCCC: Brazil’s Third Biennial Update Report, available Pathak, M., Petzold, J., Portugal Pereira, J., Vyas, P., Huntley, at: https://unfccc.int/sites/default/files/resource/2018-02-28_ E., Kissick, K., Belkacemi, M. and Malley, J., Intergovernmental BRA-BUR3_ENG_FINAL.pdf (last access: March 2021), 2019. Panel on Climate Change (IPCC), 2019. UNFCCC: United Nations Framework Convention on Climate Ogle, S. M., Domke, G., Kurz, W. A., Rocha, M. T., Huffman, Change: Time Series – Annex I, UNFCCC, Bonn, available T., Swan, A., Smith, J. E., Woodall, C., and Krug, T.: Delineat- at: https://di.unfccc.int/time_series (last access: January 2021), ing managed land for reporting national greenhouse gas emis- 2020. sions and removals to the United Nations framework conven- tion on climate change, Carbon Balance and Management, 13, 9, https://doi.org/10.1186/s13021-018-0095-3, 2018. https://doi.org/10.5194/essd-13-1681-2021 Earth Syst. Sci. Data, 13, 1681–1691, 2021
You can also read