Further development of exhaust emissions testing - 22/2020 Short version
←
→
Page content transcription
If your browser does not render page correctly, please read the page content below

TEXTE

 22/2020

Further development of
exhaust emissions testing
Short version
TEXTE 22/2020

Environmental Research of the
Federal Ministry for the
Environment, Nature Conservation
and Nuclear Safety

Project No. (FKZ) 37 17 57 1010
Report No. FB000130/KURZ,ENG

Fortentwicklung der Abgasuntersuchung
Short version

by

Frank Schneider
Verband der TÜV e. V., Berlin
Harald Hahn
ASA-Verband, Vaterstetten
Prof. Dr. Wolfgang H. Schulz
IERC GmbH, Meerbusch
Helge Schmidt
TÜV NORD Mobilität GmbH & Co. KG, Essen
Gerhard Wangrin, Manfred Wecking, Fabian Langwald
TÜV Rheinland Kraftfahrt GmbH, Köln
Gerhard Müller
TÜV SÜD Auto Service GmbH, München

On behalf of the German Environment Agency
Imprint

Publisher:
Umweltbundesamt
Wörlitzer Platz 1
06844 Dessau-Roßlau
Tel: +49 340-2103-0
Fax: +49 340-2103-2285
buergerservice@uba.de
Internet: www.umweltbundesamt.de

  /umweltbundesamt.de
  /umweltbundesamt

Study performed by:
VdTÜV
Friedrichstraße 136
10117 Berlin

Study completed in:
August 2019

Edited by:
Section I 2.2 Pollution Abatement and Energy Saving in Transport
Helge Jahn

Publication as pdf:
http://www.umweltbundesamt.de/publikationen

ISSN 1862-4804

Dessau-Roßlau, January 2020

The responsibility for the content of this publication lies with the author(s).
Short version of final report: Further development of exhaust emissions testing

Table of Contents
List of figures..................................................................................................................................................................... 3

List of tables ...................................................................................................................................................................... 3

1         Rationale for this report ......................................................................................................................................... 4
          1.1              Background ........................................................................................................................................... 4

          1.2              Type approval testing ........................................................................................................................... 4

          1.3              Periodic exhaust emissions testing ....................................................................................................... 5
          1.4              Vehicular NOx conversion systems ....................................................................................................... 5

2         Research design and approach .............................................................................................................................. 6

          2.1              ASM2050 (Acceleration Simulation Mode) .......................................................................................... 7

          2.2              On-road testing with mini-PEMS .......................................................................................................... 8

          2.3              Capelec ................................................................................................................................................. 8

3         Execution................................................................................................................................................................ 9
4         Findings .................................................................................................................................................................. 9

          4.1              ASM2050 – Test bench ......................................................................................................................... 9

          4.2              ASM2050 – On-road test with Mini-PEMS ......................................................................................... 10
          4.3              Short on-road test with Mini-PEMS .................................................................................................... 10

          4.4              Conditioning as an important boundary condition ............................................................................ 10

          4.5              Expansion of the standardised OBD data ........................................................................................... 10
          4.6              Vehicle-specific limit values and testing specifications ...................................................................... 11

          4.7              Measurement equipment requirements ............................................................................................ 11

          4.8              Benefit-cost analysis (BCA) ................................................................................................................. 11

          4.9              Legal amendments ............................................................................................................................. 12

5         Appendix .............................................................................................................................................................. 13

          5.1              OBD-PIDs ............................................................................................................................................ 13
          5.2              Measurement results ......................................................................................................................... 13

          5.3              Proposed revisions for the amendment of Directive 2014/45/EU and the Exhaust Emissions
                           Directive.............................................................................................................................................. 16
6         List of references.................................................................................................................................................. 18

                                                                                                                                                                                          2
Short version of final report: Further development of exhaust emissions testing
List of figures
Figure 1: Speed curve over the time for the ASM2050 cycle ........................................................................... 7
List of tables
Table 1: Overview table of all measurement results for ASM2050 cycle ..................................................... 13
Table 2: Overview table of all measurement results for the “short on-road test”....................................... 15
Table 3: Amendment of Directive 2014/45/EU ............................................................................................ 16
3Short version of final report: Further development of exhaust emissions testing
1 Rationale for this report
1.1 Background
Maximum permissible nitrogen oxide (NOx) immission levels are regularly exceeded in Germany, es-
pecially in urban areas. In addition to the threat of infringement procedures brought by the European
Commission, the most heavily polluted cities also potentially face legally mandated driving bans for
diesel vehicles. For the past several months, the media, the general public, and politicians have been
increasingly focused on the issue of ‘exhaust emissions from diesel vehicles’. Increased concentrations
of pollutants in the ambient air result in greater health risks [1]. Among the most harmful pollutant
components emitted by modern diesel vehicles besides diesel particulates are nitrogen oxides (NOx)
[2]. Overall, the transport sector accounts for about 40% of European NOx emissions, about 80% of
which are emitted by diesel vehicles. The high NOx emissions of diesel engines (λ > 1) are caused by
their high temperature peaks during combustion in conjunction with the excess oxygen inherent to
their mode of operation.
Directive 2014/45/EU provides the legal framework for all Member States of the European Union to
conduct periodic technical vehicle inspections. Recital 4 of the Directive allows Member States to de-
fine test criteria of their which go beyond those set out in the Directive. Recitals 7 to 9 recognise that
vehicles with poorly functioning emissions control systems contribute more to pollution than properly
maintained vehicles. Consequently, a system of regular technical monitoring ensures better environ-
mental protection by reducing average vehicle emissions. Furthermore, Member States are urged to
take appropriate measures to prevent tampering which could compromise the required safety-related
and environmental properties of a vehicle. Periodic technical monitoring is assigned particular im-
portance in this context.
Recital 9 of Directive 2014/45/EU effectively provides the underlying mandate for the present re-
search report: “Possibilities for improving test cycles to match on-road conditions should be closely exam-
ined in order to develop future solutions, including the establishment of test methods for the measure-
ment of NOx levels and of limit values for NOx emissions.”
1.2 Type approval testing
Some of the NOx immissions can be explained by comparing exhaust emissions in the type approval
test cycle NEDC (New European Driving Cycle) in the laboratory with actual emissions in on-road traf-
fic. This comparison has established that CO2 emissions and thus fuel consumption are increased by 20
to 40% in on-road operation [3]. The difference is even more pronounced in the case of NOx – and con-
tinues to increase given the ever-stricter emissions guidelines set out in new emissions standards
(EURO classes) [4]. Actual NOx emissions from diesel vehicles have barely improved over the period
from 2000 to 2016, which is also reflected in air quality data.
This is partly due to the NEDC test cycle applied in vehicles up to the EURO 6b emissions standard,
which is hampered by a rather unrepresentative driving profile for driving in road traffic. The lack of
practical test procedures despite ever-stricter limits on CO2 and other pollutant emissions has further
exacerbated the gap between laboratory tests and reality.
To address these issues, regulations for the type approval of new vehicles have been tightened: start-
ing with the EURO 6c standard, vehicles are subject to the emissions limits set out in the WLTP
(Worldwide Harmonised Light Vehicles Test Procedure) test cycle, which covers a significantly broad-
er load and speed range.
In addition, the EURO 6d-Temp emissiona standard also introduced the RDE (Real Driving Emissions)
test procedure – to complement to WLTP bench testing. In this test, emissions limits must be main-
4Short version of final report: Further development of exhaust emissions testing
tained under realistic driving conditions. The test vehicle is fitted with PEMS (Portable Emission
Measurement System) devices, which directly measure the level of pollutants in the exhaust emissions
produced in an on-road driving scenario.
The first diesel vehicles to undergo this RDE test procedure have been on the market since 2018. A
substantial market penetration of these vehicles of around 50% – bringing about a significant reduc-
tion in emissions – is not to be expected until about 2030, given that the average age of the European
vehicle fleet is around 13 years (or around 10 years in Germany). Therefore, this measure will only
have an impact in the longer term.
1.3 Periodic exhaust emissions testing
In addition to the more elaborate emissions measurements conducted during the type approval pro-
cess, periodic exhaust emissions testing plays a crucial role in improving air quality. Its purpose is to
ensure that a vehicle’s exhaust aftertreatment systems remain in working order for the duration of its
life cycle by identifying and, if necessary, remedying any deterioration in a vehicle’s emissions behav-
iour, e.g. due to ageing, wear, or tampering with the exhaust gas aftertreatment system. The primary
focus of exhaust emissions testing is on so-called ‘high emitters’.
Although exhaust emissions testing has undergone continuous development in recent years, it has
been unable to keep pace with developments in modern engine and exhaust gas aftertreatment tech-
nology.
The following stricter national guidelines were established in Verkehrsblatt 19/2017 [7], among oth-
ers:
► As of 01/01/2018: Mandatory measurement of exhaust gas flow (tailpipe measurement)
► As of 01/01/2019: New exhaust gas opacity limit for Euro 6 diesel vehicles: 0.25 m-1
► As of 01/01/2021: Introduction of a procedure for particle number measurement
The first two points have already been implemented. These additional, stricter regulations are de-
signed to improve the informative value of exhaust emissions testing.
For the aforementioned reasons, however, it would appear necessary to integrate the NOx emissions
test into future periodic exhaust emissions testing guidelines.
1.4 Vehicular NOx conversion systems
In the diesel engine combustion process, excess oxygen in combination with a high combustion tem-
perature, results in an increased production of nitrogen oxides (NOx). Since an increased engine load
leads to an increased combustion chamber pressure, and thus a higher combustion chamber tempera-
ture, there is a direct correlation between engine load and nitrogen oxide emissions in the raw exhaust
gas.
Internal engine solutions are designed to reduce the production of NOx during the combustion process,
most prominently exhaust gas recirculation (EGR). With EGR, a defined amount of exhaust gas is recir-
culated and added to the fresh intake air. This causes a reduction in the oxygen content of the air-fuel
mixture in the combustion chamber and lowers the combustion temperature. This effect is supported
by the high heat capacity of the principal components of exhaust gases, carbon dioxide, and water.
Since both pollutants are subject to statutory limits under the type approval framework, exhaust gas
recirculation must be implemented with extreme care.
Exhaust gas recirculation has to be deactivated at high speeds and under full load, otherwise particle
emissions become too high due to a lack of fresh air. As such, the recirculation rate is heavily reliant on
5Short version of final report: Further development of exhaust emissions testing
the operating point. The EGR valve is controlled by the engine control unit, which uses prestored en-
gine maps to optimise performance.
A frequent cause of failure in the EGR system is coking of the EGR valve due to build-up of soot parti-
cles in the recirculated exhaust gas.
However, current exhaust gas limits cannot be met by internal engine-based solutions alone. Exhaust
gas aftertreatment is indispensable. Storage catalysts or SCR catalysts are therefore used to reduce the
nitrogen oxides from raw exhaust gas.
A lean NOx trap (LNT) is a catalytic converter designed to adsorb nitrogen oxides during lean engine
operation. As soon as the maximum adsorption capacity has been reached, the nitrogen oxides are
reduced to nitrogen and water in a short period of rich engine operation. An LNT is less efficient than
an SCR system with an NOx conversion rate of approx. 80% and is therefore mainly used in small cars
where an SCR system would require too much space to install. However, LNTs are not suitable for
meeting future emissions standards [3].
The SCR catalyst currently shows the greatest potential in reducing NOx. Ahead of an SCR catalyst, urea
(AdBlue) is fed into the exhaust tract, where it is converted to ammonia. The SCR catalyst uses the
ammonia to reduce nitrogen oxides to elemental nitrogen and water. The amount of urea must be pre-
cisely dosed in order to prevent the release of unreacted ammonia. Under optimum operating condi-
tions (temperature, engine operating condition, etc.), NOx conversion rates can exceed 90%. On the
other hand, if the operating conditions are not met, the NOx conversion rate is significantly lower. Fur-
thermore, there is an incentive to tamper with the urea injection to cut out the additive (urea) alto-
gether, without which the SCR catalyst has no NOx-reducing effect whatsoever.
2 Research design and approach
In the first step, existing test procedures for measuring NOx emissions were researched. These test
procedures were identified and evaluated. In the next step, test procedures were derived that were
deemed suitable for exhaust emissions testing in Germany.
These test procedures differ in terms of whether an additional load (roller test bench / on-road test) is
applied to the engine – or whether it is only accelerated against the rotational mass (inertia) of the
engine at idling speed while the vehicle is stationary.
Advantages of test procedures with an externally applied load:
► Higher engine loads significantly increase NOx emissions
► Cut-off speed has no effect when idling
Disadvantages of test procedures with an externally applied load:
► Longer test setup times (e.g. securing the vehicle)
► Test equipment is generally more expensive and requires more space (test bench/test track)
► Conducting the tests is generally more time-consuming
The inverse advantages and disadvantages apply to test procedures without an externally applied
load.
The test procedures were compared and evaluated on the basis of various criteria (e.g. purchasing
costs, time requirements, correlation, error rate, acceptance, error indication). Using our own meas-
urements, the function and effect of the best-rated test procedures were then examined to determine
whether and how they are suitable for periodic exhaust emissions testing. The evaluation was based
6Short version of final report: Further development of exhaust emissions testing
on two test procedures with an externally applied load (ASM2050 / road travel with Mini-PEMS) and
one test procedure without an externally applied load (CAPELEC).
The test vehicle used was a Peugeot 308SW (2.0d) with a EURO 6b emissions standard. The primary
NOx-reducing systems, i.e. the EGR and SCR systems, were deliberately tampered with to assess
whether and how reliably the test procedures would be able to detect possible faults: exhaust gas re-
circulation of the exhaust gas was blocked by an orifice plate, thereby suppressing the EGR (EGR er-
ror). The urea injection valve was removed so that urea could no longer be injected into the SCR cata-
lytic converter (SCR error).
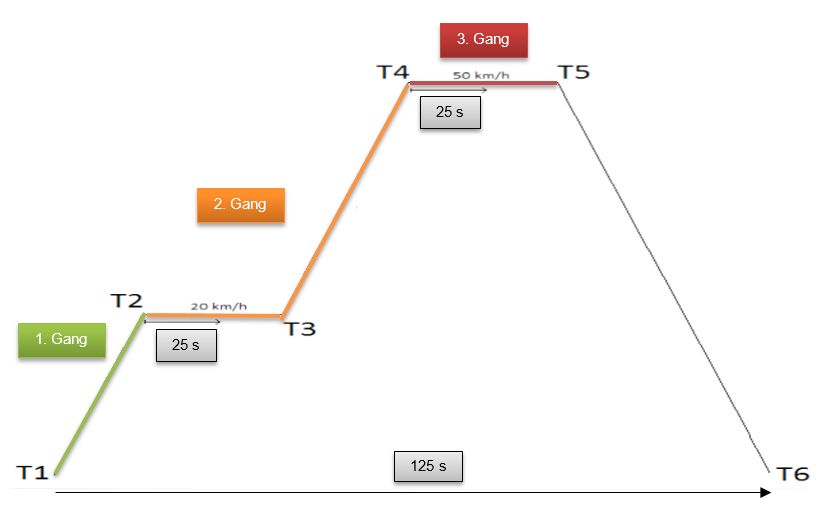
2.1 ASM2050 (Acceleration Simulation Mode)
In the ASM2050 test procedure, a vehicle with a defined is accelerated to 20 km/h and maintains this
speed for 25 seconds. In the next step, the vehicle is accelerated to 50 km/h and maintains this speed
for another 25 seconds. Then the vehicle is brought to a standstill. The speed curve is shown in Figure
1. The nitrogen oxide emissions measured during the respective constant speed phases are used to
calculate the mean value. The first five seconds of each constant speed phase are reserved for stabilisa-
tion. The measurement itself lasts 20 seconds per constant speed phase.
A constant roller load of 50 N, 200 N, and 1000 N was set for the tests in the evaluation phase. It was
found that the built-in fault in the EGR system was clearly identifiable even at a low load. The SCR sys-
tem, on the other hand, requires higher loads until it comes into operation and can be evaluated.
Advantages of the ASM2050:
► Very good fault indication: vehicles with deliberately introduced faults measured four times
higher NOx values than factory condition vehicles [6]
► Relatively low requirements on the test bench
Figure 1: Speed curve over the time for the ASM2050 cycle
Source: Own presentation of the contractors - Association of TÜV e. V., ASA Association, IERC GmbH, TÜV NORD Mo-
bility GmbH & Co. KG, TÜV Rheinland Kraftfahrt GmbH, TÜV SÜD Auto Service GmbH
7Short version of final report: Further development of exhaust emissions testing
2.2 On-road testing with mini-PEMS
So-called mini-PEMS, which use sensors to measure exhaust gas concentrations, are currently in de-
velopment. These devices are much more compact, lighter, and cheaper than the PEMS used for emul-
sion type approval testing. Based on these properties, it is conceivable that mini-PEMS could be used
for periodic exhaust emissions testing. The measurement could be combined with the on-road test
required by the periodic technical inspection (PTI).
Installing the mini-PEMS itself is relatively simple. In order to determine pollutant emissions per kilo-
metre, however, the exhaust gas mass flow must also be determined using an exhaust flow meter
(EFM). The effort required to install an EFM depends on the type and position of the exhaust tailpipe
and can take several hours. Alternatively, an exhaust gas sampling probe can be used to measure only
the NOx volume concentration. This reduces the time required for installation to just a few minutes. It
was found that the determination of the volume concentration was sufficient for the measurement
procedures examined and did not have to be converted to “g/km” as was the case in the type approval
test. Therefore, the mass flow/volume flow of the exhaust gas does not have to be measured.
It was found that there is a good correlation between the mini-PEMS and the PEMS used to measure
exhaust emissions during type approval testing.
The evaluation phase for the mini-PEMS produced the following findings:
► Speed and distance travelled can be measured with sufficient accuracy using a GPS system.
► NOx concentrations can be measured with sufficient accuracy.
► CO2 concentrations can be measured with sufficient accuracy.
► The exhaust gas mass flow can be measured with sufficient accuracy via the signal from the in-
take air sensor and the fuel flow.
► Based on the exhaust concentrations, conclusions can be drawn regarding the condition of the
vehicles. This eliminates the need for a time-consuming installation of an EFM.
► NOx emissions [mg] can be estimated based on NOx to CO2 concentration ratios [%].
► Mini-PEMS is a viable alternative / supplement to the roller test bench.
► Installation of a mini-PEMS is possible with minimum effort (without mass flow measure-
ment).
► A vehicle’s NOx, CO, and particle emissions can be measured by means of a short on-road test.
► Built-in faults are reliably detected.
► The given concentrations are sufficient for the evaluation, a determination of the exhaust gas
mass flow is not compulsory.
► Environmental conditions and vehicle conditioning affect the results.
► OBD data increase reliability during evaluation (e.g. exhaust gas temperature, SCR catalyst
temperature, ambient temperature, AdBlue dosage).
► All-wheel drive vehicles can be tested without additional effort.
2.3 Capelec
The test without external load developed by the electronics manufacturer Capelec uses five criteria to
test the functionality of the EGR valve. The position and function of the EGR valve are determined by
the engine filling ratio. The engine filling ratio p is calculated using OBD data and the combustion
chamber size, which must be entered manually by the person administering the test.
The results of the SCR error show a similar exhaust emissions behaviour as the measurement in facto-
ry condition, as the operating range for urea injection is not reached. Therefore, this method is not
suitable for the evaluation of the exhaust aftertreatment system and was not examined any further.
► Poor fault indication: increase of measured values by a factor of 1.2 [6]
► Only 2 criteria applicable to vehicles with limited cut-off speed
8Short version of final report: Further development of exhaust emissions testing
► Focus on EGR, no informative value for exhaust aftertreatment systems such as the SCR cata-
lytic converter
3 Execution
The evaluation of the procedures found that the functionality of all emissions control systems can only
be reliably tested if an external load is applied to the engine. This is partly due to the aforementioned
relationship between engine load and NOx raw emissions. Another reason is that exhaust aftertreat-
ment systems such as SCR catalytic converters often do not run in the temperature-dependent operat-
ing range when idling and thus cannot be tested for their functionality.
Therefore, in the next step, the ASM2050 was tested and validated using a mini-PEMS both on a roller
test bench and on the road. The validation was carried out with the following test vehicles:
► Peugeot 308 BlueHDi 180 EAT8 GT (2.0d) – Euro 6d-TEMP emissions standard
► Mercedes Benz A-Class 180 – Euro 6d-TEMP emissions standard
► VOLVO XC60 – Euro 6d-TEMP emissions standard
The measurements for the three selected test vehicles were carried out as follows:
► in factory condition (= without pre-installed faults)
► with EGR fault
► with SCR fault
► with EGR and SCR faults
The respective test vehicle was conditioned before each measurement:
► Engine temperature > 80 °C
► SCR catalyst temperature > 200 °C
► No faults stored in the OBD trouble-code memory
At least five ASM2050 cycles were run in succession – with a pause of 10 seconds between the cycles.
The evaluation included the constant runs of cycles 3, 4, and 5. In these cycles, the systems were active
in all measurements and vehicles. All measurement results are summarised in Table 1 in the Appendix.
4 Findings
4.1 ASM2050 – Test bench
Even if only one of the two faults was installed, there was a significant increase in NOx emissions (av-
eraged values from constant runs or peak values). The SCR fault also led to higher emissions values
than the EGR fault. Emissions increased disproportionately if both faults were installed at the same
time. This would suggest that if only one exhaust gas purification system fails, the functioning system
will partially compensate for the failure. Whether the applied load is 500 N or 1000 N only has a minor
impact on the NOx emissions measured at the tailpipe. The increased measured values after installa-
tion of the fault are sufficiently significant at 500 N compared to the original condition to be able to
detect faults. Applying a load of 1000 N does not provide any additional information and therefore
does not appear necessary. The situation is similar with the different speeds of 20 km/h and 50 km/h.
With an existing manipulation, the increased values measured at 20 km/h are already sufficiently sig-
nificant compared to the factory condition to be able to detect faults. Testing at a speed of 50 km/h
does not appear necessary in view of the additional effort involved and the information gained. This
result is independent of whether testing is carried out on the test bench or via a short on-road test.
9Short version of final report: Further development of exhaust emissions testing
4.2 ASM2050 – On-road test with Mini-PEMS
The short on-road tests following the ASM2050 cycle showed very similar results to the simulated
drives on the roller test bench. The installation of a single fault already results in significantly higher
NOx emissions. If both faults are installed at the same time, NOx emissions increase disproportionately.
On-road testing with speeds of 50 km/h do not appear necessary in relation to the additional effort
required and the information gained.
4.3 Short on-road test with Mini-PEMS
In addition to the ASM2050, mini-PEMS were used for the “short on-road test”. A similar behaviour
was observed during this shortened test drive of approx. 10 s and an acceleration to only approx. 20
km/h (with the exception of the Peugeot 308 with an EGR fault) – with sufficient significance for fault
detection. The “short on-road test” provided similar results to the longer ASM2050 cycle.
The short on-road acceleration test needs to be examined in more detail in further studies. The ad-
vantages of an on-road test compared to a bench test are that the actual driving resistances act on the
vehicle and, independent of the drive concept, the test requires no additional effort. Furthermore, ex-
haust emissions testing facilities do not need to find additional space for another roller test bench. On
the other hand, every exhaust emissions testing facility needs to be able to carry out on-road testing
with reasonable effort. The specifications and boundary conditions for such an on-road test must be
precisely defined. With the caveat that only three vehicles were tested, both procedures – bench test-
ing and short on-road testing – are suitable, based on the measured NOx emissions, for testing the op-
eration of the exhaust aftertreatment systems within the framework of periodic exhaust emissions
testing. The installed faults were detected due to increased NOx concentrations.
4.4 Conditioning as an important boundary condition
The NOx concentration measured at the tailpipe depends to a large extent on the NOx conversion effi-
ciency achieved by the SCR catalyst. This efficiency depends on the temperature of the SCR catalytic
converter, which reaches its optimum operating range between approx. 200 °C and 400 °C. The tem-
perature of the SCR catalyst must therefore be within this temperature range during the measurement.
It should be noted that the measurement must be started immediately after conditioning, as the SCR
catalyst cools down very quickly when idling. If the temperature is too low, significantly increased NOx
emissions are measured although the SCR system is not defective. This finding shows that it is neces-
sary to specify the correct conditioning for the vehicle.
It must also be possible to identify circumstances which might prevent the successful application of
exhaust emissions testing, e.g. during the regeneration phase of the diesel particulate filter. In addition,
information on the system concept of the exhaust aftertreatment is required in order to identify any
conditions in which the systems may be partially or fully deactivated (e.g. low ambient temperatures).
The vehicle must be verifiably rendered ready for testing in order to reduce the possibility of misin-
terpreting the results. Correct conditioning of the vehicle is essential for transparent and reproducible
measurement.
4.5 Expansion of the standardised OBD data
The on-board diagnostics (OBD) system stores important information (e.g. urea injection quantity, SCR
catalyst temperature, EGR valve activity) on the condition of a vehicle. These data also need to be ana-
lysed when testing the conditioning parameters of the systems (e.g. catalyst temperature). The current
10Short version of final report: Further development of exhaust emissions testing
OBD standard SAE J 1979 provides for many data which would allow for more efficient and targeted
exhaust emissions testing. An overview of the required parameters (PID) is provided in the Appendix.
For this purpose, the OBD system must grant access to the necessary data, as is common practice for
diagnostic devices in workshops. OBD could also be used to detect vehicle conditions during which
exhaust emissions testing cannot be carried out, e.g. during the regeneration phase of the diesel par-
ticulate filter.
In addition, the currently valid software version must be compared with the software version available
in the vehicle, e.g. to detect any tampering with the electronics.
4.6 Vehicle-specific limit values and testing specifications
The three vehicle types studied in this research project each have different exhaust aftertreatment
concepts and engines. However, in order to statistically secure the information gained, it is necessary
to increase the sample size. After all, it was found that the absolute NOx emissions of the three vehicles
studied were already very different. Compilation of suitable benchmark data during type approval
testing would therefore be very useful in the evaluation of NOx concentrations of diesel vehicles within
the framework of periodic exhaust emissions testing. A definition of the appropriate test, including the
collection of data for technical monitoring, would have to be included in the European regulations for
exhaust emissions type approval testing. In addition to the measured NOx concentrations, the condi-
tions that need to be taken into account in technical monitoring, e.g. the engine temperature and the
temperature at the SCR catalytic converter, also need to be determined. Type-specific limit values
could be used for periodic exhaust emissions testing to evaluate the NOx concentrations in vehicles
with compression ignition engines. General limit values would also need to be defined, but should only
be applied in the absence of type-specific values.
4.7 Measurement equipment requirements
In some tests, NOx concentrations were measured that were within the range of permissible measure-
ment errors. Regulation (EU) 2017/1151 specifies for the Type 1 test: „If not defined otherwise, meas-
urement errors shall not exceed ± 2 per cent (intrinsic error of analyser) disregarding the reference value
for the calibration gases.” In other words, the permissible measurement error depends on the measur-
ing range used. The use of suitable measurement equipment must therefore be ensured for measuring
NOx concentrations in these orders of magnitude. Currently, analysers with measurement ranges of
10 ppm or 3 ppm are available for laboratory use.
4.8 Benefit-cost analysis (BCA)
As part of the economic analysis, a benefit-cost analysis (BCA) should be used to determine whether
the modified exhaust emissions test is beneficial from a macroeconomic point of view. The BCA is an
established procedure for assessing the use of public funds or the implementation of regulatory
measures. It is also designed to ensure that the measures will definitely improve social welfare. A ben-
efit-cost ratio (BCR) is calculated. If the BCR is greater than 1, the use of public funds or the implemen-
tation of regulatory measures is deemed desirable from a social point of view. If it is less than 1, spend-
ing should be stopped, and regulatory measures should not be implemented. Exhaust emissions test-
ing is a regulatory measure because it acts as a market control mechanism (= technical verification
that NOx emissions limit values are actually met). In order to determine the benefit-cost ratio for fu-
ture exhaust emissions tests, it is necessary to determine both the economic costs of carrying out ex-
haust emissions testing and the economic benefits resulting from reduced NOx emissions. The viability
threshold for a measure is a benefit-cost ratio greater than 1. A benefit-cost ratio greater than 3 is con-
11Short version of final report: Further development of exhaust emissions testing
sidered excellent. In order to investigate the benefits of exhaust emissions testing for diesel passenger
cars with Euro 6d-TEMP, the number of diesel passenger cars that have to be regularly inspected from
2024 onwards was first determined. A fault ratio of 1% was assumed for EGR faults, SCR faults, or EGR
and SCR faults. Furthermore, the amount of additional NOx emissions released due to faults in the cata-
lytic converters was calculated. The emissions measurements carried out within the framework of this
project were used for this purpose. In order to determine the economic costs, the personnel costs re-
sulting from the time spent on exhaust emissions testing were calculated. Furthermore, the investment
costs for the measurement equipment were calculated. Overall, an average BCR of 3.7 was calculated
for the testing period from 2024 to 2033.
Therefore, introducing exhaust emissions testing will result in significant positive macroeconomic
effects and an excellent BCR. However, it should be noted that this project broke new ground both the-
oretically and empirically, so that a number of assumptions had to be made. Although these assump-
tions were deemed plausible, they may still be subject to critical interrogation. It was therefore exam-
ined how sensitively the benefit-cost analysis reacts to changes in important input variables. For this
purpose, so-called reaction elasticities were calculated to determine the effect of, for example, a varia-
tion in the distance travelled by a defective vehicle, the time required to carry out exhaust emissions
testing, the personnel costs, or the investment costs for the measurement equipment. It was found that
partial changes in time requirements, personnel costs and equipment costs only have a disproportion-
ately low effect on the BCR. If all three variables were to increase by 10% at the same time, the BCR
would decrease from 3.7 to 3.3, which is still an excellent value. If the number of kilometres travelled
with a fault in the exhaust aftertreatment system is reduced by 10%, the BCR is reduced by 9.7%, but
is still greater than 3.
Overall, the BCR shows that the introduction of exhaust emissions testing is desirable from a macroe-
conomic point of view. The sensitivity analysis also confirms a high stability of the benefit-cost ratio
against changes in important input variables. However, the main limitations are that it is difficult to
predict how the diesel passenger car population with Euro 6d will continue to develop.
The research report clearly shows that the addition of the air pollutant NOx to the exhaust emissions
testing measurement programme using the aforementioned measurement procedures is fundamental-
ly feasible in terms of measurement technology and makes sense from a macroeconomic point of view.
The present measurement programme was exclusively designed to develop a technically feasible
measurement procedure. The measurement results show that the measurement must be carried out
under load – either on a roller test bench or via an on-road test. However, further studies are needed
to statistically secure this procedure.
According to an estimate, the future price for exhaust emissions testing of diesel vehicles (consisting of
PN and NOX measurements, including the additional equipment costs of approx. €1.90) would increase
by approx. €12.80 (incl. VAT). As a result, the vehicle owner would have to pay an additional €6.40 per
year (incl. VAT).
4.9 Legal amendments
The revision proposals for Directive 2014/45/EU and the German exhaust emissions guideline can be
found in the Appendix in Table 3.
12Short version of final report: Further development of exhaust emissions testing
5 Appendix
5.1 OBD-PIDs
The OBD-PIDs listed below are already included in the SAE J 1979 standard and should be accessible in
a standardised readable format in the future:
PID 01 Readiness codes (non-continuous)
bit 1 (NOx), bit 5 (exhaust gas sensor monitoring), bit 6 (PM filter monitoring), and bit 7 (EGR
system monitoring)
PID 2C Commanded EGR (EGR rate)
PID 2D EGR Error
PID 78/79 Exhaust Gas Temperature (EGT) Bank 1/2
PID 7A/7B Diesel Particulate Filter Pressure (DPF) Bank 1/2
PID 7C Diesel Particulate Filter Temperature (DPF)
PID 7D NOx NTE Control Area Status
PID 7E PM NTE Control Area Status
PID 83 NOx Sensor (supported and concentration)
PID 85 NOx Control System (information about Reagent)
PID 86 Particulate Matter Sensor (PM)
PID 88 SCR Inducement System Actual State
PID 8B Diesel Aftertreatment System
PID 8F Particulate Matter Sensor Output
5.2 Measurement results
Table 1: Overview table of all measurement results for ASM2050 cycle
Load [N] Fault NOx constant MV FI constant MV NOx constant MV FI constant MV
20 km/h [ppm] 20 km/h 50 km/h [ppm] 50 km/h
Peugeot 308
500 Factory 9.26 1.00 17.25 1.00
500 AGR 16.62 1.80 24.90 1.44
500 SCR 35.20 3.80 54.66 3.17
500 AGR+SCR 128.52 13.88 199.93 11.59
1000 Factory 4.45 1.00 8.74 1.00
1000 AGR 10.97 2.46 9.43 1.08
1000 SCR 47.21 10.61 113.40 12.97
1000 AGR+SCR 207.54 46.62 327.93 37.52
13Short version of final report: Further development of exhaust emissions testing
On-road Factory 7.30 1.00 12.17 1.00
On-road AGR 6.68 0.92 5.97 0.49
On-road SCR 75.82 10.39 129.22 10.61
On-road AGR+SCR 194.06 26.60 225.14 18.49
Mercedes A180d
500 Factory 0.01 1.00 0.04 1.00
500 AGR 1.62 144.32 5.32 132.57
500 SCR 3.55 316.96 5.06 126.16
500 AGR+SCR 32.85 2934.06 62.92 1569.21
1000 Factory 0.02 1.00 0.03 1.00
1000 AGR 5.41 357.21 10.75 331.22
1000 SCR 3.17 208.91 12.26 377.94
1000 AGR+SCR 51.70 3411.00 140.63 4333.91
On-road Factory 0.25 1.00 2.35 1.00
On-road AGR 9.78 39.04 27.00 11.49
On-road SCR 24.23 96.70 40.37 17.18
On-road AGR+SCR 153.85 613.94 284.95 121.22
VOLVO XC60
500 Factory 0.22 1.00 0.33 1.00
500 AGR 0.36 1.60 1.89 5.68
500 SCR 1.30 5.88 5.24 15.72
500 AGR+SCR 3.72 16.81 27.03 81.16
1000 Factory 0.33 1.00 0.79 1.00
1000 AGR 3.37 10.37 9.88 12.52
1000 SCR 5.73 17.63 19.48 24.67
1000 AGR+SCR 24.50 75.33 92.39 117.05
On-road Factory 0.57 1.00 4.07 1.00
On-road AGR 16.27 28.57 55.05 13.52
On-road SCR 34.16 59.99 57.95 14.23
On-road AGR+SCR 87.85 154.25 132.43 32.52
14Short version of final report: Further development of exhaust emissions testing
Table 2: Overview table of all measurement results for the “short on-road test”
Test Fault Mean NOx [ppm] Peak NOx [ppm] Error factor
Mean value NOx
Peugeot 308
1 Series 9.65 17.94
2 Series 9.23 19.57
3 Series 10.53 24.11
Mean Series 9.80 20.54 1.00
1 AGR 10.68 21.14
2 AGR 10.52 35.23
3 AGR 12.37 37.18
Mean AGR 11.19 31.18 1.14
1 SCR 115.12 189.34
2 SCR 117.44 177.78
3 SCR 110.30 180.32
Mean SCR 114.29 182.48 11.66
1 AGR+SCR 208.42 365.19
2 AGR+SCR 216.26 364.82
3 AGR+SCR 205.52 421.78
Mean AGR+SCR 210.07 383.93 21.43
Mercedes A180d
1 Series 0.93 5.46
2 Series 1.45 7.19
3 Series 3.70 17.52
Mean Series 2.03 10.05 1.00
1 AGR 13.25 46.41
2 AGR 9.66 45.63
3 AGR 35.91 121.37
Mean AGR 19.61 71.13 9.67
15Short version of final report: Further development of exhaust emissions testing
1 SCR 104.39 317.13
2 SCR 93.81 203.87
3 SCR 114.00 266.63
Mean SCR 104.07 262.54 51.32
1 AGR+SCR 252.44 812.41
2 AGR+SCR 268.73 859.75
3 AGR+SCR 272.04 858.40
Mean AGR+SCR 264.40 843.52 130.40
5.3 Proposed revisions for the amendment of Directive 2014/45/EU and the Ex-
haust Emissions Directive
Table 3: Amendment of Directive 2014/45/EU
Item Method Reason for failure Assessment of deficiencies
8.2.2.3 NOx For vehicles as of emission NOx concentration exceeds Minor Major Dan-
Measurement class Euro 6d-TEMP: the value specified by the gerous
NOx concentration to be manufacturer. X
measured under load with a If this value is not applica-
force of at least 500 N and a ble/available:
speed of 20 km/h. NOx concentration exceeds
the value of (40) ppm
Alternatively, a short on-
road test may be carried out
with an acceleration to 20
km/h and subsequent decel-
eration to 0 km/h (1st gear).
1. Vehicle preconditioning:
The engine shall have
reached the full operating
temperature of at least
80 °C. The SCR catalyst shall
have reached the operating
temperature as per the
manufacturer’s specifica-
tions. NOx test readiness
indicated (EOBD Mode 1 –
readiness code). Measure-
ment to be carried out im-
mediately (avoid cooling).
2. Test procedure:
Measurement of the NOx
16Short version of final report: Further development of exhaust emissions testing
concentration using suitable
measurement equipment
under load with a force of at
least 500 N and 20 km/h (0-
20 km/h in 15 s, 25 s con-
stant, 20 km/h to 0 in 15 s)
or alternatively:
Short on-road test with ac-
celeration from 0 to 20 km/h
(approx. 3 s constant
20 km/h) and deceleration to
0 km/h (corresponds to a
measuring distance of ap-
prox. 40 m)
The test shall only be con-
sidered failed if the arithme-
tic mean of at least three
measurement cycles exceeds
the limit value. When calcu-
lating this value, measure-
ments that deviate signifi-
cantly (> 30 %) from the
averaged measured value or
the result of other statistical
calculations which take into
account the dispersion of the
measurements shall be dis-
regarded.
Member States may place
limits on the number of test
cycles to be carried out.
To avoid unnecessary test-
ing, Member States may
decide that a vehicle with
measured values significantly
below the limit (< 30 %) after
less than three measure-
ment cycles has passed the
test.
To adapt/amend the German exhaust emissions guideline, an adaptation proposal for NOx measure-
ment is made below. The exhaust emissions guideline should be amended to include the performance
test “exhaust gas with NOx measurement”:
Performance test with NOx measurement (for vehicles as of Euro 6dtemp)
17Short version of final report: Further development of exhaust emissions testing
► Vehicle conditioning:
1. Coolant temperature at least 80 °C
2. Determine NOx test readiness by reading the readiness codes (NOx supported and exe-
cuted)
3. Carry out NOx measurement immediately after conditioning, avoid cooling, immediate-
ly drive onto the test bench without switching off the engine or taking a short drive
► Place vehicle on test bench and execute test cycle (with 500 N load, 20 km/h)
1. Accelerate the vehicle from 0 to 20 km/h (within 15 s)
2. Maintain a constant speed of 20 km/h for 25 s
3. Then decelerate from 20 km/h to 0 km/h within 15 s
4. Wait 15 s
► Evaluation test cycle – load roller
1. 5 s after reaching the test speed of 20 km/h, begin NOx measurement and calculate
mean over 20 s
► If no test bench is available, the measurement may also be carried out via a short on-road test
1. Accelerate the vehicle from standstill to 20 km/h (in max. 5 seconds)
2. Maintain speed at 20 km/h for approx. 3 s
3. Then reduce vehicle speed down to 0 km/h
► Evaluation test cycle – short on-road test
1. Begin NOx measurement immediately after the acceleration of the vehicle and calculate
mean over the entire movement cycle of the vehicle
► Repeat test cycle until the last three test cycles are within a range of +/- 20% (or a fixed value
of e.g. 10 ppm) of the mean of the three test cycles
► Evaluation overall result
1. Calculate the mean of the last three test cycles
2. Result < manufacturer value OK
3. Result > manufacturer value not OK
4. If manufacturer value unavailable, NOx limit value 40 ppm
6 List of references
[1] Umweltbundesamt [German Environmental Agency]. (2017). Wirkungen auf die Gesundheit [Effects on
health]. Accessed on 01/11/2017 at https://www.umweltbundesamt.de/themen/luft/wirkungen-von-
luftschadstoffen/wirkungen-auf-die-gesundheit.
[2] Landesanstalt für Umwelt, Messungen und Naturschutz Baden-Württemberg [Baden-Württemberg Sta-
te Institute for the Environment, Survey and Nature Conservation]. Wirkungen auf den Menschen [Effects
on humans]. Accessed on 01/11/2017 at https://www4.lubw.baden-wuerttemberg.de/servlet/is/18796/.
[3] Yang, L., Franco, V., Campestrini, A., German, J. & Mock, P. (2015). NOX control technologies for Euro 6
Diesel passenger cars: Market penetration and experimental performance assessment. ICCT 2015, Interna-
tional Council on Clean Transportation, Neue Promenade 6, 10178 Berlin.
[4] Tietge, U., Diaz, S., Mock, P., German, J., Bandivadekar, A., Ligterink, N. (2016). From laboratory to road.
A 2016 update of official and ‘Real-world’ fuel consumption and CO2 values for passenger cars in Europe.
White Paper ICCT November 2016. Accessed on 02/11/2017 at https://cleantechnica.com/2016/11/21/icct-
average-gap-official-fuel-consumption-figures-actual-fuel-use-eu-hit-42/.
[5] European Environment Agency. (2016). Explaining road transport emissions: A non-technical guide. Ac-
cessed on 02/11/2017 at https://www.eea.europa.eu/publications/explaining-road-transport-
emissions/at_download/file.
18Short version of final report: Further development of exhaust emissions testing
[6] CITA International Motor Vehicle Inspection Committee. (2017). CITA SET II Project: Sustainable Emis-
sions Testing.
[7] Bundesministerium für Verkehr und digitale Infrastruktur [Federal Ministry of Transport and Digital Inf-
rastructure]. (2017). Verkehrsblatt [Transport gazette] 19/2017.
19You can also read