Containerized SQL Server Performance Testing - Diamanti Enterprise Kubernetes Platform, AWS Elastic Kubernetes Service, & Azure Kubernetes Service
←
→
Page content transcription
If your browser does not render page correctly, please read the page content below

Containerized SQL Server
Performance Testing
Diamanti Enterprise Kubernetes Platform,
AWS Elastic Kubernetes Service,
& Azure Kubernetes Service

                                              Prepared by:

                                 McKnight Consulting Group
                                     www.mcknightcg.com
                                              January 2021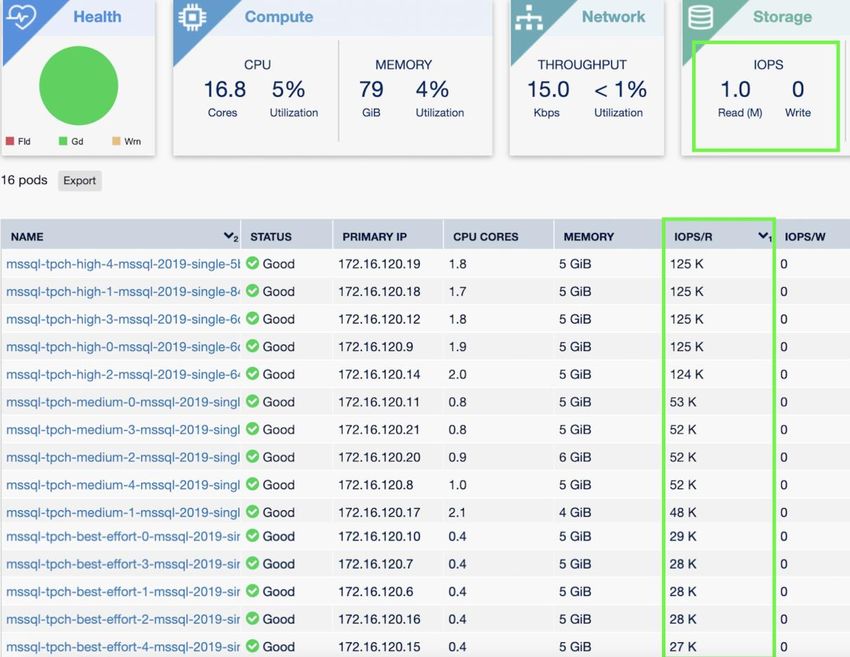
Containerized SQL Server Performance Testing

Contents
Executive Summary ...................................................................................................................3
Introduction ...............................................................................................................................7
Container Platform Offerings ....................................................................................................8
   Diamanti Enterprise Kubernetes Platform ............................................................................... 9
   Amazon Web Services Elastic Kubernetes Service ................................................................ 10
   Azure Kubernetes Service ........................................................................................................ 11
Test Setup ................................................................................................................................. 13
   Test Components ...................................................................................................................... 13
Success Criteria ........................................................................................................................ 18
   Execution Times ....................................................................................................................... 18
   Price-Performance ................................................................................................................... 18
Test Results .............................................................................................................................. 19
   Execution Times ....................................................................................................................... 19
   Explanation ............................................................................................................................... 22
   Quality of Service Testing........................................................................................................ 25
Price-Performance ................................................................................................................... 27
Conclusion ............................................................................................................................... 35
About Diamanti ....................................................................................................................... 36

Copyright McKnight Consulting Group. Not to be reproduced in whole or in part without
permission. For reproduction, contact McKnight Consulting Group. All rights reserved.

McKnight Consulting Group ©2021                                                                                                  2
Containerized SQL Server Performance Testing

Executive Summary

Containerization has trended among IT departments and digitally-transformed organizations
for the past several years. Just as virtualization revolutionized conventional bare metal
infrastructure, containerization has propelled both how infrastructure is leveraged and
application development operations (DevOps) are conducted. Much could be written about
the benefits of containerization—readers of this report are already convinced that utilizing
containers for their environments is a good idea.

However, one of the questions- that continues to be heavily debated among CIOs, security
professionals, and developers is whether or not the cloud is the best route. From subscription
or consumption-based pricing models to security, availability, and performance, many IT
organizations have or still wrestled with this decision. Some have fully adopted public cloud
services, some remain staunchly on-premise, while others set out to build their own private
clouds. Most land somewhere in between with a hybrid cloud architecture with varying
mixtures of on-premise, public cloud, and private cloud.

A question we hope to address is how does containerization affect the choice of
infrastructure? Looking at the use-cases for containers, they are certainly pluses and minuses
for any architectural pattern. These use-cases include, but are not limited to:

   ● Simplifying the deployment and management of API and microservice-based
       applications and databases
   ● Scaling applications up and down to balance cost with user demand and business
       requirements
   ● Streamlining continuous improvement and continuous development (CI/CD)
       pipelines
   ● Deploying Internet of Things (IoT) applications and devices to collect and stream data
All of these use cases are certainly applicable to both on-premise and in the cloud. Along
with security, high availability, and disaster recovery, either approach (or a hybrid in
between) can certainly check all the requisite boxes if well planned and designed. Of course,
you have to make careful infrastructure choices to avoid being saddled with a solution that is
overly complex and difficult to manage, will not reach the scaling requirements of the
business today and tomorrow, or locks you into a specific vendor or cloud environment.

But what about performance? When running containerized databases with Kubernetes, the
performance characteristics of the platform are critical. High-performance database
workloads—particularly SQL Server—depend on network and storage I/O and should run on
the fastest storage media possible, with the ability to allocate different performance levels to

McKnight Consulting Group ©2021                                                        3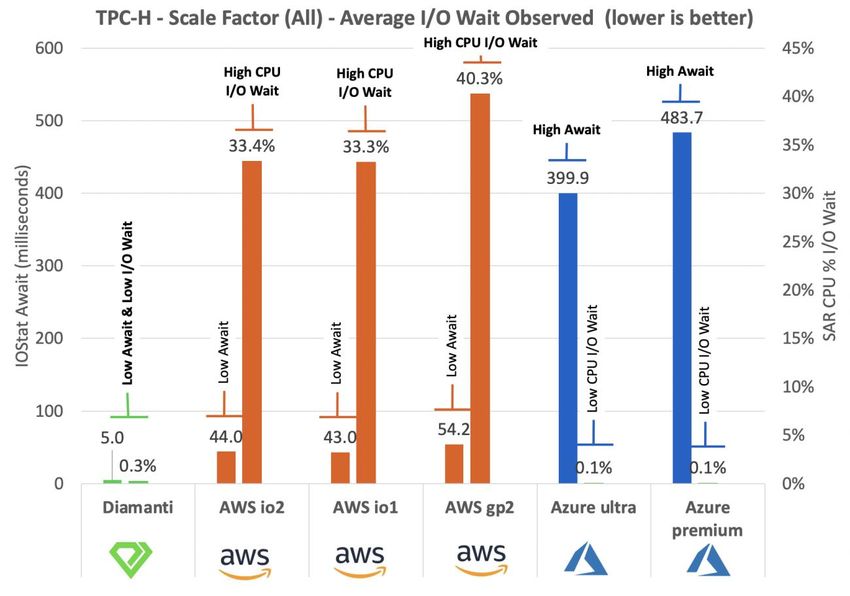
Containerized SQL Server Performance Testing

different database instances. The Kubernetes platform must be highly resilient with no single
points of failure or performance bottlenecks.

This paper provides insights on this key selection criterion—performance. This report
focuses on the performance of containerized relational databases, because deployments are at
an all-time high and poised to expand dramatically. While we discuss some of the features
and advantages of our tested platforms, we ended up comparing the performance of a
database pod deployed on Kubernetes clusters on these platforms:

 Hybrid Cloud         Diamanti Enterprise Kubernetes Platform

                      Amazon Web Services Elastic Kubernetes Service (AWS EKS)
 Cloud Only
                      Azure Kubernetes Service (AKS)

Overall, the test results were insightful in revealing query execution performance of these
platforms. At the TPC-H scale factor of 100 and 32 concurrent users, Diamanti was between
4x and 12x faster than AWS Kubernetes Service. Diamanti was also between 4x and 6x faster
than Azure Kubernetes Service.

At TPC-H scale factor 300, not all platforms could complete the workload successfully with
32 concurrent users. Azure with Ultra disks did not complete with 32 users and Azure with
Premium disks did not complete with 16 or 32 users due to SQL Server errors, so the lowest
common denominator for platforms tested was 8 concurrent users. At this level, Diamanti
was 6.5x times faster than AWS with their best io1 or io2 volumes running on Nitro based
instances. Diamanti was between 4x and 6x faster than Azure with either their best Ultra
disk or mid-performance range Premium Managed disk. We did not even test AWS with gp2
volumes because the build of the database would have taken over 3 days to complete.

McKnight Consulting Group ©2021                                                      4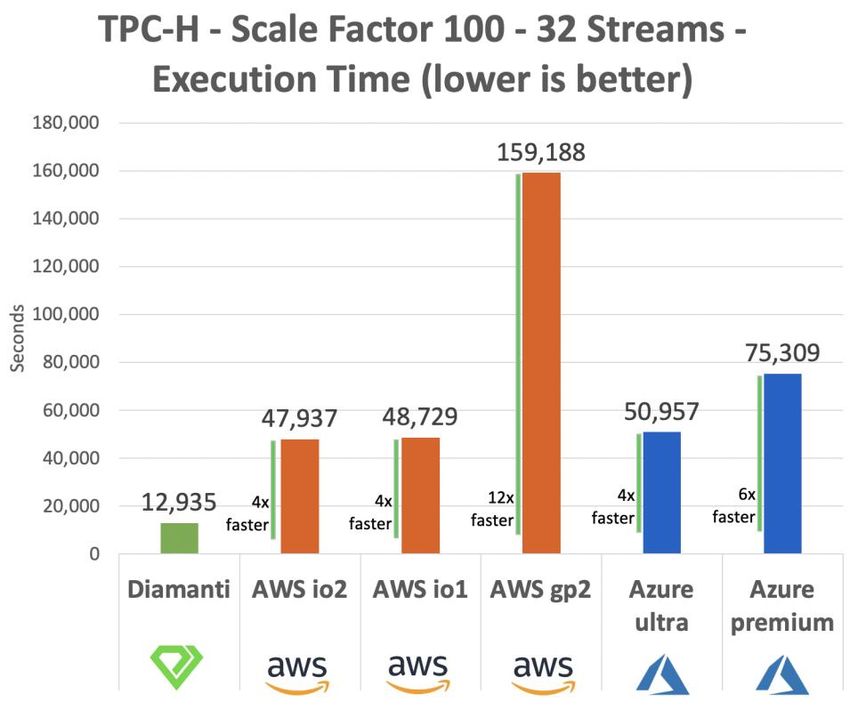
Containerized SQL Server Performance Testing

We used the TPC-H formula to calculate the relative value—performance per dollar spent—
of each of the test platforms. In terms of price per performance as a scale factor of 100,
Diamanti turned out 4x and 8x cheaper than AWS Kubernetes Service and between 2x and
11x cheaper than Azure Kubernetes Service. At a scale factor of 300, Diamanti was 13x

McKnight Consulting Group ©2021                                                     5
Containerized SQL Server Performance Testing

cheaper than AWS using their best io1 and io2 disks running on Nitro based instances and
10x cheaper than Azure using its best Ultra disk.

McKnight Consulting Group ©2021                                                     6
Containerized SQL Server Performance Testing

Introduction

Performance is important. However, it is only one of the criteria for a database platform
selection. There are numerous factors to consider in selecting across factors of
administration, integration, workload management, user interface, scalability, vendor,
reliability, and cloud among other criteria. It is also our observation that performance
changes over time and is dependent on workload type.

McKnight Consulting Group (MCG) runs all of its performance tests to strict ethical
standards. The results of the report are the objective and unbiased results of the application
of queries to the simulations described in the report. The report clearly defines the selected
criteria and process used to establish the field test. The report also clearly states the data set
sizes, the platforms, the queries, etc. that were used. The reader is left to determine for
themselves how to qualify the information for their individual needs. The report does not
make any claims regarding third-party certification and presents the objective results
received from the application of the process to the criteria as described in the report. The
report strictly measures performance and does not purport to evaluate other factors that
potential customers may find relevant when making a purchase decision.

This is a sponsored report. Diamanti chose its configuration, while MCG chose the test,
configured the database and testing application, and ran the tests. MCG also chose the most
compatible configurations for the other tested platforms. Choosing compatible configurations
is subject to judgment.

In this writeup, the information necessary to replicate this test is included. Readers are
encouraged to compile their own representative configuration and test it for themselves.

McKnight Consulting Group ©2021                                                          7
Containerized SQL Server Performance Testing

Container Platform Offerings

Containerization has transformed for applications how they are developed, deployed, and
managed. By packaging up only the business logic and software of the application required
for the functioning of the app, containers create decoupled functional layers. Containers
share the underlying operating system and often common libraries, frameworks, or other
pieces of software. This resulted in much lighter applications (containers are usually
megabytes in size, compared to the gigabytes with a typical virtual machine image) that are
cleanly decoupled from the layer underneath.

This decoupling creates a number of benefits for utilizing containers:

   ● A container can be deployed on different clusters, hosts, clouds, or on-premise
       without any change to the container or its definition.
   ● The application is decoupled from the operating system underneath, making it
       simpler to maintain the underlying layers and commoditizing it for developers.
   ● Container decoupling allows easier and automated updating, changing, upgrading,
       and patching of the application and layers underneath.
   ● When it is time to update a containerized application, a new container with the new
       version is deployed, and traffic is diverted to that new container. The old one is killed
       as soon as the new container is operating correctly.
   ● Containerization creates an immutable infrastructure with a distinct separation
       between the application, operating system, and the underlying infrastructure.
   ● From a DevOps perspective, containers allow different teams to take ownership and
       responsibility for each layer, giving developers latitude to deploy new versions of
       their applications without intervention from the teams managing the infrastructure.
   ● Also, rollbacks of a faulty release are also simplified without impacts or dependencies
       on the infrastructure or operations teams.
In addition to the benefits of using containers from a DevOps and Continuous
Integration/Continuous Development (CI/CD) perspective, there is an ever-increasing need
for performance; moreover, for today’s applications being able to keep pace with the speed of
the business’s needs. The fundamental underpinning of an organization is its transactions. It
must do them well, with integrity and performance. Not only has transaction volume soared
of late, but the level of granularity in the transaction details has also reached new heights.
Fast transactions greatly improve the efficiency of a high-volume business. Performance is
incredibly important in a container-based architecture, just the same as in a conventional
bare metal or virtualized machine environment.

McKnight Consulting Group ©2021                                                        8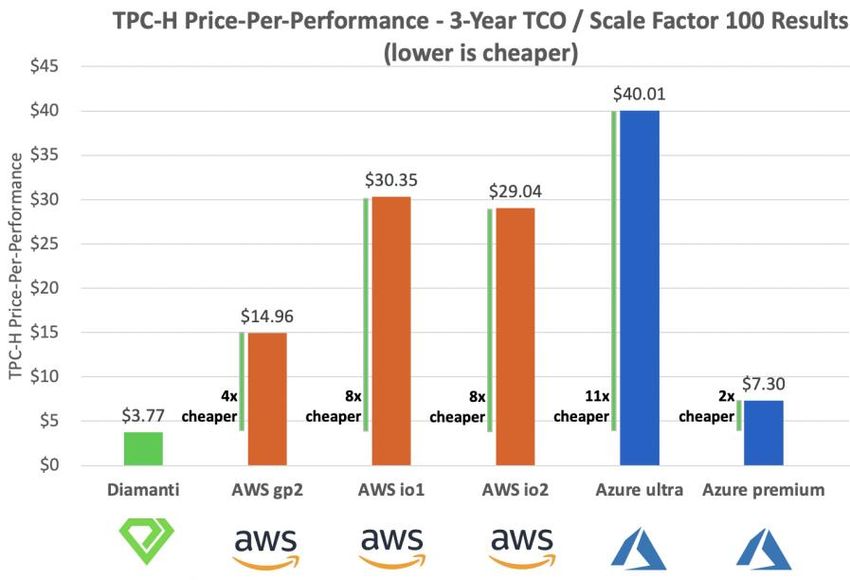
Containerized SQL Server Performance Testing

Thus, we have endeavored to conduct performance testing of containerized databases. This
report outlines the results from testing derived from the industry-standard TPC
Benchmark™ H (TPC-H) to compare the performance of a database pod deployed on
Kubernetes clusters on following platforms:

   ● Diamanti Enterprise Kubernetes Platform
   ● Amazon Web Services Elastic Kubernetes Service (AWS EKS)
   ● Azure Kubernetes Service (AKS)
All these platforms provide mechanisms to control the underlying physical storage layer, so
container developers and operators do not need to know how the physical storage is
managed. These individuals only need to define Persistent Volume Claims (PVC) and the
Persistent Volumes (PV) within pods. However, despite this similarity, there are some
distinct differences in the platforms themselves, their architectures, and their features.

Diamanti Enterprise Kubernetes Platform
Diamanti seeks to solve the challenge of container-based hybrid clouds with powerful
enterprise-grade platforms for managing Kubernetes at scale. Out of many differentiating
features of Diamanti Kubernetes platform, one which stands out most in terms of SQL server
deployment is integrated container-native storage plane that offers high-performance NVMe
storage, hardware-level synchronous replication, quality of service guarantees across
performance tiers, multiple availability zone support for high availability (HA), Data
protection services and disaster recovery (DR).

Diamanti offers a full-stack solution for Kubernetes including Diamanti Spektra as a hybrid
cloud management plane, Diamanti Ultima as a hybrid cloud data plane. Diamanti also offers
to offload various capabilities of Diamanti Ultima to an acceleration card “Diamanti Ultima
Offload”, which is a PCI based card to offload networking, storage, security and
management. This card is the secret sauce behind the impeccable performance of Diamanti
platform in on-premises and edge scenarios. The card is compatible with various OEM
hardware from Dell, Intell and Lenovo.

For this benchmarking, we used another offering from Diamanti, D20 platform which is a
full-stack hyper-converged appliance and contains essentially everything an enterprise
customer needs to run on-premises Kubernetes based cloud. Plug and play approach allows
developers and administrators to focus on running and managing applications instead of
underlying infrastructure and performance. It comes with pre-integrated upstream
Kubernetes and Integrated storage and networking offload to deliver the performance
necessary for demanding production database environments. Diamanti offload also brings the
added advantage of quality of service (QoS) for storage and networking, in addition to CPU
and memory QOS provided by Kubernetes:

McKnight Consulting Group ©2021                                                      9
Containerized SQL Server Performance Testing

   ● Eliminates the “noisy neighbor” phenomena present in public clouds or any shred
       infrastructure
   ● Provides isolation at the PCIe layer
   ● Integrates with Kubernetes storage classes
   ● Customizable performance tiers
Diamanti Enterprise Kubernetes Platform is Kubernetes certified. The platform provides
storage via a standard container storage interface (CSI) plugin and networking via a standard
container network interface (CNI) plugin, delivering low-latency access to both storage and
network resources on bare-metal appliances using hardware offload and acceleration.
Diamanti comes with built-in enterprise-grade data services, which are important for data
centric applications like Microsoft SQL server. Built-in high availability with DR/DP
capabilities eliminates single points of failure. Following are some additional noteworthy
features:

   ● Mirroring across nodes and zones
   ● A backup controller for snapshot-based backups
   ● DR and migration capability across the zones and regions
   ● Isolation of storage traffic for data services using NVMoF
   ● Secure Volumes, SED and built-in KMS
   ● Offering support for stretched and campus clusters across zones
   ● Intelligent pod scheduling based on networking, storage and zones to assure optimal
       performance
Additionally, a modern user interface (UI) offers single-click simplicity makes it easy to add
resources on demand, as well as monitor the health and performance of pods, stateful sets,
nodes, storage, and network.

Amazon Web Services Elastic Kubernetes Service
Kubernetes is available on Amazon Web Services (AWS) in a variety of deployment options.
First, there is a self-managed deployment on Elastic Cloud Compute (EC2) instances using
automated tools, such as kOps, or completely built from the ground up. Second, AWS also
offers Amazon Elastic Kubernetes Service (Amazon EKS), which is a fully managed
Kubernetes service.

With Amazon EKS, it is possible to run Kubernetes clusters in a serverless environment using
AWS Fargate. Fargate removes the need to provision and manage servers, and organizations
pay for resources per application. For testing purposes, however, using the serverless option
does not allow us to best align the underlying infrastructure, since it is obfuscated, and thus,
creates a true like-for-like comparison. Thus, we used the Amazon EKS option where you

McKnight Consulting Group ©2021                                                       10
Containerized SQL Server Performance Testing choose and deploy your own EC2 instances and allow the EKS to install the necessary Kubernetes components in order to run our containers. Beyond the scope of our testing, Amazon EKS does provide some enterprise benefits for utilizing the service. EKS is deeply integrated with services such as Amazon CloudWatch, Auto Scaling Groups, AWS Identity and Access Management (IAM), and Amazon Virtual Private Cloud (VPC), which provide the ability to monitor, scale, and load-balance applications. EKS also integrates with AWS App Mesh and provides a Kubernetes native experience to consume service mesh features and bring observability, traffic controls and security features to applications. Finally, EKS provides a control plane to provide scalability across multiple availability zones and eliminate a single point of failure. EKS runs upstream Kubernetes and is certified Kubernetes conformant. This made it easy to migrate our database and testing pods to EKS with little need to refactor our Helm charts— other than setting the storage provisioner to AWS Elastic Band Storage (EBS). Azure Kubernetes Service Deploying Kubernetes on Azure is similar to AWS. The options range from self-managed Kubernetes on Azure Virtual Machines (VM) to fully-managed, serverless Azure Kubernetes Service (AKS). For this testing, we chose a middle road—Azure-managed Kubernetes on VMs that we chose deployed using AKS. With Azure Kubernetes Service, Azure offers a control plane to simplify the deployment and management of a Kubernetes cluster. AKS offloads the technical and operational overhead of managing Kubernetes from the customer. As a hosted Kubernetes service, Azure handles tasks such as health monitoring and maintenance. In this case, the Kubernetes master node was managed by Azure, but the agent nodes we tested were managed by us. As a managed Kubernetes service, AKS is free—we only paid for the agent nodes within our clusters, not the master. AKS offers elastic scaling with the serverless option, but we would have found it to be easy to add additional nodes to our cluster, had we needed to in our testing. An advantage to using AKS is integration with other Azure services—such as Azure Active Directory for identity and access management, Azure Advisor for optimization recommendations, Visual Studio for development, and Azure Monitor for health and usage monitoring. AKS participates in the Certified Kubernetes Conformance Program. We also were able to utilize our existing Helm charts by only changing the persistent volume provisioner for Azure Disks. McKnight Consulting Group ©2021 11
Containerized SQL Server Performance Testing

McKnight Consulting Group ©2021                                  12
Containerized SQL Server Performance Testing

Test Setup

The purpose of this paper is to reveal the results of performance testing of several different
platforms leveraging a containerized database. While testing the performance of hardware
across vendors, clouds, and on-premise is very challenging, we want to alleviate concerns
that our chosen configurations might favor one vendor over another. We hope to achieve
this by providing transparency in our methods—what we did and why we made the choices
we did. This section provides a detailed technical description of the components we deployed
and the testing we performed.

Test Components
Our testing utilized the following components for the setup and execution of the tests.

Kubernetes
Enterprise adoption of containers and Kubernetes continues to grow rapidly. Enterprises are
turning to containers to increase efficiency, facilitate application portability, and enable
multi-cloud IT operations. Kubernetes is a leading containerization technology. For our
testing, we used v1.15.10 on Diamanti. For AWS and Azure, we used the latest available
version on their services. At the time of our testing, v1.19.3 was used on Azure AKS and
v1.18.9 was used on AWS EKS.

Helm
Helm is a popular Kubernetes package manager used to deploy Kubernetes applications with
a series of templates (or Helm charts) to consistently automate the process. Our Helm charts
also had a custom bash shell script we created to further enhance the repeatability of the
tests. The script had no bearing on the tests themselves, but it simply orchestrated the
creation of the SQL Server, HammerDB database build, and HammerDB test run pods via
Helm v3.

SQL Server
Relational databases are a cornerstone of an organization’s data ecosystem. While alternative
SQL platforms are growing with the data deluge, and have their place, today, workload
platforming decision-makers highly consider and usually choose the relational database. This
is for a good reason. Since 1989, Microsoft SQL Server has proliferated to near-ubiquity as a
relational server of choice for the original database use case—On-Line Transaction
Processing (OLTP)—and beyond. The high usage of SQL Server in organizations of all sizes

McKnight Consulting Group ©2021                                                      13
Containerized SQL Server Performance Testing
made it a good choice for our testing, since many of our readers will have experience with
this DBMS.
SQL Server container images have been available since 2017. Since the underlying operating
system used was Red Hat Enterprise Linux 7.6, we used the 2019-CU5-rhel-7.6 SQL Server
container image provided by mcr.microsoft.com/mssql/rhel/server.
In terms of tuning SQL Server, we used an “out-of-the-box” configuration. We defined the
directory structure for the data, logs, and temporary database (tempdb), such as
/var/opt/mssql/data, all on the same volume to use the fastest storage for all I/O by SQL
Server. Other than that, we used the defaults of the SQL Server image from Microsoft.
The biggest configuration decision we made was to limit the memory of the SQL Server pod.
Since this testing is largely about storage and I/O performance, we set the pod memory low.
This would force SQL Server to hit the disks as much as possible without causing out of
memory errors. It took some experimentation to get the right combination, but we found
that a SQL Server pod with 32 CPU and 32 GB of RAM were satisfactory in allowing the tests
to run clean (without error) and push the storage as hard as possible. As the results will
reveal, we consistently hit I/O ceilings where the maximum IOPS achieved was very similar
from run to run. This 32 CPU and 32 GB RAM limit was applied across the board and held
constant throughout the testing.
TPC-H
The test used in the benchmark were a workload derived from the well-recognized industry
standard TPC Benchmark™ H (TPC-H)1. From tpc.org:
The TPC-H is a decision support benchmark. It consists of a suite of business-oriented
ad-hoc queries and concurrent data modifications. The queries and the data
populating the database have been chosen to have broad industry-wide relevance.
This benchmark illustrates decision support systems that examine large volumes of
data, execute queries with a high degree of complexity, and give answers to critical
business questions.
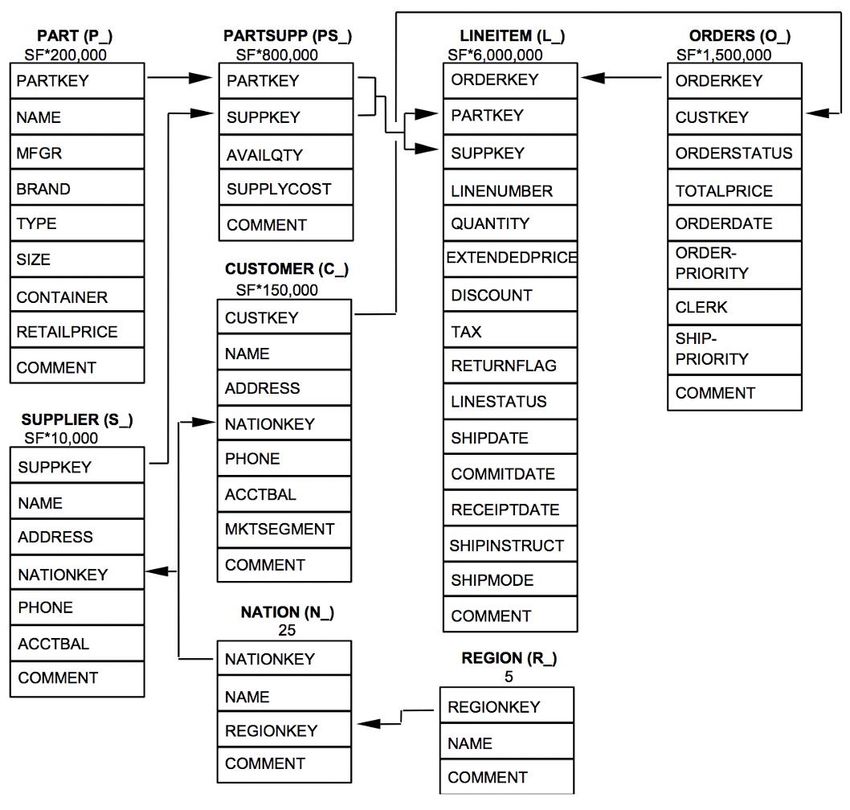
To show the data model, the following diagram was taken from page 13 of the TPC-H
Revision 2.17.3 specification document.
1
More can be learned about the TPC-H benchmark at http://www.tpc.org/tpch/.
McKnight Consulting Group ©2021 14Containerized SQL Server Performance Testing
The TPC-H is an industry-accepted, widely-used testing workload. We chose it, because it is
easily repeatable and publicly documented for anyone who would want to replicate our
testing.
HammerDB
The implementation of the TPC-H was provided by HammerDB2. HammerDB is free and
open-source software with source code hosted by the TPC on GitHub. At the time of testing,
we utilized the latest downloadable binary release, version 3.3.
Monitoring & Statistics
To monitor and collect statistics during our test runs, we used the sysstat package containing
system performance tools for the Linux operating system. Sysstat is open source and available
on GitHub and in most Linux package manager repositories (Yum, Apt-Get, et cetera.) We
used the applications SAR and IOSTAT to collect CPU, I/O, and other statistics of the server
node under test. For most tests, we captured readings every minute over a three hour period.
For shorter running tests, such as single virtual user, we only captured 30 minutes’ worth.
2
More can be learned about HammerDB at https://hammerdb.com/.
McKnight Consulting Group ©2021 15Containerized SQL Server Performance Testing We also monitored the health of the SQL Server and HammerDB pods during the test run— and nulled the test run if any errors occurred. Thus, in our findings, we only report the results of “clean runs”—runs free of errors. All monitoring data, test run logs, and statistics were kept and maintained for further analysis. Platform Configurations (Systems Under Test) Each of the systems we tested were chosen in an attempt to create a like-for-like testing scenario. This is difficult to achieve across vendors and particularly across clouds. Testing multiple hybrid cloud and public cloud vendor hardware is not a sterile lab environment. While we do our best to achieve as closely aligned configurations as possible, there is no guarantee we have achieved complete congruence. What we do instead is make our decisions as transparent as possible and configure our testing environments in a way that is relatable and repeatable for our readers—with no “black boxes” or hidden steps. Also, remember that the SQL Server pods were constrained to 32 CPU and 32 GB RAM to eliminate any inconsistencies in HW configuration. Diamanti For Diamanti Enterprise Kubernetes Platform, we were provided a D20 Small cluster with 3 nodes. Each node had 40 Intel Xeon Silver 4114 CPUs clocked at 2.20GHz and 192 GB RAM (which was largely not utilized). The cluster also had a Diamanti high performance 4TB NVMe solid state storage array with Diamanti Ultima Offload. Diamanti offload card capabilities can be compared with AWS Nitro subsystem but consolidated and optimized for containers. AWS EKS Amazon Web Services Elastic Kubernetes Service was deployed using the dedicated server (not serverless) using r5d.8xlarge Elastic Cloud Compute (EC2) instances. The r5d EC2 instances had 32 second generation Intel Xeon Platinum 8000 series processors with a sustained all core Turbo CPU clock speed of up to 3.1 GHz and 256 GB of RAM. This instance type is Nitro-based, which doubles the I/O capabilities of the Elastic Band Storage (EBS) volumes we used. We had four nodes—one master and one for each of the EBS storage types we tested: gp2 (general purpose), io1 (provisioned I/O), and io2 (provisioned I/O 2nd generation). We attached a 2TB volume of each type—one to each of the three worker nodes. In terms of state performance, AWS gp2 volumes have 3 16K IOPS per 1 GB of disk space. Thus, our 2TB McKnight Consulting Group ©2021 16
Containerized SQL Server Performance Testing

gp2 disk had a ceiling of 6,144 IOPS (16K). For the io1 and io2 disks, we provisioned the
maximum allowable IOPS for the drive—64,000 IOPS (16K).

Azure AKS

Azure Kubernetes Service was also deployed with dedicated servers using E32as_v4 virtual
machines. The Eav4 servers featured 32 of the AMD EPYC 7452 processors and 256 GB of
RAM. We deployed three nodes—a master node and one each for the two storage classes we
tested. We attached a 2TB P40 Managed Premium Disk to one worker and a 2TB Ultra Disk
to the other. The Premium P40 Disk comes with 7,500 IOPS (16K) and a rated throughput of
250 MB/s. The Ultra Disk was provisioned with the maximum number of 80,000 IOPS (16K)
and the maximum throughput offered of 2,000 MB/s.

McKnight Consulting Group ©2021                                                      17
Containerized SQL Server Performance Testing

Success Criteria

We focused on following two results around TPC-H while comparing all the listed platform:

Execution Times
TPC-H is the combination of 22 different queries for each virtual user. We captured the
total time taken by all the queries for all the virtual users

Price-Performance
As every platform is different and has a different pricing model, the highest performing
platform may still not be suitable for budget consideration. So we calculated the price-
performance ratio for each platform as the best metrics to compare the TCO from a business
perspective. The TPC-H Price/Performance metric is expressed as $/QphH@Size.

McKnight Consulting Group ©2021                                                     18
Containerized SQL Server Performance Testing

Test Results

This section analyzes the results of our TPC-H HammerDB testing of SQL Server database
pods on the Kubernetes-based platforms we tested.

Execution Times
In this first of the results section, we will reveal and discuss the raw TPC-H execution times
and performance from running the HammerDB tests.

Scale Factor 100
With the TPC-H test, a scale factor of 100 means an initial database size of 100GB. While
this is not a huge volume of data, we believe it to be a typical representation of an application
or microservice database.

The 22 queries of the TPC-H were completed in random order (per the HammerDB settings)
and the test was repeated with 1, 8, 16, and 32 virtual users or streams—which simulates
concurrent users all hitting the database at the same time.

The first chart compares the total execution time of the workload (the time from the first
query submitted to the final user’s last query completes.) Diamanti was fastest for all sets of
virtual user tests, but this chart showcase only 32 virtual users.

McKnight Consulting Group ©2021                                                        19
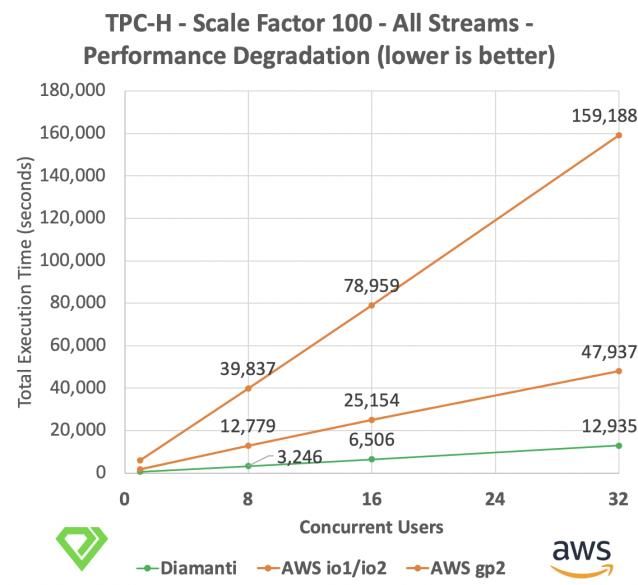
Containerized SQL Server Performance Testing

To demonstrate how Diamanti compared with the other platforms, we created these
“performance degradation” charts. Obviously, query execution time increases as more users
hit the database and contend for system resources. Interestingly it was a fairly linear and flat
degradation in performance for Diamanti. It was too visually overwhelming to put all the
platforms on one chart, so we compare Diamanti versus AWS, and Azure respectively. You
can see how Diamanti took the smallest performance hit as more and more users hit the
database pod.

McKnight Consulting Group ©2021                                                        20
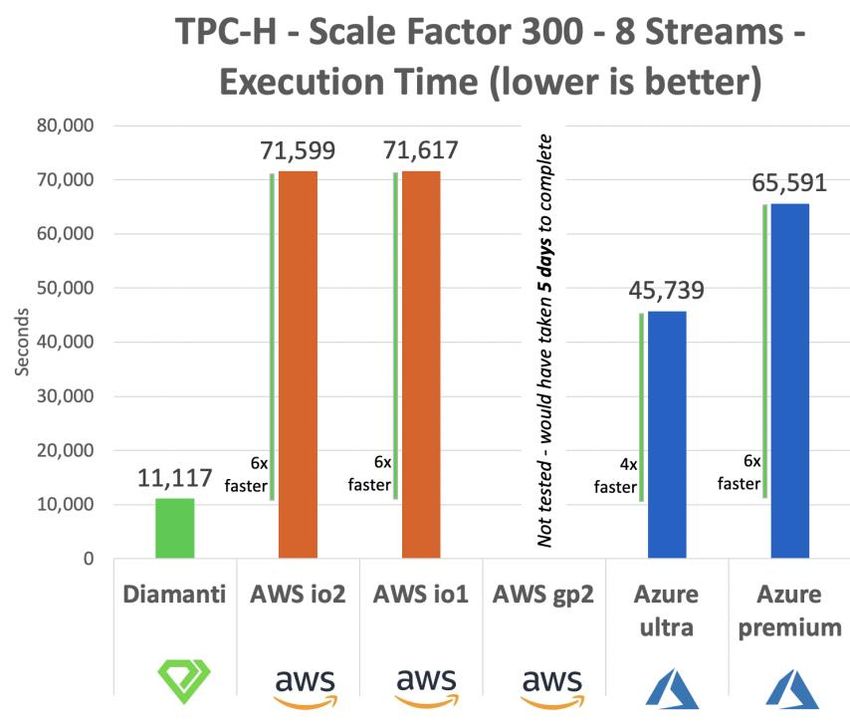
Containerized SQL Server Performance Testing

Scale Factor 300
With the TPC-H test, a scale factor of 300 means an initial database size of 300GB, so this test
had 3x more data than the SF100 tests. Unfortunately, at TPC-H scale factor 300, not all
platforms could complete the workload successfully with 32 concurrent users. Azure with
Ultra disks did not complete with 32 users and Azure with Premium disks did not even
complete with 16 or 32 users, so the lowest common denominator for platforms tested was 8
concurrent users. We did not even test AWS with gp2 volumes because based on the SF100
results, we estimated that the build of the database would have taken over 3 days and
running the 32 user tests would have taken more than 5 days to complete—which was
clearly infeasible. As you can see, even for scale factor 300, Diamanti was fastest with 8
virtual users, but for also all the other virtual user tests as well (compared to platforms who
were able to complete them).

McKnight Consulting Group ©2021                                                       21
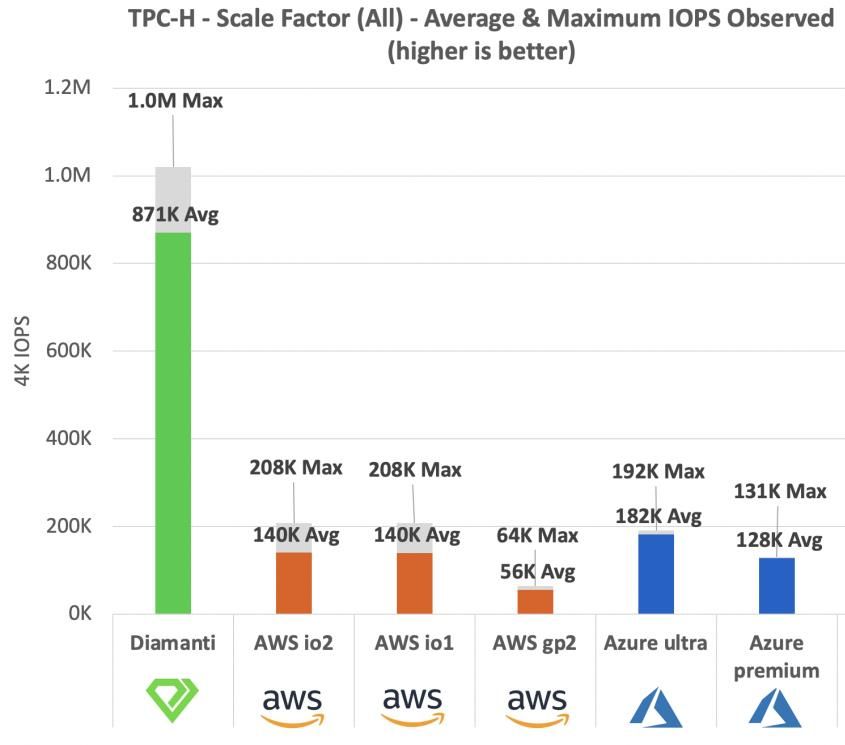
Containerized SQL Server Performance Testing

We also completed the same performance degradation charts to show how the performance
changed as more virtual users were added to the tests. As you can see Diamanti, not only
outperformed rest, but the same trend we saw at SF100 was compounded with the larger data
size.

Explanation
While the execution results of the tests are certainly revealing the performance among the
platforms tested, we collected a number of other metrics and statistics that may help to
explain the differences we saw.

IOPS (4K)
Again, this testing is largely about storage and I/O performance, so the first place we looked
to explain the results was I/O operations per second (IOPS). Because we intentionally set the
pod memory low on the SQL Server pod (32 CPU and 32 GB of RAM), we were able to push
the storage as hard as possible. As the results will reveal, we consistently hit I/O ceilings
where the maximum IOPS achieved was very similar from run to run. The following chart
reveals the average and maximum 4K IOPS for each platform during all their runs. Clearly,
Diamanti had a huge advantage—at times pushing as many as 1,000,000 IOPS (4K), which
was 5x more than the nearest competitor.

McKnight Consulting Group ©2021                                                      22
Containerized SQL Server Performance Testing

To obtain these figures, we took all the read throughput (MB/second) measurements from
the IOStat output and used the following formula to ascertain the IOPS with a 4K size:

       IOPS (4K) = Throughput (MB/s) × 4K / 1,024KB/MB

I/O Wait Times
When I/O becomes a bottleneck, the CPU and application are left with idle time waiting for
I/O bandwidth to become available. This can be measured with the percentage of the CPU’s
time spent waiting for I/O (from SAR output) or the time the application is waiting for I/O
(from IOStat output). Different systems report them in different ways. For example, on our
AWS EC2 Intel-based architecture, CPU I/O wait was between 33% and 40% of its time and
minimal application I/O waits. While Azure, and our virtual machine’s AMD architecture,
reported application I/O wait times between 400 milliseconds and half a second with
minimal CPU I/O waits. Diamanti had minimal of both with 5 millisecond application I/O
wait times and less than 1% CPU I/O wait times.

McKnight Consulting Group ©2021                                                     23
Containerized SQL Server Performance Testing Disk Latency The reason Diamanti was able to achieve such high IOPS and low I/O wait times is found in the speed of its I/O access. The Diamanti platform we tested also included the system monitoring time-series database, Prometheus. From this, we were able to extract disk latencies during our test runs. As you can see in the following table, Diamanti had disk latency (from the time a read/write request is made to the time the disk responds) averaged just over 200 microseconds. Even as the data volume was tripled, the average latency only went up 13%. McKnight Consulting Group ©2021 24
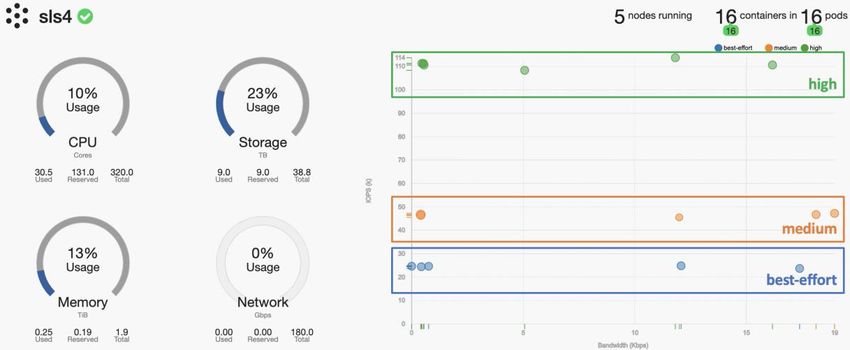
Containerized SQL Server Performance Testing

Quality of Service Testing
In addition to the competitive testing described above, we also tested Diamanti’s quality of
service (QoS) and its tiered storage class feature. This feature allows users to prioritize I/O
bandwidth between different Kubernetes pods and stateful sets by assigning storage class
tiers. We tested three tiers: high, medium, and best-effort.

For this test, we used a Diamanti D20 Medium (with 64 CPU) and created 16 instances of
SQL Server pods each with 4CPU assigned. We had 6 pods assigned to the high tier, and 5
each to the medium and best-effort tiers. We then built 16 HammerDB pods to saturate the
system with as many simultaneous I/O requests as possible.

Using the Diamanti web user interface management console, we took this screenshot of the
IOPS achieved at each storage tier. Notice the distribution of the 1,000,000 IOPS between
the pods of different storage classes.

As networking was not in picture the X axis can be ignored here. If you look at the Y axis for
the IOPS you can clearly see that even though all 16 instances of SQL server and were being
pumped with same amount of data, just because they belong to different performance tier,
Diamanti storage system was making sure that each of them were getting storage bandwidth
based on the assigned performance tier.

McKnight Consulting Group ©2021                                                        25
Containerized SQL Server Performance Testing

We believe this kind of guaranteed SLA is very important for critical databases on a shared
infrastructure and will help customers to eliminate noisy neighbors with predictable
performance and consolidated infrastructure without any overprovisioning.

McKnight Consulting Group ©2021                                                      26
Containerized SQL Server Performance Testing

Price-Performance

To conduct comparative performance testing, we typically make the attempt to align the
hardware and software as much as possible between the platforms. However, achieving a
same like-for-like configuration between public, private cloud, and on-premise platforms is
very difficult. System cost can be a tricky aspect to compare systems, because vendor
platforms vary on their pricing and licensing models. However, the platforms tested have a
consistent on-demand hourly or annual subscription-based pricing that we can use to
determine price per performance.

Platform (Systems Under Test) Pricing
To achieve a fair representation of pricing, we priced the systems under test using their
publicly available pricing using consumption-based pricing. The TPC-H price-per-
performance calculation requires a three-year total cost of the system under test. In
conventional database system testing, this is straightforward—how much does the entire
server cost over a three-year period? However, in a containerized world this is less
straightforward. The footprint of a Kubernetes pod occupies a fraction of a server. Obviously,
one cannot buy a fraction of a server (unless serverless configurations were tested, which we
did not), so the unit of pricing we used was the cost of a single Kubernetes worker node
running the SQL Server pod. This allowed us to at least achieve a like-for-like price
comparison. For the cloud vendors, AWS and Azure, the pricing of compute and storage are
separate line items. This pricing method allowed us to account for the different storage
classes we tested—for example, the worker EC2 instance with the gp2 volume attached is
one price, while another EC2 instance with the io2 volume attached is another price. This
was the fairest way we were able to represent pricing while honoring the intent of the TPC-
H price-per-performance formula. We present the pricing here and leave it for the reader to
determine the fairness for themselves.

Additionally, we would typically include a 5% adjustment in the base pricing to account for
the costs associated with networking (e.g., hardware for on-premise deployments or network
egress charges for cloud deployments.) Since this 5% would be charged across the board, we
have elected to omit it, since it will not affect the comparable price-per-performance results.

Diamanti

For Diamanti Enterprise Kubernetes Platform, we used non-discounted subscription rates for
the D20 Small configuration we tested. Diamanti pricing is offered in both perpetual license
and subscription-based forms and is likely subject to negotiation below the “sticker price” we
present here.

McKnight Consulting Group ©2021                                                      27
Containerized SQL Server Performance Testing

At the time of this writing, a single node of the Diamanti system we tested is subscription
priced as follows:

 Platform              Diamanti Enterprise Kubernetes Platform

 Server Class          D20 Small (40 CPU | 192 GB RAM )

 Storage Capacity      4,096 GB

 Price Basis           Annual Subscription

 Price Per Year        $34,251.00

 Support               Included

 3-Year Price          $102,753.00

AWS EKS

For Amazon Web Services Elastic Kubernetes Service, we used the free tier for the service
(the enterprise tier is $0.10 per hour) and only paid for the EC2 compute, EBS storage, and a
10% premium for basic support. At the time of this writing, a single node of the AWS system
we tested is subscription priced as follows:

 Platform              Amazon Web Services Elastic Kubernetes Service

 Server Class          r5d.8xlarge (32 CPU | 256 GB RAM )

 Compute Price-        3-Year Reserved (Up-front payment)
 Basis

 Compute Per Year      $7,586.16

 Storage Classes       gp2                                  io1 / io2

 Storage Capacity      2,048 GB                             2,048 GB

 Storage Price-Basis   $0.10 per GB-month                   $0.125 per GB-month +
                                                            $0.065 per IOPS-month

 Storage Per Year      $2,457.60                            $52,992.00

 Support               10%                                  10%

McKnight Consulting Group ©2021                                                        28
Containerized SQL Server Performance Testing
Best 3-Year Price $34,650.97 $208,994.65
Azure AKS
For Azure Kubernetes Service, the service was free, and we paid for the virtual machines,
managed disks, and a $1,200 annual fee for basic support. At the time of this writing, a single
node of the AKS system we tested is subscription priced as follows:
Platform Azure Kubernetes Service
Server Class E32as_v4 (32 CPU | 256 GB RAM )
Compute Price- 3-Year Reserved (Up-front payment)
Basis
Compute Per Year $6,971.21
Storage Classes Premium Ultra
Storage Capacity 2,048 GB 2,048 GB
Storage Price-Basis 1-year commitment $0.12 per GB-month +
$0.05 per IOPS-month +
$1.01 per MB/s-month
Storage Per Year $2,685.00 $75,189.12
Support $1,200/year $1,200/year
Best 3-Year Price $34,017.06 $262,405.03
Price-Per-Performance Calculation
The TPC-H price-per-performance calculation is not overly simple. It consists of two
measures: Throughput@Size and Power@Size. Our purpose is not to explain the intent or
mathematics behind the formula, but rather to reproduce it here and show the outcome
based on the testing results we experienced. For more information, see the TPC-H Revision
2.17.3 specification document.
McKnight Consulting Group ©2021 29Containerized SQL Server Performance Testing
Throughput@Size
Throughput@Size is the TPC-H measurement for the amount of throughput that each
system can produce given the test scale factor (@Size) and the number of concurrent users—
which is synonymous with virtual users (in HammerDB vernacular) or streams (in TPC-H
vernacular). Throughput@Size is determined by the following formula:
TPC-H Throughput@Size = (Streams × 22 × 3600) / TotalElaspedTime * ScaleFactor
In terms of results, the higher Throughput@Size, the better. The formula does normalize the
results across test runs. The following table is the Throughput@Size for both scale factors
(100 and 300) and the highest number of streams tested (up to 32) that resulted in a clean
run—which we used for the price-performance calculation. It is sorted from best throughput
to worst for each scale factor.
Platform Scale Factor Streams Time (sec) Throughput@Size
Diamanti 100 32 12,935 19,593.4
AWS io2 100 32 47,937 5,286.9
AWS io1 100 32 48,729 5,201.0
Azure ultra 100 32 50,957 4,973.6
Azure premium 100 32 75,309 3,365.3
AWS gp2 100 32 159,188 1,592.1
Platform Scale Factor Streams Time (sec) Throughput@Size
Diamanti 300 32 43,611 17,434.1
Azure ultra 300 16 88,555 4,292.9
Azure premium 300 8 65,591 2,898.0
AWS io2 300 32 284,627 2,671.3
AWS io1 300 32 285,547 2,662.7
AWS gp2 Not tested
McKnight Consulting Group ©2021 30Containerized SQL Server Performance Testing
Diamanti clearly had roughly 4 times higher throughput than the second place platform in
both cases.
Power@Size
The TPC-H Power@Size calculation is meant to show how well a system under test is a
single query thread performance. The calculation is given by the following formula:
TPC-H Power@Size =
The second summation within the equation involves the refresh stream test, which we did
not perform, so this is 0. Thus, we only had to concern ourselves with the sum of the natural
logarithms of the 22 individual TPC-H query execution times.
The Power@Size we achieved at both scale factors is shown in the following tables—the
higher the better:
Platform Scale Factor Streams Sum(ln Q) Power@Size
Diamanti 100 1 60.1 29,450.4
AWS io2 100 1 86.5 9,797.6
AWS io1 100 1 88.2 9,116.5
Azure ultra 100 1 89.5 8,650.4
Azure premium 100 1 96.5 6,451.6
AWS gp2 100 1 112.1 3,371.0
Platform Scale Factor Streams Sum(ln Q) Power@Size
Diamanti 300 1 82.5 34,700.8
Azure ultra 300 1 117.2 8,189.3
Azure premium 300 1 125.9 5,679.7
AWS io2 300 1 125.0 5,917.5
AWS io1 300 1 126.0 5,674.8
McKnight Consulting Group ©2021 31Containerized SQL Server Performance Testing
AWS gp2 Not tested
Again, Diamanti was the clear winner by showing 3x more power at SF100 than second place
and over 4x more power at the larger data size of SF300.
Price-Per-Performance
With Throughput@Size and Power@Size, we can finish the TPC-H Price-Per-Performance
calculation. This formula is as follows:
TPC-H Qph@Size (queries per hour) =
TPC-H Price-Per-Performance = 3-Year Total Cost / Qph@Size
The following table details these TPC-H Price-Per-Performance measurements with the
cheapest platform first:
Platform Scale Factor Qph@Size 3-Year Cost Price-Perf
Diamanti 100 24,021.5 $102,753 $4.28
Azure premium 100 4,659.6 $34,017 $7.30
AWS gp2 100 2,316.7 $34,651 $14.96
AWS io2 100 7,197.2 $208,995 $29.04
AWS io1 100 6,885.9 $208,995 $30.35
Azure ultra 100 6,559.3 $262,405 $40.01
Platform Scale Factor Qph@Size 3-Year Cost Price-Perf
Diamanti 300 24,596.3 $102,753 $4.18
Azure premium 300 4,057.0 $34,017 $8.38
Azure ultra 300 5,929.2 $262,405 $44.26
AWS io2 300 3,975.8 $208,995 $52.57
AWS io1 300 3,887.2 $208,995 $53.77
McKnight Consulting Group ©2021 32Containerized SQL Server Performance Testing AWS gp2 300 Not tested Summary The following charts summarize the Price-Per-Performance findings of our testing— showing the number of times cheaper Diamanti was than the other platforms tested. Diamanti was, by far, the most powerful and offered the highest throughput giving the best value for dollars paid. McKnight Consulting Group ©2021 33
Containerized SQL Server Performance Testing

The second place platform was Azure Kubernetes Service with Premium Managed Disks,
which was still twice the cost of Diamanti.

McKnight Consulting Group ©2021                                                 34
Containerized SQL Server Performance Testing

Conclusion

Overall, the test results were insightful in revealing query execution performance and some
of the differentiators for these enterprise Kubernetes platforms. At the TPC-H scale factor of
100 and 32 concurrent users, Diamanti was between 4x and 12x faster than AWS Kubernetes
Service. Diamanti was also between 4x and 6x faster than Azure Kubernetes Service.

At TPC-H scale factor 300, not all platforms could complete the workload successfully with
32 concurrent users. Azure with Ultra disks did not complete with 32 users and Azure with
Premium disks did not complete with 16 or 32 users, so the lowest common denominator for
platforms tested was 8 concurrent users. At this level, Diamanti was 6.5x times faster than
AWS with their best io1 or io2 volumes. Diamanti was between 4x and 6x faster than Azure
with either their best Ultra disk or mid-performance range Premium Managed disk. We did
not even test AWS with gp2 volumes because the build of the database would have taken
over 3 days to complete. We also estimate, based on the SF100 results, the 32 user tests
would have taken over 5 days to complete with AWS gp2.

In terms of price per performance as a scale factor of 100, Diamanti was between 4x and 8x
cheaper than AWS Kubernetes Service and between 2x and 11x cheaper than Azure
Kubernetes Service. At a scale factor of 300, Diamanti was 13x cheaper than AWS using their
best io1 and io2 disks and 10x cheaper than Azure using its best Ultra disk.

Price and performance are critical points of interest when it comes to selecting an analytics
platform, because they ultimately impact total cost of ownership, value, and user satisfaction.
Our analysis reveals Diamanti to be both an exceptional performer and an excellent value.

McKnight Consulting Group ©2021                                                       35
Containerized SQL Server Performance Testing

About Diamanti

Diamanti delivers the industry’s only purpose-built, fully integrated Kubernetes platform,
spanning on-premises and public cloud environments. We give infrastructure architects, IT
operations, and application owners the performance, simplicity, security, and enterprise
features they need to get cloud-native applications to market fast. Diamanti provides the
lowest total cost of ownership to enterprise customers for their most demanding applications.
Based in San Jose, California, Diamanti is backed by venture investors CRV, DFJ, Goldman
Sachs, GSR Ventures, Northgate Capital, and Translink Capital. For more information, visit
www.diamanti.com or follow @DiamantiCom.

McKnight Consulting Group ©2021                                                     36
You can also read