Gannawarra Energy Storage System - Operational Report #3 and #4 Edify Energy and EnergyAustralia
←
→
Page content transcription
If your browser does not render page correctly, please read the page content below
Gannawarra Energy Storage System
Operational Report #3 and #4

Edify Energy and EnergyAustralia
hello@edifyenergy.com
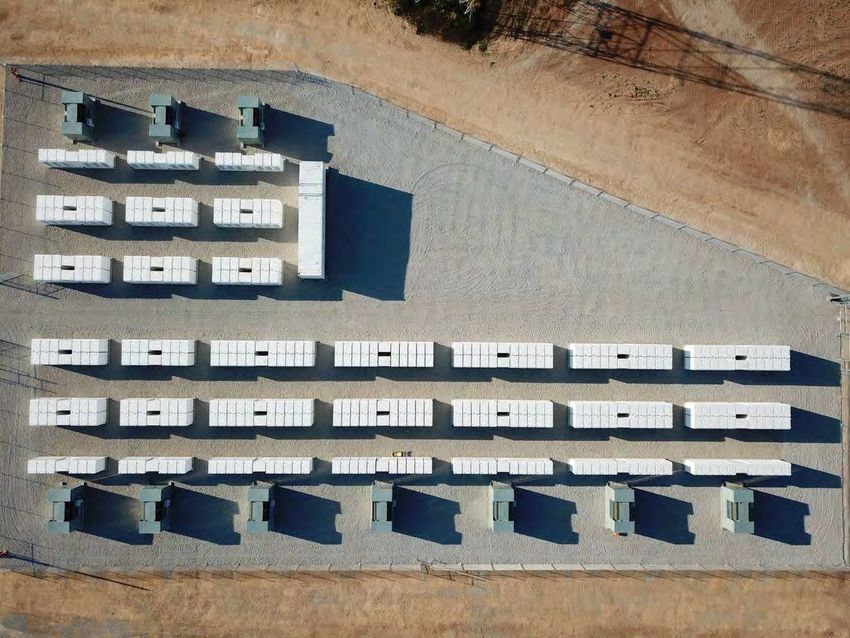
Table of Contents
Executive Summary...............................................................................................................................................5
    Project partners ..................................................................................................................................................6
1      Introduction .....................................................................................................................................................8
    1.1        Knowledge sharing activities to date.....................................................................................................8
    1.2        About Edify Energy ................................................................................................................................9
    1.3        About EnergyAustralia ........................................................................................................................ 10
    1.4        Project overview.................................................................................................................................. 11
       1.4.1       EnergyAustralia as operators ......................................................................................................... 11
2      Operational regimes .................................................................................................................................... 14
    2.1        Services provided ............................................................................................................................... 14
    2.2        Financial performance ........................................................................................................................ 15
       2.2.1       Marginal and distribution loss factors ............................................................................................. 20
       2.2.2       Network charges and charging implications .................................................................................. 20
       2.2.3       Avoided TUoS ................................................................................................................................. 22
    2.3        Constraints on operation .................................................................................................................... 23
3      Technical performance ............................................................................................................................... 25
    3.1        Technical performance ....................................................................................................................... 25
       3.1.1       Cycle performance.......................................................................................................................... 25
       3.1.2       Availability ....................................................................................................................................... 27
    3.2        Safety and environmental performance ............................................................................................. 28

List of Figures
Figure 1 Commercial arrangements for GESS and its interaction with GSF ................................................... 11
Figure 2 Structure of the novel long-term services agreement with EnergyAustralia...................................... 12
Figure 3 Financial performance of GESS .......................................................................................................... 15
Figure 4 Average GESS operational profile by month ...................................................................................... 17
Figure 5 Average VIC trading interval prices by month .................................................................................... 18
Figure 6 Average interval FCAS prices by month and service: March 2019 to February 2021 ...................... 19
Figure 7 Impact of forecast error on GESS dispatch ........................................................................................ 23

                                                      Gannawarra Energy Storage System                                                                                 2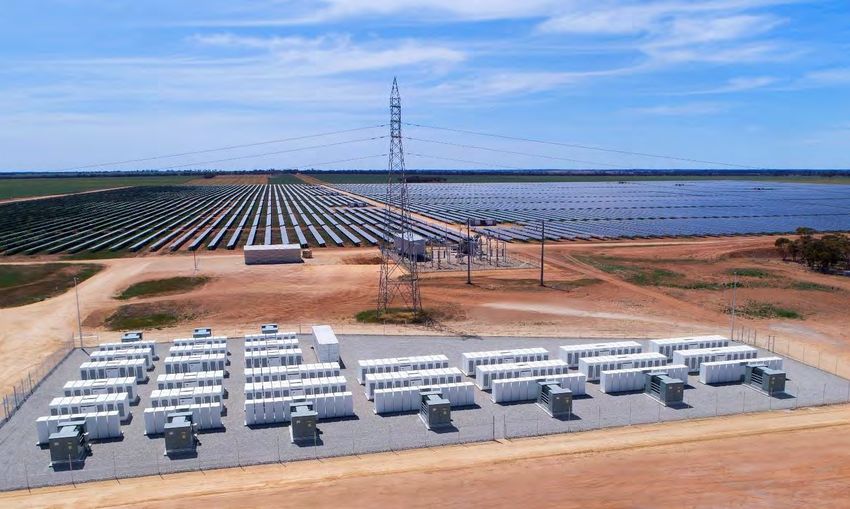
Figure 8 Round-trip efficiency ............................................................................................................................ 26
Figure 9 Round-trip efficiency and usage over two-year operational period ................................................... 27

List of Tables
Table 1 Knowledge sharing activities to date .......................................................................................................8
Table 2 Edify Energy’s Australian development and transaction experience .................................................. 10
Table 3 MLF and DLFs for the reporting period ................................................................................................ 20
Table 4 Powercor ST and LLV tariffs for 2020 and HY 2021 ........................................................................... 21
Table 5 Summary of GESS financials from March to August 2020 ................................................................. 22
Table 6 Summary of GESS financials from September 2020 to February 2021 ............................................. 22
Table 7 Charge and discharge cycle summary: March to August 2020 .......................................................... 25
Table 8 Charge and discharge cycle summary: September 2020 to February 2021 ...................................... 25
Table 9 Inverter block availability: March to August 2020 ................................................................................ 27
Table 10 Inverter block availability: September 2020 to February 2021 .......................................................... 27

Disclaimer
The views expressed herein are not necessarily the views of the Australian Government, and the Australian
Government does not accept responsibility for any information or advice contained herein.

                                                  Gannawarra Energy Storage System                                                                         3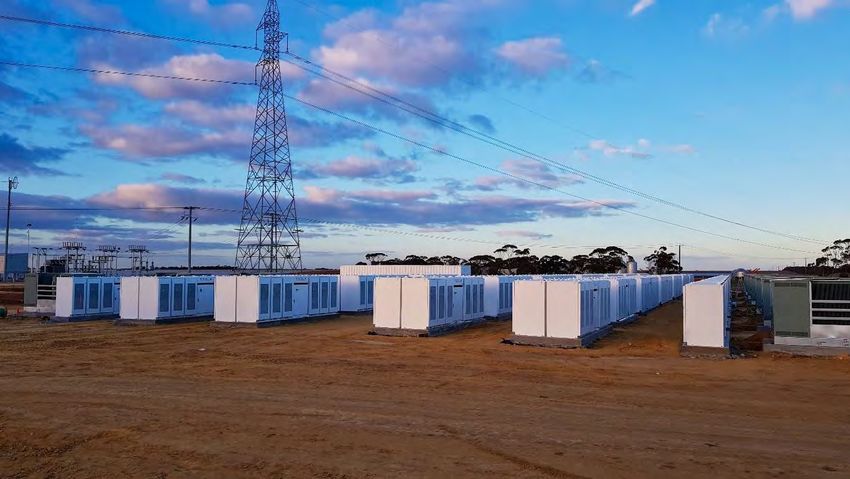
Glossary of Terms
Acronym   Meaning

AC        Alternating Current

AEMO      Australian Energy Market Operator

API       Application Programming Interface

ARENA     Australian Renewable Energy Agency

BSSA      Battery Storage Services Agreement

DELWP     The Victorian Government’s Department of Environment, Land, Water and Planning

DLF       Distribution Loss Factor

DUOS      Distribution Use of System

Edify     Edify Energy Pty Ltd and its related entities

EPC       Engineering, Procurement and Construction

FCAS      Frequency Control Ancillary Services

GESS      Gannawarra Energy Storage System

GSF       Gannawarra Solar Farm

LLV       Large Low Voltage

MLF       Marginal Loss Factor

NEM       National Electricity Market

NMI       National Metering Identifier

Project   GESS

RCR       RCR Tomlinson Limited

RRN       Regional Reference Node

SCADA     Supervisory Control and Data Acquisition

SOC       State-of-Charge

ST        Subtransmission

TUoS      Transmission Use of System

WIRCON    Wircon Energie 9 GmbH and its related entities

                            Gannawarra Energy Storage System                               4
Executive Summary
This operational report covers the second of two 6-month operational periods for the Gannawarra Energy
Storage System – March to August 2020 and September 2020 to February 2021. Between the Project
Summary Report and the first Operational Report, the GESS project has already provided the sector with a
number of development, regulatory, delivery and operational learnings, particularly in relation to coordinated
battery and renewable plant arrangements. This report should therefore be read in conjunction with these
previous reports to provide the reader with the project’s full breadth of findings.
The key insights articulated in Executive Summary of the first operational report remain current for the
second 12-month operational period. Otherwise, a summary of the key lessons learned from an operational
and financial perspective discussed in this report, is as follows:

• At current prices, FCAS revenues are a significant component of battery revenues and therefore the value
  stack, but the volatility and depth of these value streams make it difficult to rely on for capital investments.
• Batteries connecting to the distribution network face significant demand-based charges which can result in
  sub-optimal trading decisions and therefore underutilisation of storage assets. This is mitigated in part by
  1) the option to charge during solar hours in the case of the co-located arrangement of GESS and GSF;
  and 2) access to avoided TUOS payments, which in turn are subject to the accessibility of this revenue
  stream when managing connection constraints of co-located facilities.
• As alluded to above, while co-locating batteries with renewable assets has capital and operating cost
  benefits, there can be downsides from sharing a connection when the connection size requires constraints
  on the battery, particularly where the co-located renewable asset is pre-existing and a separate financial
  entity. Accurate forecasting of the renewable resource feeding into real-time decision-making tools is
  important to retain the option to maximise any available headroom in connection assets.
• Automation of bidding is a useful tool to optimise trading decisions and manage dynamic constraints, but it
  has its limitations.
• The intrinsic characteristics of battery assets such as GESS make them high performers from a safety and
  environmental perspective.

                                    Gannawarra Energy Storage System                                            5
Project partners
GESS would not have been possible without the support of DELWP as part of its Energy Storage Initiative,
ARENA as part of its Advancing Renewables Program or WIRCON as 50-50 joint venture co-investors.
GESS’s other project partners Tesla and EnergyAustralia also worked tirelessly to turn the project from
concept to reality.

                                 Gannawarra Energy Storage System                                          6
INTRODUCTION

          Gannawarra Energy Storage System   7
1         Introduction
This Operational Report #3 and #4 covers the time from completion to the end of the second 2 x six-month
periods (March to August 2020 and September 2020 to February 2021) of operation of GESS. This report
represents two of the Knowledge Sharing deliverables under the Funding Agreement with DELWP and
ARENA, and also forms a key part of ARENA’s Advancing Renewables Programme objectives.

The report focuses on operational learnings, including the following:

•   Operational regimes (e.g. arbitrage and firming);
•   Ancillary Services provided;
•   Technical performance;
•   Financial performance; and
•   Safety and environmental performance.

The report is public with an intended audience that includes:

•   Developers;
•   Renewable energy industry;
•   General public;
•   Vendors;
•   General electricity sector; and
•   Governments.

1.1 Knowledge sharing activities to date
To date, a number of knowledge sharing activities for GESS have taken place as listed in Table 1.

Table 1 Knowledge sharing activities to date

    Activity          Details

    Industry          •   RenewEconomy / Informa Conference; June 2018
    presentations     •   All Energy Conference; October 2018
                      •   Baker McKenzie panel seminar; October 2018
                      •   AEMO Advanced Systems Integration Group (ASIG) meeting; October 2018
                      •   ARENA Insights Forum; November 2018
                      •   Australian Solar + Energy Congress and Expo; December 2018
                      •   Clean Energy Summit; July 2019

    Reports and       • ARENA’s GESS video, November 20181
    other published   • AEMO Emerging Generation and Energy Storage (EGES) stakeholder paper
    materials           response; December 20182
                      • Energy Magazine Article; February 20193

1 https://youtu.be/tEUiqYu28OA
2 https://www.aemo.com.au/-/media/Files/Electricity/NEM/Initiatives/Emerging-Generation/Submissions/Edify-
Energy_20181204.pdf
3 https://www.energymagazine.com.au/exploring-the-retrofit-model-and-offtake-agreements-for-battery-

integration/

                                      Gannawarra Energy Storage System                                       8
• ARENA Insights Spotlight: Gannawarra Energy Storage System (GESS) An interview
with Edify Energy, April 20194
• DELWP’s GESS media release and video, July 20195
• Project Summary Report, September 2019
• Operational Project Report #1 and #2, August 2020
• Energy Magazine Article; November 20206 (also published in the May 2021 issue of
Utility Magazine)
Site visits • Construction visit; August 2018
• Completion visit; June 20197
1.2 About Edify Energy
Edify is a leading 100% Australian owned renewable energy company, with significant experience in
developing, project financing and delivering renewable and storage projects across Australia. Edify has
under construction, or brought into operation, six large-scale solar farms (640MWAC / 770MWDC) and a
25MW / 50MWh lithium-ion battery.
The Edify business model supports the full lifecycle of energy project development and operation, including
greenfield development, project structuring and financing, construction management and a full asset
management offering, including trading, reporting and managing operations and maintenance personnel.
Edify’s philosophy is to ensure that its interests are as closely aligned with investors and project
stakeholders as possible. For this reason, in addition to providing long-term asset management services,
Edify seeks to maintain an equity interest in its projects, resulting in best-in-class assets.
The Edify management team has in excess of 130 years’ experience in the power and renewables sector
internationally, raised and deployed around $3 billion in capital, brought over 40 solar and wind projects into
commercial operation and overseen the construction and operation of a collective operational portfolio of
more than 1.7GW. Edify operates as a team across Australia in capital cities and in towns close to the
project sites, maintaining a strong connection with the communities in which the solar power and storage
plants operate.
Table 2 outlines the projects that Edify has developed, structured, financed and managed the construction of
to date. With the exception of the under-construction Darlington Point Solar Farm, all projects are
operational and under Edify’s asset management function.
As is noted in Section 1.4 below, GSF and GESS required the creation and registration of a network in order
to enable the connection arrangement for these two assets. Edify is one of very few energy companies that
has overcome many of the challenges presented in the energy sector’s transition in that, in addition to the
GESS / GSF network, Edify has developed, structured, financed and has under construction or operation
renewable assets, a battery, harmonic filters and a synchronous condenser.
4 https://arena.gov.au/assets/2019/04/gannawarra-energy-storage-system.pdf
5 https://www.energy.vic.gov.au/media-releases/australias-largest-integrated-battery-and-solar-system
6 https://www.energymagazine.com.au/co-locating-renewables-and-batteries-assessing-the-operational-
implications/
7 https://reneweconomy.com.au/edify-energy-celebrates-completion-of-gannawarra-big-battery-73122/,
https://www.abc.net.au/news/2019-06-14/australias-largest-solar-and-battery-farm-opens-in-kerang/11209666
Gannawarra Energy Storage System 9Table 2 Edify Energy’s Australian development and transaction experience
Project Capacity Location Status Comment
Whitsunday 58MWAC Collinsville, • Operational • Received ARENA funding
Solar Farm 69MWDC QLD • Commissioned • Secured largest Solar 150 Support with QLD
2018 Government
• Debt funding with CBA, CEFC and NORD
LB
Hamilton 58MWAC Collinsville, • Operational • Short-term PPA with ERM Power for full
Solar Farm 69MWDC QLD • Commissioned output
2018 • Debt funding with CBA, CEFC and NORD
LB
Daydream 150MWAC Collinsville, • Operational • PPA with Origin Energy for full output
Solar Farm 180MWDC QLD • Commissioned • Equity funding with BlackRock
2018 • Debt funding with CBA, CEFC and Natixis
Hayman 50MWAC Collinsville, • Operational • Merchant project
Solar Farm 60MWDC QLD • Commissioned • Equity funding with BlackRock
2018 • Debt funding with CBA, CEFC and Natixis
Darlington 275MWAC Darlington • Operational • PPA with Delta Electricity for portion of
Point Solar 330MWDC Point, • Commissioned output
Farm NSW 2020 • Equity funding with Octopus Investments
• Debt funding with CBA and Westpac
Gannawarra 50MWAC Kerang, • Operational • PPA with EnergyAustralia for full output
Solar Farm 60MWDC NSW • Commissioned • First large-scale solar farm in Victoria
2018 • Debt funding with CBA, CEFC and NORD
LB
Gannawarra 25MW / Kerang, • Operational • Grant funding provided by ARENA and VIC
Energy 50MWh NSW • Commissioned Government
Storage lithium-ion 2018 • Long-term services agreement with
System battery EnergyAustralia
• One of the largest co-located solar farm and
battery facilities in the world
1.3 About EnergyAustralia
EnergyAustralia provides gas and electricity to more than 2.5 million residential and business customer
accounts in Victoria, New South Wales, the Australian Capital Territory, South Australia and Queensland.
EnergyAustralia is dedicated to building an energy system that lowers emissions and delivers secure,
reliable and affordable energy to all households and businesses. To support this, EnergyAustralia owns,
contracts and operates an energy generation portfolio that includes coal, gas, battery storage, demand
Gannawarra Energy Storage System 10response, solar and wind assets. Combined, these assets comprise 4,500MW of generation capacity.
EnergyAustralia, which has its headquarters in Melbourne, is a wholly-owned subsidiary of CLP Group, one
of the largest publicly-owned integrated power businesses in the Asia Pacific. Read more about us here:
www.energyaustralia.com.au
1.4 Project overview
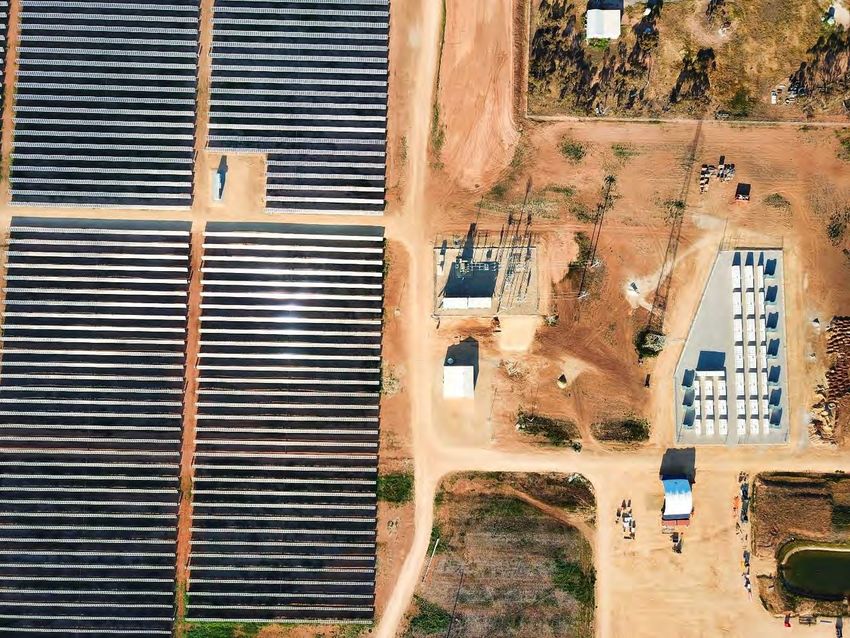
GESS is a 25MW / 50MWh battery that is integrated with Victoria’s first large-scale solar farm – GSF (being
a 50MWAC solar farm). GESS was developed and structured by Edify and financed by ARENA and DELWP
as providers of $25 million in grant funding with Edify in a consortium with WIRCON as 50-50 joint venture
co-investors. Tesla was the battery provider, RCR the EPC contractor and EnergyAustralia is the long-term
operator of GESS under a novel BSSA.
Now complete and commissioned, GESS is:
• The first integrated utility scale renewable energy and battery system in Victoria and among the first in
Australia;
• The first retrofit of a battery to an existing or under-construction solar farm in Australia;
• Among the largest integrated renewable energy and battery systems in the world; and
• A pioneering project for all consortium members and the broader electricity sector given its importance in
identifying necessary reforms to bring batteries and other storage technologies to market.
Figure 1 indicates the commercial relationships for GESS and how they interact with GSF. In addition to
developing and being a majority owner of GESS, Edify also acts as asset manager and oversaw the
construction of GESS, in a similar way to its role in GSF. Importantly, EnergyAustralia holds a long-term
offtake position with GSF, that complements its operational role for GESS under the BSSA.
Figure 1 Commercial arrangements for GESS and its interaction with GSF
Gannawarra Solar Farm (GSF) and GSF Network
Owned and operated by Gannawarra Solar Farm Pty Ltd (GSF Pty Ltd)
Ownership Construction
5.1% Edify Energy Management
94.9% Wirsol Energy Edify Energy
NMI
Gannawarra Energy Storage System (GESS) Asset Management
Owned and operated by GESS ProjectCo Pty Ltd (GESS Pty Ltd) Edify Energy
Ownership GSF substation Offtaker
50.01% Edify Energy 50MVA EnergyAustralia
49.99% Wirsol Energy (long-term bundled)
NMI
Construction
Management
Edify Energy NMI
Asset Management
Edify Energy
Services Agreement GESS GSF
EnergyAustralia 25MW / 50MWh 50MWAC
(long-term)
1.4.1 EnergyAustralia as operators
The revenues of GESS are wholly captured in the novel long-term BSSA between GESS and
EnergyAustralia. The BSSA entitles EnergyAustralia to full operational rights over GESS, as they relate to
charge and discharge decisions in both energy and FCAS markets. Accordingly, EnergyAustralia is the
Gannawarra Energy Storage System 11beneficiary of all market-linked revenues from GESS, which it receives in exchange for making fixed
payments to GESS.
The BSSA also provides EnergyAustralia with battery performance, availability and reliability commitments,
subject to operational constraints, mainly relating to cycling frequency and depths and dispatch capacity
limits relating to sharing a connection with the co-located solar farm. The battery purchase agreement
provides GESS with performance, availability and reliability commitments from Tesla. Figure 2 outlines
these arrangements.
Figure 2 Structure of the novel long-term services agreement with EnergyAustralia
Contracted return
• Operational rights
Purchase Agreement
Services Agreement
GESS ProjectCo • Performance
Pty Ltd • Availability
Warranty
• Reliability
• Fixed payments
• Operational
constraints
Gannawarra Energy Storage System 12OPERATIONAL REGIMES
Gannawarra Energy Storage System 132 Operational regimes
2.1 Services provided
As outlined in Section 1.4.1, EnergyAustralia is the registered market intermediary for GESS and is therefore
responsible for the bidding of the battery system with AEMO. GESS has been registered as both a
Scheduled Market Generator and a Scheduled Market Load in the NEM, and since July 2019 has been
registered in the regulation FCAS markets. In its second twelve months of operations, EnergyAustralia
trading teams have continued with a similar strategy to operational year one, that is, GESS’s primary use
case being energy arbitrage and providing regulation FCAS services.
The year began with a restriction on GSF of 25MW to manage post contingent voltage oscillation.
Consequently GESS was unrestricted in its operations with the ability to discharge its full capacity into the
grid (given the firm 25MW headroom available in the shared 50MW connection during this restriction period).
This constraint ceased on the 21/04/20 with transformer constraints again limiting discharge rates on GESS
based on GSF output and the shared 50MW connection.
As noted in the year one report, contingency FCAS is likely to create additional revenue opportunities for
GESS and give EnergyAustralia an additional tool to maximise value of the battery while keeping within
contractual limitations on cycles and SOC. At the time of writing, EnergyAustralia was working with Edify to
seek to register GESS in the contingency FCAS markets.
From an operations perspective, EnergyAustralia has continued to optimise GESS using human insight
(similar to the first 12 months) but is in the process of developing an automated trading tool to inform trading
desk decisions. As reported previously, this decision was driven by two primary considerations on
EnergyAustralia’s part:
1. A desire to use the battery as a learning tool to understand how flexibly it performs and responds and to
apply those learnings within a portfolio of other assets and to tune any future automation; and
2. Where market / price forecasts are highly accurate then auto bidding can be an optimal approach, but
many factors can change moving closer to dispatch intervals and specific market outcomes. For
instance:
– Demand / supply forecasts can deviate greatly, particularly with renewables playing a large part in the
variability of supply;
– Forced outages / de-ratings and lack of participant bidding until close to dispatch can cause auto
bidding to produce sub-optimal results especially around managing SOC where the expected high
price period of the day may evolve as the day progresses; and
– FCAS price forecasts can be inaccurate, so relying on a high level of FCAS related cycling without an
accurate forecast would be difficult.
On this basis, EnergyAustralia expects to continue to trade the battery with human bidding but will
increasingly inform those decisions with automated trading tools where it sees value in doing so. For
example, EnergyAustralia is looking to develop autobidding functionality that can trigger availability bids (of
0) when the battery’s SOC reaches upper or lower limits. This functionality could also be utilised to update
GESS availability to reflect the shared 50MW connection between GESS and GSF every 5 minutes.
At present GESS does not provide additional non-market services, however in accordance with the agreed
performance standards and the capability of the plant, we continue to scan for opportunities that a fast-
responding asset of this type can provide. As previously reported, we note that at present the GESS is
designed to:
Gannawarra Energy Storage System 14• Maintain its connection point power factor at unity whilst both charging and discharging, and regulate
power factor in co-ordination with GSF and in a manner that helps to support network voltages during
faults;
• Provide continuous uninterrupted operation within the frequency range 49.5-50.5Hz and in doing so
provide support during the period of containment after a generation or load contingency event has
occurred and contingency markets have recovered and stabilised the system frequency; and
• Utilise control system settings that are capable of providing for automatic increases or reductions in active
power for frequency excursions outside the normal operating frequency band, as well as ensuring power
system oscillations are adequately damped.
2.2 Financial performance
Although revenues are lower than operational year one, GESS has continued to perform well from a
revenue perspective in operational year two (see Figure 3 and Figure 4) primarily driven by FCAS revenues
exceeding the value expected in the initial business case. The average generation price for GESS between
March and August 2020 was $68/MWh, with an average charging price of $36/MWh. The average
generation price for GESS between September 2020 and February 2021 was $47/MWh, with an average
charging price of $20/MWh. With less volatile pricing in regulation markets, the GESS has generated
relatively more revenues from the energy market than in operational year one, but lower revenues in total
compared to year one.
Figure 3 Financial performance of GESS
2,000
1,800
1,600
1,400
Revenue ($'000)
1,200
1,000
800
600
400
200
-
March April May June July August 6-month
period
Energy market Raise regulation FCAS Lower regulation FCAS Contingency FCAS
Gannawarra Energy Storage System 152,000
1,800
1,600
1,400
Revenue ($'000)
1,200
1,000
800
600
400
200
-
September October November December January February 6-month
period
Energy market Raise regulation FCAS Lower regulation FCAS Contingency FCAS
From an energy market perspective, Figure 4 and Figure 5 outline the average operational profile in year 2
of GESS and trading interval prices in VIC respectively. The operation of GESS has been largely
unchanged from year one, that is, following energy market prices with morning and evening peak prices
corresponding to two discharge patterns in the day. As discussed further in Section 2.2.2, GESS is
predominantly charged in an early morning period, despite incurring network charges in doing so.
The VIC NEM price almost halved from 2019 to 2020 averaging $95/MWh and $52/MWh respectively. This
reduction has continued into 2021, with a year-to-date price of $22/MWh in the wholesale market. This
decline has reduced arbitrage revenues in the early months of 2021 as seen Figure 3. These reduced
averages are driven by range of factors, which include:
• Continued growth in new wind and solar generation capacity;
• Improved brown coal availability; and
• Reduced export capability to NSW.
These factors combined have meant greater instances of VIC / SA oversupply, particularly on weekends,
with the effect of reduced average spot prices.
Gannawarra Energy Storage System 16Figure 4 Average GESS operational profile by month8
25.0
20.0
15.0
Charge / discharge (MW)
10.0
5.0
-
(5.0)
(10.0)
(15.0)
1 3 5 7 9 11 13 15 17 19 21 23 25 27 29 31 33 35 37 39 41 43 45 47
March April May June July August 6-month period
25.0
20.0
15.0
Charge / discharge (MW)
10.0
5.0
-
(5.0)
(10.0)
(15.0)
1 3 5 7 9 11 13 15 17 19 21 23 25 27 29 31 33 35 37 39 41 43 45 47
September October November December January February 6-month period
8 30-minute periods 1 to 48, where period 1 commences 12:00am
Gannawarra Energy Storage System 17Figure 5 Average VIC trading interval prices by month9
250.0
200.0
Trading interval price ($/MWh)
150.0
100.0
50.0
-
(50.0)
1 3 5 7 9 11 13 15 17 19 21 23 25 27 29 31 33 35 37 39 41 43 45 47
March April May June July August 6-month period
250.0
200.0
Trading interval price ($/MWh)
150.0
100.0
50.0
-
(50.0)
1 3 5 7 9 11 13 15 17 19 21 23 25 27 29 31 33 35 37 39 41 43 45 47
September October November December January February 6-month period
9 30-minute periods 1 to 48, where period 1 commences 12:00am
Gannawarra Energy Storage System 18In its second year of operation, regulation revenues fell compared to the first year of operation, with FCAS
revenues averaging ~$150,000 per month between July 2020 to February 2021 which compares to
~$500,000 per month between July 2019 and February 2020.
Lower FCAS prices in VIC have been driven by similar factors to those discussed for energy prices.
However, some additional factors include:
• An increase in the available generation capacity providing FCAS;
• A commensurate reduction in the FCAS prices offered by participants; and
• A reduction in the demand for regulation services as a result of the introduction of mandatory primary
frequency response.
Figure 6 Average interval FCAS prices by month and service: March 2019 to February 2021
80.0
70.0
60.0
Price ($/MW/h)
50.0
40.0
30.0
20.0
10.0
-
3 4 5 6 7 8 9 10 11 12 1 2 3 4 5 6 7 8 9 10 11 12 1 2
2019 2020 2021
Regulation Raise Regulation Lower Contingency Raise 6s Contingency Raise 60s
Contingency Raise 5m Contingency Lower 6s Contingency Lower 60s Contingency Lower 5m
As previously reported, coordinated and stacked participation in both energy and FCAS markets is a key
feature of battery business cases. The FCAS market is an enablement market which means the battery can
be paid on enablement without dispatch. The actual FCAS dispatch is generally 5-10 times less than energy
dispatch. This means the same amount of energy stored can provide a longer duration enablement of
FCAS than in the energy market. FCAS participation therefore preserves battery cycling and energy
degradation limitations, while still ensuring revenue creation. GESS looks to optimise revenue between
energy and FCAS markets. During the peak hours, most of its generation is still directed toward the energy
market, which drives the regulation price up. Otherwise, when the system frequency behaviour cannot meet
the operational standard, AEMO increases the demand of regulation FCAS (i.e. volumes procured) to bring
the frequency back to the operational standard, which makes this market more profitable.
The facility has been designed to provide contingency FCAS and it can be enabled and switched on
remotely. The high-speed recording equipment is already there to validate its delivered performance. As
previously mentioned, EnergyAustralia is in the process of preparing a registration change application with
Gannawarra Energy Storage System 19AEMO to formalise delivery of the contingency FCAS service and hopes to have this operational over the
next 12 months.
2.2.1 Marginal and distribution loss factors
The application of losses to reference settlement for GESS back to the RRN is subject to one MLF and two
DLFs – one for the Gannawarra Solar Farm Network and one for Powercor’s Distribution Network10 – for its
generation and load. Given the short electrical distance between the interface of Powercor’s network and
GESS’s metering point, the AER has determined that a DLF of 1.0 is appropriate for the Gannawarra Solar
Farm Network. The MLFs and DLFs for the financial years ending June 2020 and June 2021 are indicated
in Table 3.
Table 3 MLF and DLFs for the reporting period
Loss factor Generation Load
FY 2019-20
MLF 0.9643 1.0191
Powercor DLF (DLF1) 0.9951 0.9951
Gannawarra Solar Farm Network DLF (DLF2) 1.0000 1.0000
MLF x DLF1 x DLF2 0.9596 1.0141
FY 2020-21
MLF 0.9793 0.9823
Powercor DLF (DLF1) 0.9901 0.9901
Gannawarra Solar Farm Network DLF (DLF2) 1.0000 1.0000
MLF x DLF1 x DLF2 0.9696 0.9726
2.2.2 Network charges and charging implications
As previously reported, the registered network that provides the interface for GSF and GESS with Powercor
is subject to DUOS charges imposed by Powercor. As GESS is the primary source of load, most of these
DUOS charges flow through to GESS. The network tariff allocated to the combined system is the
Subtransmission class, which is usually reserved for subtransmission customers (not generators). Prior to
the connection of GESS, GSF was subject to the Large Low Voltage tariff class, where maximum overnight
loads for auxiliary power consumption were low (in the order of 150kW) so this was not a material cost
impost. In contrast, the fixed and demand charges now imposed on GESS are considerable Table 4
outlines the tariffs for each of the ST and LLV Powercor tariff classes applicable in 2020 and the first half of
2021.
10 Reference NMI: 6203935735 with DLF code KGS
Gannawarra Energy Storage System 20Table 4 Powercor ST and LLV tariffs for 202011 and HY 202112
Charge Subtransmission Large Low Voltage
2020
Fixed ($ p.a.) 262,600 8,800
Demand ($/kVA p.a.) 26.26 119.99
Peak usage (c/kWh) 2.80 4.67
Off-peak usage (c/kWh) 0.85 2.47
HY 2021 (January to June 2021)
Fixed ($ p.a.) 250,000 8,000
Demand ($/kVA p.a.) 18.36 112.43
Peak usage (c/kWh) 1.75 3.85
Off-peak usage (c/kWh) 0.62 2.11
The EnergyAustralia imposed charging limit of 10MW has continued throughout year two of operations with
this value limiting the yearly demand charge incurred when charging from the grid, but still allowing the
battery to be used at times of no solar output (due to constraints, cloud cover, or maintenance). Largely a
default charging profile remains between ~00:00-06:00 AEST with the addition of the afternoon period
between ~09:00-17:00 AEST.
Further to the energy offers, raise regulation is also offered at a relatively low price as to incorporate another
value stream and potentially slow the charge rate when raise regulation is utilised. These default offers are
capped at 10MW availability and priced depending on the price / solar forecast for the upcoming day.
Consequently, they are adjusted late evening (for next day) and intra-day to where the best value can be
attained. Also, the availability of the load services can be increased depending on the solar farm output /
forecast for the day. Even with this inefficient restriction, the monthly DUOS cost imposed on GESS has
remained around $50k. In EnergyAustralia’s opinion, there is still an opportunity to improve the economics
of distribution connected battery storage projects. Energy storage facilities are not subject to network
charges if connected to the transmission network in Victoria because they tend to use the network at times
that are more helpful than a hindrance, which represents a more cost reflective and usage-based approach.
Table 5 summarises the evolution of revenues and costs and the financial performance of GESS for months
13 to 18 and Table 6 summarising months 19 to 24.
11https://media.powercor.com.au/wp-content/uploads/2019/11/13093923/Powercor-Pricing-Proposal-2020.pdf
12https://media.powercor.com.au/wp-content/uploads/2020/11/26113637/Powercor-HY-2021-Pricing-Proposal-
min.pdf
Gannawarra Energy Storage System 21Table 5 Summary of GESS financials from March to August 2020
Source of 6-month
March April May June July August
revenue / charge period
Pool revenue 69,249 54,378 67,646 135,889 162,739 119,418 609,318
Charging costs (57,116) (33,651) (46,387) (63,907) (102,567) (72,580) (376,210)
Ancillary service 232,885 218,975 207,637 155,090 172,043 188,021 1,174,652
revenue
DUOS charges (49,530) (52,178) (49,067) (53,273) (51,558) (55,148) (310,754)
Market fees (1,171) (1,241) (1,275) (1,364) (1,527) (1,470) (8,048)
Net 194,318 186,282 178,554 172,436 179,129 178,240 1,088,959
Table 6 Summary of GESS financials from September 2020 to February 2021
Source of
6-month
revenue / September October November December January February
period
charge
Pool revenue 79,026 139,988 105,727 106,024 85,417 36,435 552,616
Charging costs (36,845) (63,116) (48,944) (17,630) (19,057) (11,041) (196,633)
Ancillary service 192,282 206,373 196,283 113,599 73,331 94,672 876,540
revenue
DUOS charges (60,593) (43,767) (53,770) (44,867) (51,617) (28,363) (282,978)
Market fees (1,347) (1,578) (1,303) (1,923) (1,894) (872) (8,917)
Net 172,523 237,899 197,992 155,203 86,179 90,830 940,627
2.2.3 Avoided TUoS
Avoided TUoS is a payment to an embedded generator “for the amount of the local transmission charge that
would have been payable had the embedded generator not been connected to the distribution network”13.
As an embedded generator in Powercor’s distribution network, GESS, along with the co-located solar farm,
are eligible for avoided TUoS payments. The avoided TUoS payment amount in Powercor’s network is
calculated based on the average megawatts generated during the ten maximum demand days in Victoria
and the TUoS location price at the Kerang Terminal Substation.
In financial year 2019/20, this was approximately 4.7MW for GESS (which shares a connection with GSF),
multiplied by the TUoS locational price of approximately $39,000/MW. This translated to an avoided TUOS
payment of approximately $180,000 (excl. GST). It is worth noting that GSF also receives avoided TUoS
payments based on its generation during the ten maximum demand days. Given GSF has priority dispatch
13https://media.powercor.com.au/wp-content/uploads/2018/11/23170056/fact-sheet-avoided-transmission-
payments-to-embedded-generators.pdf
Gannawarra Energy Storage System 22through the shared connection, the avoided TUoS amount for GESS is lower than a stand-alone distribution
connect battery might have otherwise received at this location given the connection constraint.
2.3 Constraints on operation
A 25MW constraint placed on GSF’s output from 13/09/2019 continued through parts of this reporting period
(invoked constraint equation V_GANWRSF_FLT_25 implemented by AEMO to manage post contingent
voltage oscillations), which meant that the battery had unrestricted access to the network during these times.
This constraint was lifted on 21/04/2020 and as this occurred prior to diminishing solar output (moving into
winter) it allowed the default generator offer of 10MW to safely dispatch into the grid (dependant on price)
with the solar farm output not exceeding 40MW until August. The remainder of the reporting period required
the trading team to be more active in managing the transformer / solar farm constraint but more often than
not, with high solar / renewables output, prices remained suboptimal for generator dispatch during these
periods.
EnergyOffer (EA’s bidding system) will be upgraded mid-year, which will allow a direct feed of the solar farm
forecast to limit the battery generation prior to each dispatch interval, meaning there is improved potential to
fully utilise the transformer headroom while still allowing EnergyAustralia to remain compliant within its
bidding rules. Utilising the solar farm forecast to adjust the generator offer will also assist in optimising the
periods where sharp increases / decreases are witnessed when the sun rises / sets. Further to assisting
with generator offers, load offers can also be optimised by only charging when the solar farm is producing to
avoid increased network demand charges.
The issue that was highlighted on 1 March 2019 (Figure 7 below) where the inaccuracy of the solar forecast
reduced the efficiency of GESS’s dispatch and consequently lost revenue, did not re-occur during the
reporting period. With volatility kept to a minimum during the reporting period, only three trading intervals
were observed with prices above $1,000/MWh, all of which occurred during 0MW output from the solar farm.
Figure 7 Impact of forecast error on GESS dispatch
60 16,000
Significant difference
between GSF target and
actual dispatch
14,000
Export constraint
50
12,000
Dispatch / target (MW)
40 10,000
Price ($/MWh)
8,000
30
GESS could have utilised more of export constraint headroom 6,000
and dispatched a greater volume into high price periods had
the GSF forecast been more accurate during key periods
20 4,000
2,000
10
0
- -2,000
0:05 2:05 4:05 6:05 8:05 10:05 12:05 14:05 16:05 18:05 20:05 22:05
GESS dispatch GSF dispatch GSF target Price
Gannawarra Energy Storage System 23TECHNICAL PERFORMANCE
Gannawarra Energy Storage System 243 Technical performance
3.1 Technical performance
3.1.1 Cycle performance
GESS has operated with an average of one cycle per day since the beginning of March, for a total charge
energy of 10,510 MWh and discharge energy of 8,920 MWh for the 6-month period to August 2020, and
9,989 MWh and 8,267 MWh for the 6-month period to February 2021. Similar to the previous year, it is the
shoulder season leading into Summer that observed the greatest cycling behaviour. Table 7 summarises
the charge and discharge cycle outcomes for the 6-month period to August 2020 with Table 8 summarising
the 6-month period to February 2021.
Table 7 Charge and discharge cycle summary: March to August 2020
6-month
Parameter March April May June July August
period
Charge energy 1,584 1,423 1,644 1,809 2,122 1,928 10,510
(MWh)
Discharge energy 1,367 1,181 1,368 1,537 1,833 1,634 8,920
(MWh)
Cycle count 27 24 27 31 37 33 178
Cycles per day 0.9 0.8 0.9 1.0 1.2 1.1 1.0
Table 8 Charge and discharge cycle summary: September 2020 to February 2021
6-month
Parameter September October November December January February
period
Charge energy 1,840 2,096 1,603 1,756 1,567 1,127 9,989
(MWh)
Discharge 1,506 1,799 1,336 1,437 1,234 955 8,267
energy (MWh)
Cycle count 30 36 27 29 25 19 165
Cycles per day 1.0 1.2 0.9 0.9 0.8 0.7 0.9
As Figure 8 indicates, the round-trip efficiency for GESS averaged 84.9% for the 6-month period to August
2020 and 82.8% for the 6-month period to February 2021, fluctuating in a band between ~79-86%. Note this
round-trip efficiency calculation is made at the facility revenue meter based on observed aggregate energy
bought and sold into the market (i.e. aggregate discharge / aggregate charge). It is therefore inclusive of
balance of system losses and has not been adjusted for MLF. This is a different and more approximate
calculation than what would be undertaken for formal performance testing, which would stipulate standard
test conditions, including the power rating of the charge and discharge, and a defined period of time
between conducting the charge and discharge.
Gannawarra Energy Storage System 25Figure 8 Round-trip efficiency
12,000 88.0%
86.0%
10,000
Aggregate energy throughput (MWh)
84.0%
8,000 82.0%
Round-trip efficiency
80.0%
6,000
78.0%
4,000 76.0%
74.0%
2,000
72.0%
- 70.0%
March April May June July August 6-month
period
Charge Discharge Round-trip efficiency
12,000 88.0%
86.0%
10,000
Aggregate energy throughput (MWh)
84.0%
8,000 82.0%
Round-trip efficiency
80.0%
6,000
78.0%
4,000 76.0%
74.0%
2,000
72.0%
- 70.0%
September October November December January February 6-month
period
Charge Discharge Round-trip efficiency
Gannawarra Energy Storage System 26If we consider the charge and discharge cycle patterns of the system over the first two years of operations,
we can observe an average round-trip efficiency of approximately 85.0% (see Figure 9), noting the non-
standard test conditions nature of this analysis.
Figure 9 Round-trip efficiency and usage over two-year operational period
2,500 90.0%
Aggregate energy throughput (MWh)
2,000 85.0%
Round-trip efficiency
1,500 80.0%
1,000 75.0%
500 70.0%
- 65.0%
Jun-19
Jun-20
Aug-19
Sep-19
Feb-20
Aug-20
Sep-20
Feb-21
Oct-19
Dec-19
Oct-20
Dec-20
Mar-19
Jul-19
Nov-19
Jan-20
Mar-20
Jul-20
Nov-20
Jan-21
Apr-19
May-19
Apr-20
May-20
Charge Discharge Round-trip efficiency Average round-trip efficiency
3.1.2 Availability
The availability for GESS has also been high throughout the reporting period, with an average of >99% and
no lower than 97.4% inverter block availability recorded in all months (see Table 9 and Table 10).
Table 9 Inverter block availability: March to August 2020
6-month
Parameter March April May June July August
period
Availability 99.8% 100.0% 99.0% 99.8% 100.0% 98.5% 99.5%
Table 10 Inverter block availability: September 2020 to February 2021
6-month
Parameter September October November December January February
period
Availability 98.7% 100.0% 97.4% 100.0% 100.0% 99.7% 99.3%
Gannawarra Energy Storage System 273.2 Safety and environmental performance
GESS recorded no safety or environmental incidents in the 6-month period to August 2020 nor the 6-month
period to February 2021. This is not unexpected due to the nature of the facility as well as the workplace
health and safety policies adopted on site. As a company Edify is always targeting zero incidents for our
sites.
During the design of the battery system, elimination of risk has been adopted wherever possible, which is
the first principal of risk control. This has been done by eliminating the need for intervention by staff in the
operation of the facility as far as possible. The site is designed for fully unmanned operations meaning that
staff only attend site to respond to faults or to conduct preventative maintenance inspections. This avoids
the majority of safety and environmental risk with the facility.
Where staff are required to go to site, the operations and maintenance contractor responsible for oversite of
safety on the site has safety procedures in line with best industry practice. This includes ensuring that
correct isolations are in place for works to be undertaken and using lock-out procedures to prevent
unintended re-energisation. The O&M contractor reviews the work plans of any Tesla staff coming to site to
maintain the batteries which are maintained under a services agreement.
The safety record of the facility is also in large part to the inherent safety architecture aspects of the battery
system that includes:
• Individual cell testing prior to module assembly to ensure flawed cells are not introduced into the battery
system;
• Pods (collection of cells) are fully sealed to prevent thermal spread and have dedicated management
systems that monitor individual cells to ensure they are operated within safe parameters;
• Packs (racks of 16 pods) are contained in weather-proof steel enclosures with monitoring and operation
optimised to reduce the risk of cascading failure of pods;
• Compliance with national and international safety standards; and
• Exceedance of standards related to fire safety and propagation resistance to thermal runaway within
individual cells.
Tesla technicians perform all preventative maintenance and inspections of the battery system which ensures
that any issues are identified before they become a safety or environmental concern.
With two consecutive 12-month periods of no recorded safety or environmental incidents at GESS, its
performance in this regard has been high.
Gannawarra Energy Storage System 28You can also read


