Use of Blackboard Learning Management System: An Empirical Study of Staff Behavior at a South African University - Eurasia Journal of ...
←
→
Page content transcription
If your browser does not render page correctly, please read the page content below
EURASIA Journal of Mathematics, Science and Technology Education, 2018, 14(7), 3069-3082
                                                                     ISSN:1305-8223 (online) 1305-8215 (print)
OPEN ACCESS                                   Research Paper            https://doi.org/10.29333/ejmste/91623

   Use of Blackboard Learning Management System: An Empirical
        Study of Staff Behavior at a South African University
                                      Devraj Moonsamy 1, Irene Govender            1*

                                  1
                                      University of KwaZulu-Natal, Durban, SOUTH AFRICA

                          Received 26 March 2018 ▪ Revised 3 May 2018 ▪ Accepted 7 May 2018

              ABSTRACT
              This study explores the use of a Learning management system (LMS), Blackboard,
              among academics at a South African university of technology. Based on the literature
              and the Unified Theory of Acceptance and Use of Technology (UTAUT) model, four
              constructs which influence academics’ usage and behavioural intention to adopt LMS
              were considered: performance expectancy, effort expectancy, facilitating conditions,
              and social influence. Data was collected from 100 academics through a survey
              questionnaire, and correlations and regression was used to analyse the relationships.
              The results indicate that, facilitating conditions is the most influential factor explaining
              the usage of, and intention to use LMS among both users and non-users, while the set
              of variables, performance expectancy, effort expectancy, social influence, and
              facilitating conditions were not able to predict a significant amount of variance in
              intention to use LMS. Implications for practice are presented.

              Keywords: blackboard, facilitating conditions, performance expectancy, UTAUT, staff

                                                 INTRODUCTION
The past twenty years have seen increasingly rapid advances in the field of technology enhanced education and e-
learning initiatives. Students’ preference for new media which includes various web applications that use the
Internet as a platform (Montrieux, Vanderlinde, Schellens, & De Marez, 2015), indicates their inclination towards
learning that may take place in an “anytime/anyplace world, that is not constrained by time or place”. Furthermore,
students (usually under 25 years old) of today are referred to as digital natives – these digital natives are inclined
to interactive learning approaches which involve the use of group discussions, case studies, field studies, and
simulations among others (Sarkar, Ford, & Manzo, 2017). However, institutions of higher learning have
traditionally lectured face-to-face classes by making use of printed textbooks and many continue to do so. There
appears to be a misalliance between how teaching takes place in some higher education institutions and what the
digital natives expect the learning process to be. While the institutions are focusing on the process of educating,
digital natives are more concerned with the outcomes of education (Montrieux et al., 2015). Academic staff at higher
educational institutions need to change their approach to teaching in order to keep abreast with the technologically
savvy students they serve. Many higher educational institutions have and continue to invest in online learning
technologies to meet this expectation.
    At a time when almost all universities are moving towards e-learning and making extensive use of information
and communications technology (ICT) in teaching and learning, the University of Technology under study seems
to be lagging behind. With huge student enrolments and associated large classes, access to education is still
problematic for many students, despite the university’s investment in a Learning Management System (LMS) such
as Blackboard. Many students do not have access to computers and more specifically access to the internet at home,
but these are available on the university campus. However, recently, more and more students are acquiring smart
phones that are connected to the Internet (Sang, Chang, & Liu, 2016). Despite the availability of the LMS,
Blackboard, which has been in place at the institution for a considerable period of time – many staff have not used
the system. For the purposes of this study, ‘staff’ denotes academic staff.

© 2018 by the authors; licensee Modestum Ltd., UK. This article is an open access article distributed under the
terms and conditions of the Creative Commons Attribution License (http://creativecommons.org/licenses/by/4.0/).
   9041243@stu.ukzn.ac.za      govenderi4@ukzn.ac.za (*Correspondence)
Moonsamy & Govender / Use of Blackboard Learning Management System
Contribution of this paper to the literature
• The results of this study point to the need for strong support systems for academic staff at HEIs to adopt
LMS for effective teaching and learning.
• This study provides strong empirical confirmation that performance expectancy has a direct impact on
behavioural intention to use a LMS.
• Allocating more time for technology enhanced teaching in the teaching workload of staff is just as important
as having the infrastructure in place to influence behavioural intention and usage of the system.
With such a huge investment in time and money on acquiring and installing the LMS, Blackboard, it has become
necessary to understand how and to what extent these technologies are being used, and to determine the
perceptions of staff on the use of Blackboard. To this end, the study aims to investigate the perceptions of staff
towards the use of Blackboard in teaching and learning and subsequently to understand the reasons for the slow
adoption of Blackboard by staff. In order to determine the perceptions of staff, the research was guided by the
following research questions:
1. What are the perceptions of staff on the use of Blackboard?
2. To what extent does performance expectancy, effort expectancy, social influence and facilitating conditions
influence academics to use Blackboard?
In the next section an overview of the literature related to LMS and staff perceptions are explained, followed by
a description of the methodology used. Thereafter the analysis is presented followed by a discussion and
implications for practice.
LITERATURE REVIEW
Online Learning
In the last decade, the trend in education has been a move towards online instruction and “blended” instruction
which replaces components of face-to-face instruction. Poon (2013) considers blended learning to be the
combination of online and face-to-face learning. Blended instruction is often designed with the use of a learning
management system to facilitate teaching and learning (Govender & Mkhize, 2015).
In the late 1990s, a significant transition in e-learning emerged as a result of the introduction of Learning
Management Systems (LMSs). Among the popular examples of learning management systems are Blackboard,
Moodle, and WebCT which are designed to facilitate web based learning (Kulshrestha & Kant, 2013). A learning
management system (LMS) is a web enabled software platform designed to ensure efficient management and
delivery of learning materials to students (Govender & Govender, 2012). Communication tools that a LMS provides
enable easy interactions between lecturer and student and among students. LMSs enable various assessments such
as the online quizzes to give instantaneous feedback thus providing a rich learning environment. (Govender &
Govender, 2012). Learning management systems use the internet as its platform so as to enable students to access
the resources anywhere and at any-time thus overcoming location and time boundaries. A LMS offers much more
than simply facilitating access to resources, it enables interactive learning anytime and wherever the student
chooses. Therefore, it is not surprising that learning management systems are at the forefront of e-learning
initiatives in many Higher Education institutions (Heirdsfield, 2011). Furthermore, Kushrestha and Kant (2013)
established that the use of a LMS can be tailored according to the students’ specific learning styles and that e-
learning is “culture - independent” (p 1164).
Despite the popularity of online learning globally, Nielsen (2013) argues that some limitations are characteristic
of online learning, namely: the dropout rate of online learners is higher than that of a traditional class, online
learners feel isolated and overwhelmed in pursuing online courses, inadequate development of problem solving
skills, and reduced student interaction. In spite of the key advantage highlighted in Kushrestha and Kant’s study,
they also determined some inhibiters in the deployment of LMS – the availability of infrastructure, power and
access to computers. As an unintentional compromise, many institutions are using blended learning – incorporating
both online learning as well as traditional classroom learning – to overcome some of the limitations of exclusive
online learning. As a result a richer learning environment is created than either an online or traditional class can
achieve alone (Harding, Kaczynski, & Wood 2012). Blended learning in many institutions is facilitated by the use
of a learning management system that not only serves as a repository for online resources, but adds a virtual
dimension to traditional campus based studies (Heirdsfield 2011).
In the past the creation of an online learning environment meant that the instructor would have to create a web
site and have an in depth understanding of various web technologies and programming skills. However, with the
3070EURASIA J Math Sci and Tech Ed
advent of a learning management system this skill is no longer required and makes the task of creating online
learning environments simpler.
Use of Learning Management Systems
Learning management systems have impacted education to such an extent that the gap between distance
education and campus based education has narrowed significantly. Previously, distance education students felt
isolated and alone in pursuing their studies but this has changed with the advent of the LMS which provides many
tools as well as virtual classrooms that students can explore and thus be in contact with the lecturer as well as other
students (Heirdsfield 2011).
While many universities worldwide have adopted the use of a learning management system as a means of
implementing online or blended learning, this adoption is at the organisational level, and not necessarily at the
level of individual staff members.
Al-Busaidi and Al-Shihi (2010) add that the success of a learning management system at any institution first
starts with the acceptance of this technology by instructors and this in turn will promote students’ use of the LMS
in class. In a very recent study on LMSs among academic staff, Govender and Govender (2014) affirmed that the
successful implementation and adoption of an LMS begins with the academic staff embracing the use of the LMS
first.
According to research done by Waycott et al. (2010), staff at higher education institutions felt that there are a
number of benefits in using technology in teaching, namely: better communication, efficiency in facilitation of
lectures, immediacy of access to information, convenient access to resources, and sustained student engagement.
However, despite the many benefits highlighted, Salajan, Schönwetter, and Cleghorn (2010) revealed a number of
challenges in using ICT in higher education: an increase in staff workload, usability / technical issues, the loss of
face to face interaction, students’ unprofessional use of communication tools and institutions’ focus on technology
rather than on pedagogy.
Additionally, staff felt that the use of technology in their classes not only increased their workload, but also
gave students the impression that they are always available to answer questions. Other challenges were concerned
with usability and technical issues which include the difficulty in navigation when using certain tools of the
educational program. Interestingly, Waycott et al. (2010) found that staff were concerned about losing face-to-face
interaction with their students when using technologies in communicating with them, yet the key benefit of using
the technology is the range of communication tools available to facilitate communication among students and
lecturers. In spite of this benefit, Waycott et al. (2010) observed that students did not only make less use of these
tools, but made inappropriate comments on the discussion forums – totally unrelated to the subject at hand. They
further emphasized that the decision to implement technology at institutions is driven by the competitive pressure
among institutions in the use of technology rather than the inherent pedagogy that can be harnessed.
An understanding of the barriers to the adoption of a learning management system is just as important as the
influencers – these barriers can be turned into a motivator in the adoption of an LMS.
The lack of release time for staff to prepare learning material and maintain the online resources is seen as an
impediment to the adoption of e-learning (Anderson, 2012).
In his review of technology integration, Anderson (2012) indicated that staff incompetency is a major factor as
to why staff choose not to integrate technology into their teaching. His study showed that only 10 percent of staff
felt comfortable with incorporating technology into their teaching.
Another recent study conducted by Qamhieh, Benkraouda, and Amrane (2013) using Blackboard in an
introductory physics course at UAEU, has shown that not only did the interactions between students and
instructors improve and thereby improved students’ attitude towards physics, but also online assessment
improved physics learning. Blackboard assisted overall in teaching the course. Blackboard was found to be an
effective learning management system by both students and instructors.
In his analysis of staff use of LMS, Heirdsfield (2011) claimed that the interactive features of Blackboard
enhanced the learning experience, however, staff viewed face-to-face interactions in class as the most valuable
learning experience. In a study investigating the acceptance of LMS, Maina and Nzuki (2015) found that
performance expectancy, enabling infrastructures, support for training and ease of use influenced the acceptance
of E- learning Management Systems in higher education in Kenya.
Van der Merwe (2011) in his research on online learning performance using microeconomics students at a
university in Durban, South Africa, found that performance is significantly associated with the length of time a
student spends in the online classroom in addition to the marks he obtains for the online formative assessments.
This finding affirms a study conducted by Nyabana (2016) who reported improved performance of students who
frequently interacted with Blackboard.
3071Moonsamy & Govender / Use of Blackboard Learning Management System
In trying to understand the perceptions of staff at a University in New Zealand towards the use of Blackboard,
Missula (2008) found that the level of usefulness influences how often staff use Blackboard and how effectively
lecturers use course tools on Blackboard. Furthermore, the study revealed that IT experience of staff does not
influence the usage of Blackboard. However in a similar study conducted by Katunzi (2011) at a University in
Finland it was found that IT experience did influence the usage of Blackboard.
Much research points to the enhancement of teaching and learning using Blackboard. However, the research
findings emerged from different institutions using subjects from different cultures and computer backgrounds –
different from the students and staff at the university under study. Therefore, it would be useful to determine the
perceptions of staff towards the use of a LMS such as Blackboard in order to understand their behaviour in adopting
Blackboard.
The next section describes the framework used to analyse the data.
THEORETICAL FRAMEWORK
The Unified Theory of Acceptance and Use of Technology (UTAUT) model was chosen for this study, since
UTAUT explained approximately 70 percent of variance in behavioural intention to use technology in an
organizational context and about 50 percent of variance in the use of technology (Venkatesh et al. 2003).
The UTAUT model developed by Venkatesh et al. (2003) as presented in Figure 1, explains the users intentions
to use an information system and subsequent usage behaviour. UTAUT encompasses the eight previous models of
IT usage behaviour, including an additional construct called Facilitating Conditions to predict Behavioural
Intention to overcome the limitation of the TAM model. The theory states that four constructs are direct
determinants of user acceptance and usage behaviour when using an information system. As can be seen in Figure
1, the four constructs are: Performance expectancy, Effort expectancy, Social influence, and Facilitating conditions.
Performance
Expectancy
Behavioural Use
Intention
Behaviour
Effort
Expectancy
Social
Influence
Facilitating
Conditions
Experience Voluntariness of
use
Figure 1. UTAUT model adapted from Venkatesh et al. (2003)
Performance expectancy is defined as the degree to which one believes that using the information system will
assist one in doing one’s job.
Effort expectancy is defined as the degree of ease associated with the use of the system.
Social influence is defined as the degree to which an individual perceives that important others believe he or she
should use the new system.
Facilitating conditions are defined as the degree to which an individual believes that an organisational and
technical infrastructure exists to support the use of the system (Venkatesh et al., 2003).
According to Venkatesh et al. (2003) gender, age, experience and voluntariness of use are postulated to
moderate the influence of the four key constructs on usage intention and behaviour. For example, theory suggests
that women tend to be more sensitive to others’ opinions and therefore, find the social influence construct to be
3072EURASIA J Math Sci and Tech Ed
Table 1. Constructs and Their Measurement Items for Staff
Construct Measurement item
PE1- Blackboard enables me to improve the effectiveness of my lecturing
Performance Expectancy (PE) PE2- I can achieve more tasks quickly by using Blackboard
PE3 - Blackboard supports the pedagogical principles in my lecturing
EE1- I find Blackboard easy to use.
Effort Expectancy (EE)
EE2 – It is easy upload all the relevant material
FC 1- Management has supported my use of Blackboard.
FC 2- I have received training on the use of Blackboard.
FC 3- I have all the necessary resources to use Blackboard.
Facilitating Conditions (FC)
FC 4- The IT infrastructure supports my usage of Blackboard.
FC 5- I can call upon the assistance of a person or group at my campus if I am having difficulty
using Blackboard.
SI 1- People who are important to me think I should use Blackboard.
Social Influence (SI)
SI2 – My colleagues use Blackboard
BI1 - I may use Blackboard
Behavioural Intention (BI) BI2 – I intend using Blackboard
BI3- I will continue to use Blackboard
more salient when forming an intention to use new technology and this effect decreases with experience (Venkatesh
et al., 2003).
The UTAUT model was used in a study by Katunzi (2011) on the adoption of e-learning technologies at a
University. The aim of the study was to understand the factors that influence teachers’ adoption of a learning
management system. The four key constructs from the UTAUT model were used to investigate how well the set of
constructs is able to predict the intention to use the LMS. In this study, an additional construct of trust was added
to the framework. Perceived usefulness, facilitating conditions and a user’s gained experience were found to highly
influence a teacher’s decision to adopt an LMS. Perceived ease of use, social influence and trust were found to have
little impact on whether a teacher adopts an LMS (Katunzi, 2011). The construct trust was not included in the
current study due to the fact that Blackboard has not fully been adopted and no courses at the university are being
offered fully online. In a more recent study, Govender and Govender (2014) revealed that the four constructs from
the UTAUT model are correlated with the intention to use the LMS at different levels of significance. However,
unlike the study by Katunzi (2011) the construct facilitating conditions showed weak correlations with the intention
to use the LMS.
The two main objectives of the current research are to identify factors that positively influence the intention to
use Blackboard and to likewise identify factors that inhibit the use of the LMS Blackboard. In identifying these
factors the key constructs from the UTAUT model were used since the four key constructs are direct determinants
of the intention to use or not to use the specified innovation. For the purposes of this study, facilitating conditions
is associated with the intention to use Blackboard as proposed in Figure 1 because of the limited use of Blackboard
LMS in the institution.
In the current study, age, gender and voluntariness of use were not considered, since the number of male, and
female respondents were equivalent, and the results showed similar statistics regarding those who used and those
who did not use Blackboard. Similarly, the majority of respondents fell in the age category between 35 and 60 years;
hence gender and age were not considered in the model as indicated in Figure 1.
METHODOLOGY
Research Design
The research approach adopted in this study was primarily quantitative in nature, which was found to be most
effective in gathering data from the staff. The main research question was to determine how well the set of
constructs (shown in Table 1) is able to predict behavioural intention and subsequent usage of Blackboard. The
research questions were answered by using items of measurement for each of the constructs, PE, EE, SI and FC. A
self-administered questionnaire was used for the collection of data.
Population
The target population for this study was permanent academic staff from the five faculties of the university. A
total of 420 lecturers were surveyed. In order to accomplish the main objective of the study, respondents should be
computer proficient and have Internet access. This criteria allowed one to gain an informed perspective of the
3073Moonsamy & Govender / Use of Blackboard Learning Management System
participants’ perceptions of intention to use or their usage of the LMS. All academic staff members (that is the
population) are considered to be at least competent users of ICT and have access to the Internet. Hence, the selected
sample was therefore deemed useful for the study.
Sampling and Size of Sample
In this study, the researcher attempted to obtain responses from all lecturers from the various faculties. A
sample size of 196 was drawn from the population, which is considered representative of the population according
to Sekaran and Bougie (2013). In other words, a sample sizes of greater than 30 but less than 500 are appropriate
for most research in order to obtain a level of confidence and precision of our findings for the particular population.
However, 100 lecturers responded and completed the online questionnaire, yielding a response rate of 51percent.
Data Collection
The questionnaire was designed and pre-tested with five academic staff members at this institution, before
being distributed to all academic staff.
The questionnaires consisted of 5 sections which captured background information (demographical data),
perceptions of staff, computer proficiency, their use of course tools and general questions on LMSs. Additionally,
an open-ended question was included at the end to invite comments, in general, that might not have been captured
in the other sections of the questionnaire.
Staff perceptions towards the usage of Blackboard are elicited via the items of measurement for each of the
constructs shown in Table 1. The objective of these statements is to determine the perceptions of those staff
members that are using Blackboard in their teaching. This section contained eight questions. The four key constructs
from the research model was used to draw up the questions for this section. For each of the questions, five-point
Likert scales ranging from “Strongly Agree” to “Strongly Disagree” was used to rate their attitude towards the use
of Learning management systems.
Validity and Reliability
All of the themes (sub-sections) have values that exceed the acceptable standard. The overall reliability (0.963)
exceeds the recommended value of 0.70 (Sekaran, 2010). This indicates a high (overall) degree of acceptable,
consistent scoring for the research.
Data Analysis
Descriptive and inferential analysis was carried out using the Statistical Package for Social Sciences (SPSS).
Multiple regression analysis was performed to predict the dependent variable, intention to use or adopt
Blackboard.
ANALYSIS
The analysis of users of Blackboard is presented first, followed by the analysis of non-users of Blackboard. Table
2 indicates the demographical information of all the participants in the study.
3074EURASIA J Math Sci and Tech Ed
Table 2. Profile of Participants
Do you use Blackboard?
Yes No Total per category
Count Percent (%) Count Percent (%)
Male 8 42.1 41 50.6 49
Gender Female 11 57.9 40 49.4 51
Total 19 100 81 100 100
18 – 24 1 5.3 1 1.2 2
25 – 34 1 5.3 5 6.2 6
Age group 35 – 60 16 84.2 66 81.5 82
Above 60 1 5.3 9 11.1 10
Total 19 100 81 100 100
Junior Lecturer 2 10.53 0 0 2
Lecturer 13 68.42 51 69 64
Level Senior Lecturer 3 15.8 20 27 23
Professor / Associate
1 5.3 3 4 4
Professor
missing 7
0–5 4 21.05 8 9.9 12
6 – 10 4 21.05 13 16 17
11 – 15 4 21.05 18 22.2 22
Lecturing Experience
16 – 20 3 15.8 19 23.5 22
> 20 4 21.05 23 28.4 27
Total 19 100 81 100 100
I never used a
0 0.0 1 1.3 1
computer
Perceived Computer
I am a beginner 0 0.0 0 0 0
proficiency
Fairly knowledgeable 12 63.2 47 58 59
Very Proficient 7 36.8 33 40.7 40
Overall 81.5 percent (n=81 as indicated in Table 2) of all the participants between the ages 35 and 60 years do
not use Blackboard. This statistic could be attributed to the fact that they are much older than the digital natives
and may not be receptive to embracing new technology easily. A noteworthy aspect that may be observed from
Table 2 is that those who are lecturing for longer than 10 years do not use Blackboard. It is likely that staff are
resistant to change despite the fact that most academics (99%) have self-assessed themselves to be fairly
knowledgeable and proficient in computing.
The analysis for the users and non-users are presented in sections “Analysis of Blackboard Users” and “Analysis
of Non-Users of Blackboard” respectively.
Analysis of Blackboard Users
In this section, the responses of the users of Blackboard are analysed. The Likert scale of “strongly disagree”
and “disagree” were collapsed to show a single category of “Disagree”. A similar procedure was followed for the
levels of agreement (positive statements) to create brevity in the explanations. The results are first presented using
percentages for the variables that constitute each section. Results are then further analysed according to the
importance of the statements.
The influence of Performance Expectancy (PE) on staff use of blackboard
Approximately 80 percent of the respondents that use Blackboard for their teaching feel that Blackboard will
enable them to improve the effectiveness of their lecturing. However 10.5 percent feel that Blackboard will not
improve the effectiveness of their lecturing despite their use of Blackboard for teaching. Yet, about 79 percent of
the respondents that use Blackboard feel that they can achieve more tasks quickly by using Blackboard.
Approximately 68.4 percent of the respondents feel that Blackboard supports the pedagogical principles in their
lecturing. It is likely why they are using it to teach.
A significant number of respondents are in agreement with the statements, “Blackboard enables me to improve
the effectiveness of my lecturing”, “I can achieve more tasks quickly by using Blackboard”, and “Blackboard
supports the pedagogical principles in my lecturing”.
3075Moonsamy & Govender / Use of Blackboard Learning Management System
These statements are designed to measure performance expectancy. These statements are indicative of lecturers’
willingness to use Blackboard in their teaching.
According to the UTAUT model the gender and age variables moderates the impact of performance expectancy
on behavioural intention, however, in this study, no significant relationship was found to exist between the items
of measurement for performance expectancy and gender and age.
The influence of Effort Expectancy (EE) on staff use of blackboard
The one sample t-test for the construct effort expectancy resulted in t(18) = 1.379, p= 0.185. The observed
difference between the agreement and disagreement for this construct was not significant. Table 3 provides the
frequencies of the Likert scale item for this construct. This statement measured effort expectancy and is indicative
of lecturers’ willingness to use Blackboard in their teaching.
It is interesting to note that even though these participants are using Blackboard, the effort in using Blackboard
is not overwhelmingly positive since only about 58 percent of the respondents agree that Blackboard is easy to use
(Table 3). A possible explanation for this result may be the lack of adequate support.
The Social Influences (SI) that instigate the adoption of blackboard
As can be seen in Table 4 a total of about 47 percent of the respondents that use Blackboard have indicated that
people who are important to them think that they should use Blackboard. The low percentage appears to indicate
that social influence is not an important factor that influences Blackboard users.
The Facilitating Conditions (FC) that influence the use of blackboard
According to the UTAUT model the facilitating conditions influences usage behaviour of a system. Of the 19
respondents that are using Blackboard to teach, about 89 percent (Table 5) have received training to use Blackboard.
Table 3. Ease of Use of Blackboard
Frequency Percent Valid Percent Cumulative Percent
Strongly disagree 2 2.0 10.5 10.5
Disagree 2 2.0 10.5 21.1
Neutral 4 4.0 21.1 42.1
Valid
Agree 9 9.0 47.4 89.5
Strongly agree 2 2.0 10.5 100.0
Total 19 19.0 100.0
Table 4. People who are Important to Me Think I Should use Blackboard
Frequency Percent Valid Percent Cumulative Percent
Strongly disagree 1 1.0 5.3 5.3
Disagree 1 1.0 5.3 10.5
Neutral 6 6.0 31.6 42.1
Valid Agree 3 3.0 15.8 57.9
Strongly agree 6 6.0 31.6 89.5
Don’t know 2 2.0 10.5 100.0
Total 19 19.0 100.0
Missing System 81 81.0
Total 100 100.0
Table 5. Blackboard Training
Frequency Percent Valid Percent Cumulative Percent
Neutral 2 2.0 10.5 10.5
Agree 7 7.0 36.8 47.4
Valid
Strongly agree 10 10.0 52.6 100.0
Total 19 19.0 100.0
Missing System 81 81.0
Total 100 100.0
3076EURASIA J Math Sci and Tech Ed
Table 6. I Have All the Resources to Use Blackboard
Frequency Percent (%) Valid Percent (%) Cumulative Percent (%)
Disagree 2 2.0 10.5 10.5
Neutral 8 8.0 42.1 52.6
Valid Agree 5 5.0 26.3 78.9
Strongly agree 4 4.0 21.1 100.0
Total 19 19.0 100.0
Missing System 81 81.0
Total 100 100.0
Table 7. The IT Infrastructure Supports My Use of Blackboard
Frequency Percent (%) Valid Percent (%) Cumulative Percent (%)
Strongly disagree 1 1.0 5.3 5.3
Disagree 3 3.0 15.8 21.1
Neutral 7 7.0 36.8 57.9
Valid
Agree 5 5.0 26.3 84.2
Strongly agree 3 3.0 15.8 100.0
Total 19 19.0 100.0
Missing System 81 81.0
Total 100 100.0
Table 8. Blackboard Support
Frequency Percent (%) Valid Percent (%) Cumulative Percent (%)
Strongly disagree 1 1.0 5.3 5.3
Disagree 3 3.0 15.8 21.1
Neutral 2 2.0 10.5 31.6
Valid
Agree 8 8.0 42.1 73.7
Strongly agree 5 5.0 26.3 100.0
Total 19 19.0 100.0
Missing System 81 81.0
Total 100 100.0
The chi-square test reveals that “Level of lecturer” was found to correlate with the item (“I have received
training on the use of Blackboard”), which means that the more senior a staff member is, the more likely he would
have gone for Blackboard training.
About 47 percent of the respondents feel that they have all the necessary resources to use Blackboard (Table 6).
Since only 10.5 percent of the respondents that use Blackboard have disagreed with the statement: “I have all the
resources to use Blackboard”, it suggests that respondents have sufficient resources to use Blackboard.
Only about 42 percent (Table 7) of the respondents that use Blackboard agree that the IT infrastructure supports
their usage of Blackboard. The frequencies of the agreement and disagreement in Tables 5-8 for the statements that
measure facilitating conditions suggest that there is neither significant agreement nor disagreement that the IT
infrastructure supports the respondents’ use of Blackboard. It is thus likely that respondents are not entirely
satisfied with the IT infrastructure at the institution and this may require further investigation.
There seems to be a reasonable amount of Blackboard support among the lecturers (Table 8) with approximately
68 percent reporting that they can call upon the assistance of a person or group at their campus if they are having
difficulty using Blackboard. To determine to what extent the four constructs in Table 1 predict usage of Blackboard,
(continued usage in this case), it was decided to construct a regression model with the four constructs (Table 1) as
independent variables, and usage as a dependent variable.
First, Pearson’s correlation analysis was performed indicating that while usage is positively correlated with the
four (4) constructs (PE, EE, SI and FC), it was however, not significantly correlated. The independent constructs
were correlated with each other (some significantly) as is apparent in Table 9. Table 9 shows the inter-correlations
among the four independent constructs and the dependent construct (BI).
3077Moonsamy & Govender / Use of Blackboard Learning Management System
Table 9. Correlations of the Four Constructs For Users of Blackboard
PEpos EEPos SIPos FCPos Usage
Pearson Correlation 1 .731** .364 .520* .242
PEpos Sig. (2-tailed) .000 .126 .022 .317
N 19 19 19 19 19
Pearson Correlation .731** 1 .597** .549* .253
EEPos Sig. (2-tailed) .000 .007 .015 .295
N 19 19 19 19 19
Pearson Correlation .364 .597** 1 .476* .257
SIPos Sig. (2-tailed) .126 .007 .039 .288
N 19 19 19 19 19
Pearson Correlation .520* .549* .476* 1 .348
FCPos Sig. (2-tailed) .022 .015 .039 .144
N 19 19 19 19 19
Pearson Correlation .242 .253 .257 .348 1
Usage Sig. (2-tailed) .317 .295 .288 .144
N 19 19 19 19 19
**. Correlation is significant at the 0.01 level (2-tailed).
*. Correlation is significant at the 0.05 level (2-tailed).
Facilitating conditions (FC) seemed to have strong association with effort expectancy where r = 0.549 and
p=0.015< 0.05. This association may be explained in part by the fact that the effort required to use the system is
strongly influenced by the conditions that prevail, such as technical, pedagogical and support from management.
Similarly facilitating conditions (FC) are strongly associated with performance expectancy (PE) where r = 0.520
and p = 0.022 < 0.05. This positive association may be due to the fact that if the facilitating conditions for using the
system are in place such as, adequate training and support for using the system, then it is likely that more use of
the system would result which in turn will influence the performance expectancy (PE). Performance expectancy
(PE) seems to be strongly correlated with effort expectancy where r = 0.731 and p=0.000 < 0.05. It is expected that if
one finds the system easy to use then the system lends itself to being used or adopted which in turn is likely to
influence performance expectancy (PE).
More importantly, facilitating conditions have the highest correlation with the dependent variable, usage, but
is not significant, where r = 0.348 and p= 0.144> 0.05. According to Pallant (2010) in order to perform a multiple
regression analysis, the independent variables should correlate with each other with a correlation of not greater
than 0.7 and the independent variables should correlate with the dependent variable with at least 0.3. Based on
these results, and the fact that the sample size for the users of Blackboard was small, it was not worthwhile to
conduct a multiple regression analysis on the set of variables.
Let us now turn to the analysis of non-users of Blackboard.
Analysis of Non-Users of Blackboard
A study of the perceptions of lecturers who do not use Blackboard will assist in gaining a better understanding
of the slow adoption rate of Blackboard.
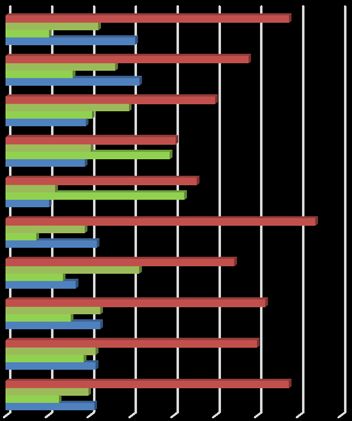
Figure 2 shows the perceptions and experiences of Blackboard of the cohort of participants who do not use
Blackboard.
3078EURASIA J Math Sci and Tech Ed
67.6
Blackboard supports the pedagogical… 10.3
58.0
I can call upon the assistance of a person… 15.9
50.0
The IT infrastructure supports my usage… 20.6
40.6
I have all the necessary resources to use… 39.1
45.6
I have received training on the use of… 42.6
73.9
People who are important to me think I… 7.2
54.5
Management has supported my use of… 13.6
62.0
I find Blackboard easy to use 15.5
60.0
I can achieve more tasks quickly by using… 18.6
67.6
Blackboard will enable me to improve… 12.7
0.0 10.0 20.0 30.0 40.0 50.0 60.0 70.0 80.0
Agree Neutral Disagree Percent
Don't Know
Figure 2. Ratings of staff perceptions of Blackboard
The influence of performance expectancy (PE) on intention to use Blackboard – a significant number of staff
members who are not using Blackboard have agreed with the items that measured performance expectancy, that is
Blackboard enables them to improve the effectiveness of their lecturing, they can achieve more tasks quickly by
using Blackboard, and Blackboard supports the pedagogical principles in my lecturing.
The influence of effort expectancy (EE) – Figure 2 indicates that 62 percent of staff who do not use Blackboard
perceive the use of Blackboard to be easy to use.
The social influences (SI) that instigate the adoption of Blackboard – a significant number (73.9%) of staff who are
not using Blackboard have agreed with the statement “People who are important to me think I should use
Blackboard” (Figure 2).
It would appear that social influence would positively affect non-users intention to use Blackboard.
The facilitating conditions (FC) that influence the use of Blackboard - Only 13.6 percent of the respondents that
are not using Blackboard felt that Management has not supported their use of Blackboard, which implies that there
is fairly good Blackboard support from management.
Approximately 46 percent of the staff that are not using Blackboard have received training on Blackboard and
were in agreement with the statement: “I have received training on the use of Blackboard.” However, about 43
percent disagreed with this statement which implies that they have not received training on Blackboard.
Approximately 39.1 percent of the respondents felt that they do not have all the resources to use Blackboard.
This is close to the number of respondents that felt they have all the resources to use Blackboard which is about 41
percent. The reason for the small difference could be due to the difference in their perceived computer proficiency.
Half the number of staff that are not using Blackboard feel that the IT infrastructure supports their usage of
Blackboard. There seems to be an adequate amount of Blackboard support with 58 percent of the respondents
agreeing with the statement: “I can call upon the assistance of a person or group at my campus if I am having
difficulty using Blackboard.”
Multiple regression analysis for non-users
In order to answer the second research question, to what extent do the four constructs of the PE, EE, SI and FC
contribute to the variance of the criterion variable “intention to use”, multiple regression analysis was conducted.
3079Moonsamy & Govender / Use of Blackboard Learning Management System
Table 10. Model Summary
Change Statistics
Adjusted R Std. Error of the
Model R R Square R Square Sig. F
Square Estimate F Change df1 df2
Change Change
1 .408a .166 .152 1.019 .166 11.971 1 60 .001
a. Predictors: (Constant), FC
Table 11. Coefficients of predictor variable(s)
Unstandardized Standardized
Correlations
Model Coefficients Coefficients T Sig.
B Std. Error Beta Zero-order Partial Part
(Constant) .583 .510 1.144 .257
1
FC .553 .160 .408 3.460 .001 .408 .408 .408
a. Dependent Variable: IU
The values for intention to use Blackboard (IU) was coded using a Likert scale based on the comments given in
the open-ended questions, where 1= No intention to use Blackboard, 2= May use Blackboard, 3= Neutral, 4= intend
using Blackboard and 5= Have a strong intention to use Blackboard.
Stepwise multiple regression was then performed to assess the ability of the four constructs, performance
expectancy (PE), effort expectancy (EE), social influence (SI) and facilitating conditions (FC) to predict intention to
use or adopt the learning management system, Blackboard. Note that multiple regression was set to exclude cases
listwise variables. Hence, from the sample of 81 (non-users), SPSS analysed the data from only 62 participants who
had no missing values. Tables 10 and 11 show the results obtained from the regression analysis
The final model (Table 10) to emerge from the stepwise analysis contains only one predictor variable, facilitating
condition (FC) in the first step as shown in Table 11, where adjusted R square = 0.152; F(1, 62) = 11.97, p = 0.001
(using the stepwise method).
The three constructs, performance expectancy (PE), effort expectancy (EE) and social influence (SI) were not
significant predictors in this model. The analysis indicated weak correlations between behavioural intention to use
Blackboard and the independent variables, performance expectancy, effort expectancy, and social influence. In this
study, the regression model accounts for only a small percentage (15%) of variance in the dependent variable
(intention to use), that is, the model explains 15 percent of the variance. It would appear that the model is significant,
where p=0,001, in which facilitating conditions appeared to be the best predictor of intention to use Blackboard.
However, this finding still did not explain the slow adoption of Blackboard.
On examining the responses from the open-ended question, an interesting theme emerged, time required to
attend training and set up courses in Blackboard. This may account for the slow adoption of Blackboard. The
excerpt from one of the respondents reflects this interpretation.
Most lecturers are required to spend an inordinate amount of time doing administrative work and
engaging in compliance-related activities which contribute very little to truly improving the quality of
education at …. This leaves little time for anything creative or innovative regarding academic work
DISCUSSION
The study has shown that the majority of the participants were fairly knowledgeable and proficient in
computing, a precursor for the adoption of a LMS. Interestingly, for both users and non-users of Blackboard, the
results show that the three constructs, PE, EE, and SI were weakly correlated with behavioural intention. However,
while facilitating conditions (FC) were moderately correlated with behavioural intention for Blackboard users, FC
was significantly correlated with behavioural intention for the non-users of Blackboard. Furthermore, multiple
regression analysis revealed that FC is the predictor of intention to use Blackboard. This result has implications for
practice. From the items used to measure perceptions of staff as indicated in Figure 2, it would appear that the
figures show that they are largely positive about the use of Blackboard. Additionally, the independent constructs
were correlated with each other (some significantly) as is apparent in the Table 9.
Facilitating conditions (FC) seemed to have strong association with effort expectancy. This association may be
explained in part by the fact that the effort required to use the system is strongly influenced by the conditions that
prevails, such as support from management.
Similarly facilitating conditions (FC) were also strongly associated with performance expectancy (PE). If the
facilitating conditions for using the system are all in place, such as adequate training and support for using the
3080EURASIA J Math Sci and Tech Ed
system, then it is likely that the result thereof is more usage of the system which in turn leads to the system assisting
one in one’s job.
Performance expectancy (PE) seems to be strongly correlated with effort expectancy. This relationship may be
explained due to the fact that if one finds the system easy to use then this results in one using the system which
then assists one in doing one’s job.
Most importantly facilitating conditions were found to have the highest correlation with the dependent variable,
usage, which was significant for the non-users. This finding broadly supports the work of Kulshrestha and Kant
(2013), although different aspects of facilitating conditions were identified in their study. While most items that
measured facilitating conditions were positive, the adoption rate is low. On closer examination of the write in-
comments from the open-ended question revealed an important aspect – Time required to attend Blackboard
training and to set up an online classroom was not enough. Huge workloads emerged as not having sufficient time
to be innovative.
SUGGESTIONS FOR FUTURE RESEARCH
The study has revealed that a large percentage of staff respondents who have undergone Blackboard training
are currently not using the LMS for teaching and learning. Some staff who have been for Blackboard training have
also subsequently migrated to an alternate LMS and indicated that Blackboard is not user friendly and difficult to
use. Thus it will be interesting to research the usability of Blackboard since this could be a reason as to why some
staff have migrated to an alternate LMS such as Moodle.
LIMITATIONS
The response rate was lower than expected; hence a higher rate of response might result in a better prediction
of the influencing factors. The sample size was smaller than planned for which could affect the results. Hence these
findings may not be generalisable to a broader range of staff or institutions.
CONCLUSION
The study identified factors that influence the adoption of Blackboard by academic staff at the institution by
considering the constructs from the UTAUT model – performance expectancy, effort expectancy, social influence
and facilitating conditions. Notwithstanding the relatively limited sample, this work offers valuable insights into
the adoption of a LMS. One of the more significant findings to emerge from this study is that facilitating conditions
need to be addressed for the successful adoption and use of Blackboard, consistent with Kulshrestha and Kant’s
(2013) study with some variation in the items of ‘facilitating conditions’. Time to learn, set up courses online and
continual support during the use of Blackboard emerged as key findings. These views surfaced mainly in relation
to the high workloads that staff carry. Academic staff – both users and non-users of Blackboard – were found to be
in agreement that Blackboard will enable them to improve their teaching and learning. This study produced results
that are similar to that of Maina and Nzuki’s (2015) findings regarding positive impact of performance expectancy
on intention to use Blackboard. It is therefore vital that a concerted effort is required from management in
supporting academic staff in the use of the LMS, Blackboard. These findings have implications for management to
implement a structured support programme to assist staff in developing and using the LMS efficiently.
REFERENCES
Al-Busaidi, K. A., & Al-Shihi, H. (2010). Instructors’ Acceptance of Learning Management Systems: A Theoretical
Framework. https://doi.org/10.5171/2010.862128
Anderson, C. (2012). Barriers and enablers to teachers’ adoption of online teaching at an Australian University
(Unpublished Phd. Thesis), RMIT University, Australia.
Govender, I., & Govender, D. (2014). Faculty perceptions about using a learning management system: a case study.
Progressio, 36(1), 34-52.
Govender, I., & Govender, D. (2012). A constructivist approach to a programming course: Students’ responses to
the use of a Learning Management System. African Journal of Research in MST Education, 6(2), 238-252.
https://doi.org/10.1080/10288457.2012.10740742
Govender, I., & Mkhize, M. (2015). E-Learning in Place of Face-to-face Lectures: An Exploratory Study of Students’
Perceptions. Alternation, 22(1), 183-203.
3081Moonsamy & Govender / Use of Blackboard Learning Management System
Harding, A., Kaczynski, D., & Wood, L. (2012). Evaluation of blended learning: analysis of qualitative data. In
Proceedings of The Australian Conference on Science and Mathematics Education (formerly UniServe Science
Conference), Australia, 2012, 56-62.
Heirdsfield, A. (2011). Blackboard as an online learning environment: What do teacher education students and staff
think? Australian Journal of Teacher Education, 36(7), 1-16. https://doi.org/10.14221/ajte.2011v36n7.4
Katunzi, D. M. (2011). Towards adoption of e-learning technologies at Lappeenranta University of Technology: The factors
influencing teachers’ understanding of the Blackboard learning system (Unpublished Master’s dissertation), Saint
Petersburg State University.
Kulshrestha, T., & Kant, A. R. (2013). Benefits of Learning Management System (LMS) in Indian education.
International Journal of Computer Science & Engineering Technology (IJCSET), 4(8), 1153-1154.
Maina, M. K., & Nzuki, D. M. (2015). Adoption Determinants of e-learning management systems in institutions of
higher learning in Kenya: A case of selected universities in Nairobi Metropolitan. International Journal of
Business and Social Science, 6(2).
Missula, S. (2008). Staff Perceptions of Blackboard as an Online Tool in Tertiary Education. Master of Computing, Unitec
New Zealand.
Montrieux, H., Vanderlinde, R., Schellens, T., & De Marez, L. (2015). Teaching and Learning with Mobile
Technology: A Qualitative Explorative Study about the Introduction of Tablet Devices in Secondary
Education. PLoS ONE, 10(12), e0144008. https://doi.org/10.1371/journal.pone.0144008
Nielsen, S. M. (2013). “Half Bricks and Half Clicks”: Is Blended Onsite and Online Teaching and Learning the Best
of Both Worlds? In Plakhotnik, M.S. & Nielsen, S.M., ed. Proceedings of the Seventh Annual College of Education
Research Conference: Urban and International Education. Miami, 2008. Florida International University, 105-110.
Nyabana, R. F. (2016). Technology in Learning: Blackboard Usage & its impact on academic performance: A case of
universities in Lesotho. International Journal in Humanities and Management Sciences, 4(5), 455-461.
Pallant, J. (2010). Statistical techniques to explore relationships among variables survival manual (4 ed.). England: Open
University Press.
Poon, J. (2013). Blended Learning: An Institutional Approach for Enhancing Students’ Learning Experiences. Merlot
Journal of Online Learning and Teaching, 9(2), 271-288.
Qamhieh, M., Benkraouda, N., & Amrane, M. (2013). The Use of Blackboard in Teaching General Physics Courses.
Educational Research, 4(8), 569-573.
Salajan, F. D., Schönwetter, D. J., & Cleghorn, B. M. (2010). Student and faculty inter-generational digital divide:
Fact or fiction? Computers & Education, 55(2010), 1393-1403. https://doi.org/10.1016/j.compedu.2010.06.017
Sang, Y.-T., Chang, K.-E., & Liu, T.-C. (2016). The effects of integrating mobile devices with teaching and learning
on students’ learning performance: A meta-analysis and research synthesis. Computers & Education, 94, 252-
275. https://doi.org/10.1016/j.compedu.2015.11.008
Sarkar, N., Ford, W., & Manzo, C. (2017). Engaging Digital Natives through Social Learning. Systemics, Cybernetics
and Informatics, 15(2), 1-4.
Sekaran, U., & Bougie, R. (2013). Research Methods for Business: A Skill Building Approach. USA: John Willey and Sons
Inc.
Van der Merwe, A. (2011). Can online learning boost academic performance? A microeconomics Study. International
Business & Economics Research Journal (IBER), 10(8), 45-56. https://doi.org/10.19030/iber.v10i8.5377
Venkatesh, V., Morris, M. G., Davis, G. B., & Davis, F. D. (2003). User acceptance of information technology: Toward
a unified view. MIS Quarterly, 27(3), 425-478. https://doi.org/10.2307/30036540
Waycott, J., Bennett, S., Kennedy, G., Dalgarno, B., & Gray, K. (2010). Digital divides? Student and staff perceptions
of information and communication technologies. Computers & Education, 54(4), 1202-1211.
https://doi.org/10.1016/j.compedu.2009.11.006
http://www.ejmste.com
3082You can also read