Yearly operation of a building-integrated microcogeneration system in south Italy: energy and economic analyses - Oxford Academic Journals
←
→
Page content transcription
If your browser does not render page correctly, please read the page content below
Yearly operation of a building-integrated
                  microcogeneration system in south Italy:
                  energy and economic analyses
                  ..............................................................................................................................................................

                                  G. Ciampi, A. Rosato* and S. Sibilio
                                  Dipartimento di Architettura e Disegno Industriale ‘Luigi Vanvitelli’, Seconda Università
                                  degli Studi di Napoli, via San Lorenzo, Aversa, CE 81031, Italy
                                  .............................................................................................................................................
                                  Abstract

                                                                                                                                                                                   Downloaded from https://academic.oup.com/ijlct/article-abstract/9/4/331/656004 by guest on 31 March 2020
                                  This article investigates the yearly operation of a building-integrated micro-cogeneration system through
                                  transient simulations; both energy and economic performance of the proposed system are analyzed and
                                  compared with those of a conventional system based on separate energy production in order to assess the
                                  potential savings. The energy comparison is carried out in terms of primary energy with respect to the
                                  specific Italian electricity mix; the economic analysis is performed by considering both the operating and
                                  capital costs, with the energy unit costs as well as the incentives for supporting the cogeneration
                                  technology evaluated according to the Italian scenario.

                                  Keywords: MCHP; cogeneration; energy saving; economic analysis; TRNSYS
*Corresponding author:
antonio.rosato@unina2.it          Received 24 July 2013; revised 13 September 2013; accepted 14 September 2013
................................................................................................................................................................................

1. INTRODUCTION                                                                           both expensive and time consuming, the simulation approach is
                                                                                          usually preferred for studying cogeneration suitability [9, 10].
The building sector is characterized by large primary energy                                  Several studies evaluated the performance of systems on micro-
consumption [1]. Therefore, the Italian government adopted a                              cogeneration units located in Italy. Arteconi et al. [11] developed
State Law [2] which enforces severe limits of thermal transmit-                           a model to design, assess and optimize micro-generation plants
tances for walls and windows in order to reduce the energy                                from the energy, environmental and economic viewpoints. The
demand; on the supply side, micro-cogeneration (defined as the                            model was tested in an Italian residential application in order
combined production of electrical and thermal energy from a                               to compare different micro-cogeneration technologies. They
single fuel source, with electric output lower than 50 kW [3]) is                         found that, with respect to the conventional system, the micro-
a well-established technology considered as one of the most ef-                           cogeneration device fueled by natural gas allows for reducing both
fective options to save primary energy as well as reduce green-                           the primary energy consumption (from 10 up to 25%) and the
house gas emissions [3– 5]. The MicroMap project reported that                            annual CO2 emissions (from 5 up to 20%). Caresana et al. [12]
in Europe between 5 and 12.5 million dwellings could have                                 modeled an automotive-derived internal combustion engine co-
MCHP systems installed by 2020 [6]. Among the several tech-                               generation system (fueled by natural gas and characterized by
nologies being developed for micro-cogeneration, reciprocating                            28 kW as nominal electric output) with the aim to compare con-
internal combustion engine-based cogeneration systems are                                 stant and variable speed operation modes; typical residential and
usually the best choice for small-scale cogeneration applications                         service sector applications were chosen as test cases, and the simu-
[5, 7 –9], thanks to their well-proven technology, robust nature                          lation results were discussed from an energy and economic point
and reliability.                                                                          of views. The technical economic analysis showed that good
   The opportunity to use micro-cogeneration systems depends                              energy and economic performances compared with a separate
strongly on factors such as heat and power demand variations,                             generation system can be achieved both in household and in hotel
control modes, capacity and efficiency of the residential cogener-                        applications, especially with variable speed operation. Cardona
ation system, as well as electricity import/export conditions and                         and Piacentino [13] developed a numerical model to simulate a
modes. Taking into considerations that experimental analyses are                          fuel cell cogeneration system coupled with a thermal energy

International Journal of Low-Carbon Technologies 2014, 9, 331–346
# The Author 2013. Published by Oxford University Press.
This is an Open Access article distributed under the terms of the Creative Commons Attribution Non-Commercial License (http://creativecommons.org/licenses/
by-nc/3.0/), which permits non-commercial re-use, distribution, and reproduction in any medium, provided the original work is properly cited. For commercial
re-use, please contact journals.permissions@oup.com
doi:10.1093/ijlct/ctt074 Advance Access Publication 21 October 2014                                                                                          331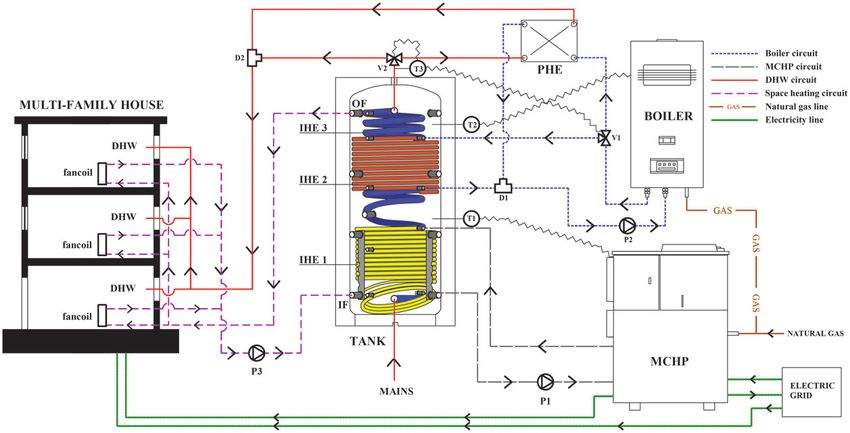
G. Ciampi et al.

storage, in accordance with the energy requirements of a single-         into account and their influence on the economic performance of
family residence. They found that the fuel cell cogeneration             the proposed system was also estimated, highlighting the relevance
system is able to guarantee about 8% primary energy saving with          of each single support mechanism among those adopted by the
regards to a conventional system composed of a natural gas               Italian Government. If compared with the Ref. [24], the investiga-
furnace for space heating, a natural gas water heater and an elec-       tion was also extended by considering the multifamily house
tric air conditioning unit for space cooling. The authors [14]           located in the city of Milano (north of Italy) in order to take into
compared the performance of a micro-cogeneration unit operated           account the fact that both thermal loads and energy unit costs
under electric load-following logic with a conventional system           strongly depend on the region of Italy where the building is
based on separate energy production from an energy, exergy and           located.
environmental point of view upon varying the efficiency of the               The simulation results were used to compare the performance
reference plant. The analysis was performed by assuming a resi-          of the proposed system with those of a conventional system com-
dential daily electric demand profile derived from experimental          posed of a natural gas-fired boiler (for thermal energy produc-

                                                                                                                                                 Downloaded from https://academic.oup.com/ijlct/article-abstract/9/4/331/656004 by guest on 31 March 2020
data and the results highlighted that, in comparison to the con-         tion) and a power plant mix connected to the central grid (for
ventional plant, the micro-cogeneration system is characterized by       electricity production) with the main aim to assess the suitabil-
lower carbon dioxide emissions and larger primary energy con-            ity of the plant under investigation with respect to the systems
sumption and irreversibilities. Additional studies were performed        based on separate energy production in terms of both primary
in several other countries, such as Belgium [15], Germany [16],          energy consumptions and costs.
United Kingdom [17, 18], Switzerland [19] and Canada [20, 21].               In Section 2, the proposed MCHP-based system is described
The above-mentioned works demonstrated that, if designed and             in detail, while the reference system is depicted in Section 3;
operated correctly, the micro-cogeneration technology has the po-        Section 4 shows the results of the energy performance assess-
tential to simultaneously reduce the use of fossil fuels, the emis-      ment, while the economic analysis is reported in Section 5.
sions of pollutants and the operating costs in comparison to other
conventional supply systems.
    In this article, the performance of a residential building-          2. DESCRIPTION OF THE PROPOSED
integrated micro-cogeneration system was simulated by using the          SYSTEM
dynamic simulation software TRNSYS [22] with a simulation
time step equal to 1 min. The proposed system basically consists         Figure 1 shows the scheme of the system configuration analyzed
of a 6.0-kWel internal combustion engine-based MCHP unit                 in this study. The plant basically consists of a micro-cogeneration
fueled with natural gas [23], a natural gas-fired boiler devoted to      device (MCHP), an auxiliary boiler, a combined storage tank
the auxiliary thermal energy supply, and a combined storage tank         with three internal heat exchangers (IHE1, IHE2, IHE3), a plate-
storing heat for both heating purposes and domestic hot water            fin heat exchanger (PHE), three pumps (P1, P2, P3), three
production. The plant was coupled with a three-dwelling multi-           thermostats (T1, T2, T3), two three-way valves (V1, V2), two flow
family house compliant with the Italian Law [2] in terms of              diverters (D1, D2) and a group of fan-coils installed within the
thermal transmittance values of both walls and windows.                  building.
    The plant under investigation in this work was already investi-          The system under investigation is devoted to satisfy the space
gated by the authors in Ref. [24], but the analyses were limited to      heating sensible thermal load associated to the heating season as
the energy point of view by considering the system operating only        well as the yearly demands of both domestic hot water and elec-
during the heating period imposed by the Italian Law [25] with           tricity.
the building located in the city of Naples (south of Italy). This            According to the Italian Law [25], Italy is divided into six dif-
article extended the study of the proposed system to the whole           ferent climatic zones (named A, B, C, D, E, F) based on the
year in order to take into account the energy consumption asso-          heating degree days (HDD) index [26]; in this study the building
ciated to the domestic hot water production out of the heating           is located in two different Italian cities representative of two dif-
season. Taking into consideration that a micro-cogeneration              ferent Italian climatic zones:
system would require a higher investment for the user if compared
with the conventional separate production of heating and electri-        † Napoli (latitude: 408500 N; longitude: 148150 E; HDDs ¼ 1034;
city, in this work a detailed analysis of operating costs was also         climatic zone ¼ C);
performed in addition to the energy performance assessment: the          † Milano (latitude: 458280 N; longitude: 98100 E; HDDs ¼ 2404;
unit costs associated to both natural gas and electric energy as           climatic zone ¼ E).
well as the revenue from selling the electric energy surplus were
assumed according to the Italian scenario. Both capital and main-        The heating purposes and domestic hot water production are satis-
tenance costs were also considered and the Simple Pay-Back               fied by heating up the water contained within the tank. The MCHP
(SPB) period (i.e. the number of years required to recover the in-       system and natural gas-fired boiler cooperate in order to guarantee
vestment cost) was calculated. The Italian policy instruments for        a given water temperature level (558C) within the hot water
supporting the diffusion of cogeneration technology were taken           storage; the group of fan-coils is supplied by the combined tank.

332 International Journal of Low-Carbon Technologies 2014, 9, 331– 346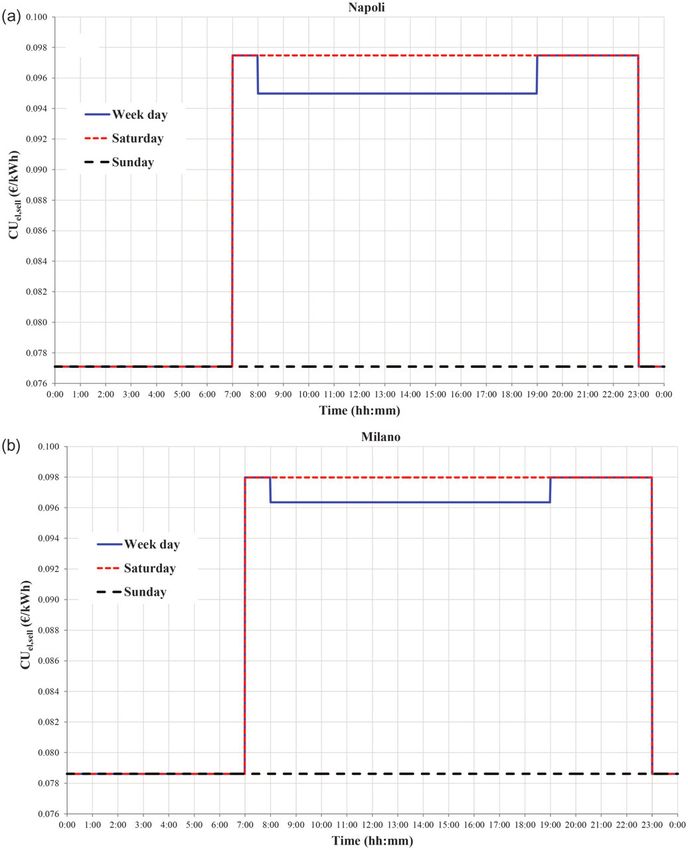
Yearly operation of a building-integrated micro-cogeneration system

                                                                                                                                                          Downloaded from https://academic.oup.com/ijlct/article-abstract/9/4/331/656004 by guest on 31 March 2020
Figure 1. Scheme of the proposed system.

    According to the European Standard EN12831:2003 [27],            Table 1. Time intervals during which the indoor air temperature is
208C was assumed as set-point indoor air temperature. The            controlled.
Italian Law [25] limits the operation time of heating systems        Week day                                       Weekend day
during the winter season depending on the Italian region where
the building is located: according to Ref. [25], the set-point       Napoli                  Milano                 Napoli                Milano
indoor air temperature is controlled only during the below-          7:30–11:00               6:30–12:00             8:30–11:00            8:30– 13:30
specified periods:                                                   15:00– 21:30            14:30–23:00            15:00–22:30           14:30– 23:30

† Napoli: from 15 November to 31 March;
† Milano: from 15 October to 15 April.                               main features of the Types used in this study are reported.
                                                                     Additional details can be found in Refs. [28, 29].
A maximum daily operation time for the heating system de-
pending on the climatic zone is also specified in Ref. [25]; as a
consequence, the indoor air temperature was controlled only          2.1 Combined tank
during the time intervals specified in Table 1: out of these time    The combined tank was modeled by means of the Type60f
intervals, the indoor air temperature was not controlled.            included in TRNSYS library. This model allows to calculate
   Domestic hot water is produced by means of the IHE3               thermal stratification in the component: in this study, 10 tem-
located in the tank; in the case of the temperature of the water     perature levels (nodes) were used in the tank; a uniform tank
exiting IHE3 is lower than 458C, the required additional heat is     loss coefficient per unit area equal to 3.0 kJ/hm2 K was assumed
provided by the auxiliary natural gas-fired boiler and transferred   [30]. A vertical cylindrical hot water storage unit with one flow
to the domestic hot water by means of the plate heat exchanger       inlet and one flow outlet was considered: the cold water coming
PHE.                                                                 from the building enters the tank through the flow inlet IF, while
   The electricity generated by the cogeneration device is used      hot water going toward the fan coils installed within the building
directly into the building for the lighting systems, domestic        exits the tank through the flow outlet OF. The tank was equipped
appliances, and auxiliaries or is exported to the electric grid,     with three IHEs: the hot water coming from the MCHP unit
which is also used to cover peak demand.                             flows through the IHE located in lower part of the tank (IHE1 in
   Each component of the whole system was simulated by using         Figure 1); the hot water coming from the natural gas-fired boiler
the software TRNSYS [22], where each physical piece is dynam-        goes toward the IHE located in upper part of the tank (IHE2 in
ically modeled with a component (named ‘Type’) that is a             Figure 1); the third IHE (IHE3 in Figure 1) allows heat to be
FORTRAN source code model. In the following sections the             extracted for domestic hot water production.

                                                                          International Journal of Low-Carbon Technologies 2014, 9, 331– 346 333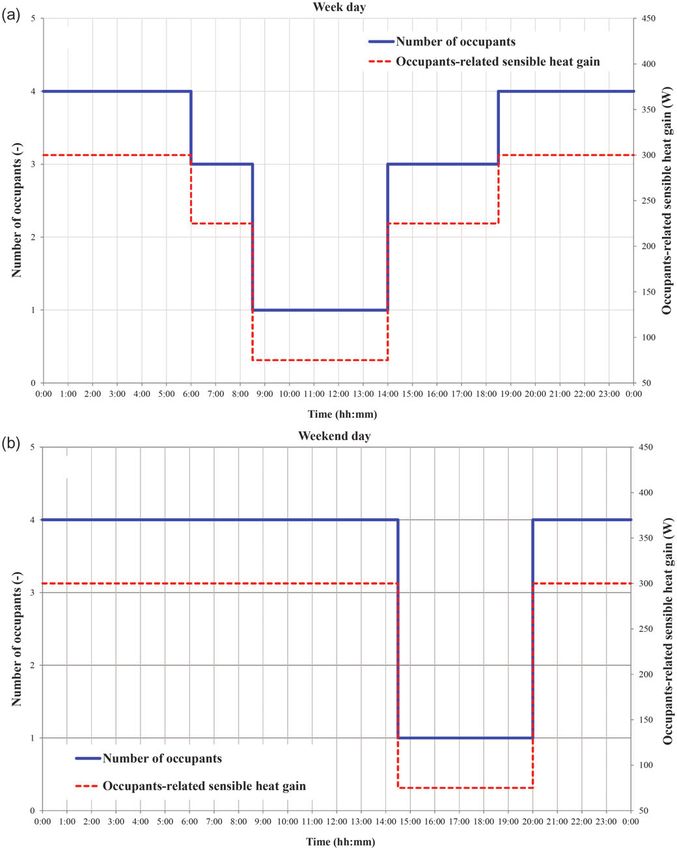
G. Ciampi et al.

Table 2. Main characteristics of the analyzed hot water storage [31].         Table 3. Main characteristics of the MCHP unit [23].
                   3
Tank volume (m )                                                      0.855                                           AISIN SEIKI unit
Tank height (m)                                                       2.040
Height of flow inlet (m)                                              0.125   Model                                   GECC60A2 (NR-P)
Height of flow outlet (m)                                             1.691   Engine type                             Reciprocating internal combustion
Temperature levels used in the tank                                  10                                               engine, water cooled, four cycles,
Tank loss coefficient (kJ/h m2 K)                                     3.0                                             three cylinders
Destratification conductivity (kJ/h mK)                               0       Displacement (cm3)                      952
Number of internal heat exchangers                                    3       Speed revolution (rpm)                  160041800
Height of thermostat controlling the MCHP (m)                         0.816   Fuel                                    Natural gas, LPG
Height of thermostat controlling the boiler (m)                       1.836   Generator type                          Permanent: magnet type, synchronous
The fraction of glycol contained in the IHE1 by volume (%)            0                                               generator 16 poles
IHE1 inside diameter (m)                                              0.027   Rated electric output (kW)              6
IHE1 outside diameter (m)                                             0.029   Rated thermal output (kW)               11.7

                                                                                                                                                            Downloaded from https://academic.oup.com/ijlct/article-abstract/9/4/331/656004 by guest on 31 March 2020
IHE1 total surface area (m2)                                          3.1     Operating sound at 1.0 m distance and   54
IHE1 length (m)                                                      37.0     1.5 m height (dB)
IHE1 wall conductivity (W/mK)                                        45       Electric efficiencya at maximum         28.8
IHE1 material conductivity (W/mK)                                    45       load (%)
Height of IHE1 inlet (m)                                              0.813   Thermal efficiencyb at maximum          56.2
Height of IHE1 outlet (m)                                             0.144   load (%)
The fraction of glycol contained in the IHE2 by volume (%)            0         a
                                                                                 Ratio between electric output and primary power input.
IHE2 inside diameter (m)                                              0.026     b
                                                                                 Ratio between heat supplied to the end-user and primary power input.
IHE2 outside diameter (m)                                             0.028
IHE2 total surface area (m2)                                          2.5
IHE2 length (m)                                                      30.5     the tank near the exit of the IHE1: when this temperature is
IHE2 wall conductivity (W/mK)                                        45
IHE2 material conductivity (W/mK)                                    45
                                                                              lower than the set-point value (558C), the unit provides its
Height of IHE2 inlet (m)                                              1.521   maximum electric and thermal outputs; when the water tem-
Height of IHE2 outlet (m)                                             1.048   perature in the storage exceeds the set-point value, the unit is
The fraction of glycol contained in the IHE3 by volume (%)            0       turned off. The electricity generation is a by-product.
IHE3 inside diameter (m)                                              0.023       The Italian Law does not limit the daily operation time of co-
IHE3 outside diameter (m)                                             0.025
IHE3 total surface area (m2)                                          7.8
                                                                              generation systems: as a consequence, in this study, the MCHP
IHE3 length (m)                                                     106.5     unit was allowed to operate up to 24 h per day depending on
IHE3 wall conductivity (W/mK)                                        16       thermal requirement. The cogeneration unit was simulated by
IHE3 material conductivity (W/mK)                                    16       using the detailed dynamic model [32, 33] developed within the
Height of IHE3 inlet (m)                                              0.108   Annex 42 of the International Energy Agency. This model was
Height of IHE3 outlet (m)                                             1.703
                                                                              calibrated and validated for the MCHP unit [23] on the basis of
                                                                              several laboratory tests performed by the authors [34, 35] at the
                                                                              Built Environment Control Laboratory of the Seconda Università
   In Ref. [24], a sensitivity analysis was performed by consider-            degli Studi di Napoli. During the experiments, the transient and
ing three different tank volumes (0.855, 0.738 and 0.503 m3),                 steady-state operation of the cogeneration system was experimen-
and the simulation results showed the best performance for the                tally investigated upon varying the electric level, the coolant tem-
hot water storage characterized by the largest volume; the main               perature as well as the coolant flow rate. The experimental tests
characteristics of this tank are reported in Table 2 [31].                    showed that the values of thermal efficiency measured during
                                                                              transient operation were significantly lower than those measured
2.2 MCHP unit                                                                 during steady-state operation. The analysis of the tests also indi-
A 6.0-kWel reciprocating internal combustion engine-based                     cated that both electrical and thermal efficiencies are strongly
micro-cogeneration unit [23] was investigated; the main charac-               affected by the electric output of the unit: in particular, the experi-
teristics of this device are reported in Table 3. Even if the MCHP            ments showed a thermal efficiency increasing at decreasing the
system under investigation can operate under both electric and                electric output, and an electric efficiency increasing with increas-
thermal load-following control strategies; in this study, only the            ing the electrical power. The measurements were compared with
thermal load-following operation was considered; this is a conse-             the simulation data in order to empirically validate the calibrated
quence of the fact that in Ref. [24], the energy performance as-              Annex 42 model; the data measured during a 24-h dynamic test
sessment of the proposed system was performed by considering                  performed by applying a realistic daily load profile representing
both MCHP control logics, showing that the thermal load-                      the Italian domestic non-HVAC demand profile for a multifamily
following operation can guarantee better results than the electric            house of five dwellings were used: the predicted fuel use, the elec-
load-following operation. In the case of thermal load-control                 tric output and heat recovery over the whole duration of the
strategy, the system operates according to the external tempera-              dataset differed from measured values by 26.1, 20.2 and
ture signal coming from the thermostat T1 (Figure 1) placed on                21.0%, respectively.

334 International Journal of Low-Carbon Technologies 2014, 9, 331– 346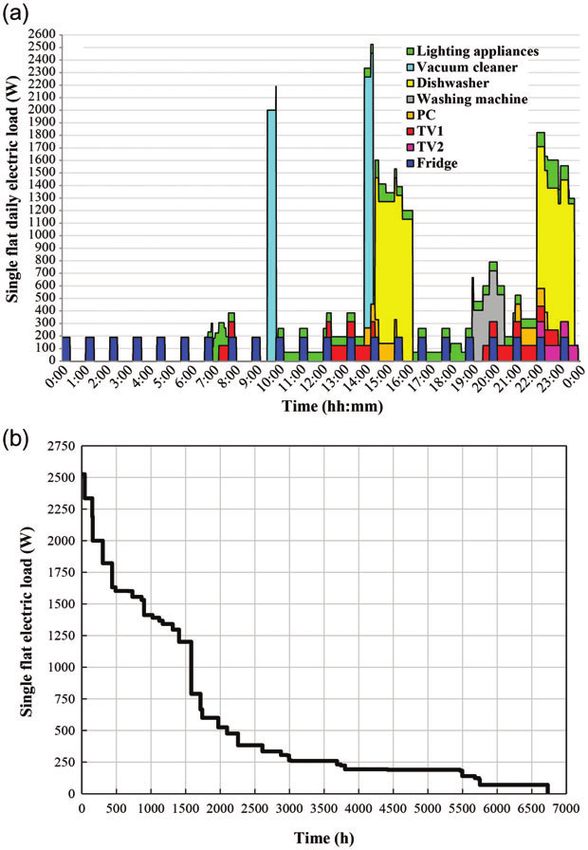
Yearly operation of a building-integrated micro-cogeneration system

2.3 Boiler
A 20.0-kWth natural gas-fired boiler [36] was selected and
modeled in TRNSYS by using the Type6 included in TRNSYS
library. This system is activated only in the case of (i) the water
temperature within the tank (sensed by the thermostat T2 in
Figure 1) is lower than a given set-point value (558C), or when
(ii) the domestic hot water temperature at the outlet of the IHE3
(sensed by the thermostat T3 in Figure 1) is lower than 458C.
    The manufacturer [36] suggests 0.924 as boiler efficiency for
a part load ratio equal to 30% and 0.927 as boiler efficiency in
the case of operation at rated output. Therefore, the boiler effi-
ciency hSPB is evaluated by considering a linear interpolation of

                                                                                                                                                            Downloaded from https://academic.oup.com/ijlct/article-abstract/9/4/331/656004 by guest on 31 March 2020
the manufacturer data:

              hSP                       SP
               B ¼ 0:924 þ 0:000214  ðPth;B  6:0Þ                ð1Þ

The primary power consumption of the boiler is evaluated as
follows:
                                      SP
                             SP
                                     Pth;B
                            Pp;B ¼                                 ð2Þ    Figure 2. Main geometrical characteristics of a single flat of the multifamily
                                     hSP
                                      B                                   house.

As above-mentioned, a maximum daily operation time for the
heating system depending on the climatic zone is specified in                 The main characteristics of building windows are reported in
Ref. [25]; as a consequence, the boiler is allowed to operate only        Table 5: in particular, the internal (hi) and external (he) convect-
during the time intervals specified in Table 1; out of these              ive and radiative heat transfer coefficients of windows, frame
periods, the boiler was turned off for heating purposes. The boiler       thermal transmittance Uframe, glazing thermal transmittance
is allowed to operate up to 24 h per day in the case of thermal           Uglazing, window type, glazing width, spacing width, spacing gas,
energy is required for producing domestic hot water at 458C.              ratio between frame area Aframe and window (glazing þ frame)
                                                                          area Awindow are specified. As it can be derived from Table 5, the
                                                                          thermal transmittance of each window is equated to the given
2.4 Building characteristics and loads                                    threshold values; values of Uframe and Uwindow are calculated
The geometrical layout of the building is basically a multiplica-         based on the European Standard EN ISO 10077 – 1 [39]; all
tion of a single-family house-type building geometry. The main            windows are provided with shadings, whose zone and wall re-
geometrical characteristics of each single flat as well as the build-     flection coefficients are considered equal to 0.5. According to
ing orientation are shown in Figure 2. All floors have the same           the Italian Law [40], the area of each window is defined as the
useable floor area (96.0 m2), while the net height of each single         12.5% of the ground area of the room where the window is
flat is 3.0 m. Five windows are considered for each single floor.         located.
    Starting from 1 January 2010, the Italian Law [2] specifies the           Heat coming from occupants, personal computers and light-
threshold values of thermal transmittance for both walls and              ing systems is assumed to contribute to the internal gains of the
windows of renovated buildings depending on (i) the climatic              building. Figure 3 shows both the number of occupants of each
zone where the building is located, and (ii) the wall type (exter-        single flat and the occupants-related sensible heat gain of each
nal wall, ground and roof ). These threshold values of thermal            single flat as a function of the time during a week day
transmittance Ulim for property renovations located in Napoli             (Figure 3a) and a weekend day (Figure 3b); sensible heat coming
and Milano are specified in Tables 4 and 5.                               from each occupant was assumed equal to 75.0 W: this values is
    In Table 4, the characteristics of building walls considered in       suggested by the Standard ISO 7730:2005 [41] in the case of
this study are also specified: in particular, the internal (hi) and ex-   light work/typing as degree of activity.
ternal (he) convective and radiative heat transfer coefficients of            Figure 4 shows the sensible heat flux associated to the lighting
walls, wall thermal transmittance (Uwall ), layers material, thickness    appliances installed within the rooms of each single flat; light
(s), density (r), specific heat (c) and thermal conductivity (l ) are     sources with an installed total electric capacity of 294.0 W are
reported for each wall type. As it can be derived from Table 4, the       considered; thermal power coming from each lighting system is
thermal transmittance of each wall is equated to the given thresh-        assumed equal to the 75% of its nominal electric capacity.
old values. The values of hi and he are derived by the European           Sensible heat produced by lighting systems is considered as
Standard EN ISO 6946 [37], while the values of r, c and l are             transferred to the indoor air by both radiation (70%) and con-
defined based on Italian Standard UNI 10351:1994/EC [38].                 vection (30%) [42].

                                                                               International Journal of Low-Carbon Technologies 2014, 9, 331– 346 335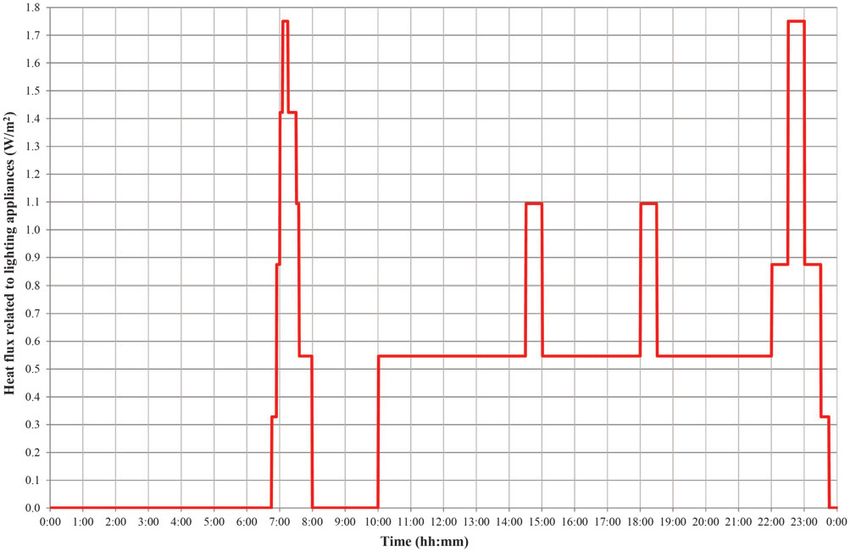
G. Ciampi et al.

Table 4. Characteristics of building walls.
Wall type         Ulim (W/m2 K) hi (W/m2 K) he (W/m2 K) Uwall (W/m2 K) Layer materials                    s (m)            r (kg/m3) c (kJ/kg K) l (W/mK)

External wall Napoli ¼ 0.40        7.7           25.0          Napoli ¼ 0.40   Gypsum plaster           0.02                900        1.00          0.250
              Milano ¼ 0.34                                    Milano ¼ 0.34   Bricks                   0.33               1800        0.84          0.720
                                                                               Expanded polyester       Napoli ¼ 0.070       20        1.20          0.041
                                                                                                        Milano ¼ 0.088
                                                                               Gypsum plaster           0.02                900        1.00          0.250
Roof              Napoli ¼ 0.38   10.0           25.0          Napoli ¼ 0.38   Gypsum plaster           0.015              1800        1.00          0.700
                  Milano ¼ 0.30                                Milano ¼ 0.30   Cement and bricks        0.300              1000        0.84          0.300
                                                                               Concrete                 0.084              1900        0.84          1.060
                                                                               Bitumen                  0.010              1200        1.00          0.170
                                                                               Expanded polyester       Napoli ¼ 0.052       20        1.20          0.041
                                                                                                        Milano ¼ 0.080

                                                                                                                                                                   Downloaded from https://academic.oup.com/ijlct/article-abstract/9/4/331/656004 by guest on 31 March 2020
                                                                               Sand                     0.050              1700        0.84          1.400
                                                                               Lime and cement adhesive 0.010              1500        1.00          0.720
                                                                               Tiles                    0.010              2300        0.84          0.720
Ground            Napoli ¼ 0.42    5.9           25.0          Napoli ¼ 0.42   Tiles                    0.010              2300        0.84          0.720
                  Milano ¼ 0.33                                Milano ¼ 0.33   Lime and cement adhesive 0.010              1500        1.00          0.720
                                                                               Sand                     0.050              1700        0.84          1.400
                                                                               Expanded polyester       Napoli ¼ 0.040       20        1.20          0.041
                                                                                                        Milano ¼ 0.067
                                                                               Bitumen                  0.005              1200        1.00          0.170
                                                                               Concrete                 0.077              1900        0.84          1.060
                                                                               Bricks                   0.300              1000        0.84          0.300
                                                                               Gypsum plaster           0.015              1800        1.00          0.700

Table 5. Characteristics of building windows.
            Ulim (W/m2 K)   hi (W/m2 K)   he (W/m2 K)   Uframe        Uglazing   Window type        Glazing       Spacing      Spacing gas    Aframe/Awindow (%)
                                                        (W/m2 K)      (W/m2 K)                      width (mm)    width (mm)

Napoli      2.6             7.7           25.0          2.94          2.54       Double glazing     6             16           Argon          15
Milano      2.2                                         6.56          1.53                          4             15

    In order to take into account the sensible thermal load asso-                from this figure, the maximum thermal load is 31.7 kW: this
ciated to the air infiltration, the European Standard EN 12831:2003              value is set in TRNSYS simulations as the sum of the thermal
[27] is used to calculate the air exchange rate, i.e. the number of in-          output of the boiler of the proposed system (20.0 kWth) and the
terior volume air changes that occur per hour, induced by wind                   maximum thermal output of the MCHP unit (11.7 kWth).
and stack effect on the building envelope: based on this European                    The yearly domestic hot water demand profile with an
Standard, the air exchange rate is assumed equal to 0.28 h21.                    average basic load of 200 l/day in the time scale of 1 min speci-
    The internal gains coming from occupants, personal compu-                    fied within IEA-SHC Task 26 [44, 45] is used in this study.
ters and lighting appliances for the whole building are generated                Figure 6 reports the hot water demand – duration diagram of
through the superposition of the single-flat profiles, with no dif-              each single flat, with the domestic hot-water flow rates sorted in
ference between Napoli and Milano.                                               descending order. In this article, the domestic hot water demand
    A temperature difference of 58C was assumed for the hot                      profile of the whole building is generated through the superpos-
water crossing the fan coils, with a variable-flow pump control-                 ition of the single-flat profile; no difference between Napoli and
ling the fan coils outlet temperature.                                           Milano is considered.
    The Type56a (included in TRNSYS library) was used for                            Figure 7a highlights the daily electric demand profile result-
modeling the building envelope, indoor air set-point tempera-                    ing from the operation of both lighting systems and other do-
ture, infiltration and internal gains. Type15-6 (included in                     mestic appliances (such as vacuum cleaner, dishwasher, washing
TRNSYS library) was used for reading the external EnergyPlus                     machine, PC, TVs, fridge) of each single flat; the electric con-
weather data file [43] of Naples.                                                sumptions of each appliance are derived by Ref. [46]. The daily
    Figure 5 reports the whole building sensible thermal load-                   electric demand profile of the whole building is defined through
duration diagrams obtained from simulations, with the heat-                      the superposition of the single-flat profile reported in Figure 7a,
demand values sorted in descending order. As it can be derived                   with no difference between Napoli and Milano. The electric

336 International Journal of Low-Carbon Technologies 2014, 9, 331– 346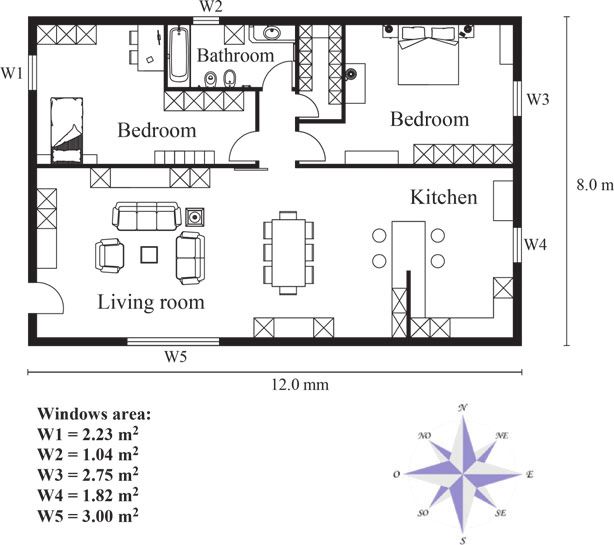
Yearly operation of a building-integrated micro-cogeneration system

                                                                                                                                                                       Downloaded from https://academic.oup.com/ijlct/article-abstract/9/4/331/656004 by guest on 31 March 2020

Figure 3. Occupants-related sensible heat gains for a single flat during week day (a) and weekend day (b), whatever the city is.

demand profile considered in this study corresponds to an elec-
tric consumption for the whole building equal to about                              3. DESCRIPTION OF THE REFERENCE
109.7 Wh/m2 per day. The electric load-duration diagram (with                       SYSTEM
the electric-demand values sorted in descending order) of each
single flat is showed in Figure 7b.                                                 A conventional system composed of a natural gas-fired boiler
    The electric consumption of the pumps was also taken into                       (for thermal energy production) and a power plant mix con-
account during the simulations, even if not included in Figure 7.                   nected to the electric grid (for electricity production) is

                                                                                          International Journal of Low-Carbon Technologies 2014, 9, 331– 346 337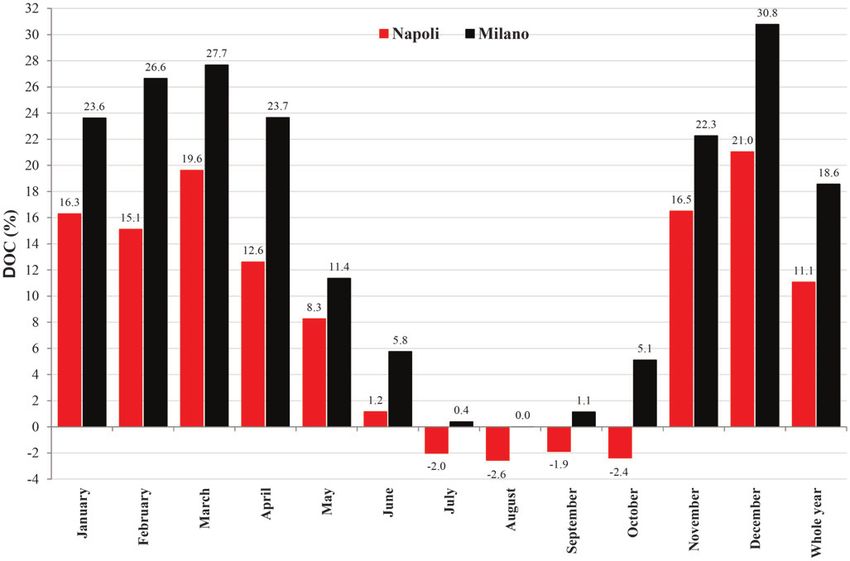
G. Ciampi et al.

                                                                                                                                                                          Downloaded from https://academic.oup.com/ijlct/article-abstract/9/4/331/656004 by guest on 31 March 2020
Figure 4. Daily heat flux profile associated to the lighting appliances of a single flat, whatever the city is.

Figure 5. Building space heating load– duration diagrams
                                                                                         Figure 6. Yearly domestic hot-water duration curve for a single flat, whatever
considered. The comparison with the proposed system is per-                              the city is.
formed by assuming for the reference system the same electric
and thermal energy output of the proposed system.
   A 32.0 kWth natural gas-fired boiler [36] was selected for the                        The primary power consumption of the boiler considered for
thermal energy production within the reference system. The                               the conventional system is evaluated as follows:
boiler manufacturer [36] suggests a value of 0.911 as boiler effi-                                                                CS
                                                                                                                                 Pth;B
ciency for a part load ratio equal to 30% and a value of 0.937 as                                                        CS
                                                                                                                        Pp;B ¼                                     ð4Þ
boiler efficiency in the case of operation at rated output; in this                                                               hCS
                                                                                                                                   B
study the boiler efficiency of the conventional system hCS
                                                        B is eval-
uated by considering a linear interpolation of the manufacturer                          Concerning the efficiency of the power plant mix connected to
data:                                                                                    the national electric grid hPP, a figure of 0.461 is assumed: this
                                                                                         value represents the power plant average efficiency in Italy, in-
               hCS                       CS
                B ¼ 0:911 þ 0:001067  ðPth;B  10:44Þ                           ð3Þ     cluding transmission losses [47, 48].

338 International Journal of Low-Carbon Technologies 2014, 9, 331– 346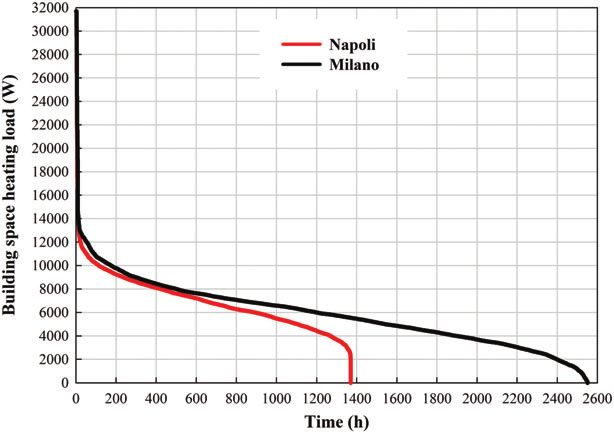
Yearly operation of a building-integrated micro-cogeneration system
SP CS
The values of Ep;TOT and Ep;TOT are computed as reported
below:
SP SP
SP SP
Eth;B Eel;buy
Ep;TOT ¼ Ep;MCHP þ þ ð6Þ
hSP
B hPP
SP SP SP SP
CS
Eth;MCHP Eth;B Eel;MCHP Eel;buy
Ep;TOT ¼ þ þ þ
hCS
B hCS
B hPP hPP
where the primary energy consumed by the MHCP unit
SP
Ep;MCHP , the thermal energy provided by the boiler of the pro-
SP
posed system Eth;B , the electric energy purchased by the pro-
Downloaded from https://academic.oup.com/ijlct/article-abstract/9/4/331/656004 by guest on 31 March 2020
SP
posed system from the electric grid Eel;buy , the thermal energy
supplied by the MCHP unit to the water within the tank
SP
Eth;MCHP and the electric energy produced by the MCHP unit
SP
Eel;MCHP are derived from simulations by assuming 49 599 kJ/kg
[50] as lower heating value of natural gas LHVng.
Figure 8 shows the values of PES as a function of the city,
with reference to the operation during each single month as well
as the whole year. This figure shows that:
† whatever the city is, the proposed system allows a reduction of
primary energy consumption in comparison to the conven-
tional system during the whole year; no difference in terms of
yearly energy saving between Milano and Napoli can be high-
lighted: both cases shows a value of PES equal to 2.7%;
† the monthly values of PES range between 25.2% (October)
and þ8.0% (January) in the case of Napoli, while they vary
from 24.6% (October) up to 7.6% (December) for Milano;
† in the case of Napoli, the values of PES are positive only
during the months in which the indoor air temperature is
Figure 7. Daily electric demand profile for a single flat (a) and single-flat
allowed to be controlled by the Italian Law [25]; during the
electric load– duration diagram (b), whatever the city is.
months in which only the domestic hot water demand is to be
satisfied the conventional system is more convenient with
respect to the proposed system from an energy point of view;
4. ENERGY ANALYSIS: METHODOLOGY, † for the building located in Milano, the indoor air temperature
RESULTS AND DISCUSSION is controlled from 15 October to 15 April [25]: therefore, the
values of PES are negative not only during the months in
According to European directive [49], in order to compare the which only the domestic hot water demand is to be satisfied,
ability of energy conversion systems to satisfy the same user, it is but also during April and October.
important to evaluate the primary energy savings (PES) which is
defined as:
CS
Ep;TOT SP
Ep;TOT
5. ECONOMIC ANALYSIS: METHODOLOGY,
PES ¼ CS
Ep;TOT
ð5Þ RESULTS AND DISCUSSION
The evaluation of the economic performance is performed in this
SP
where Ep;TOT is the primary energy consumed by the proposed section, by considering the operating, capital and maintenance
CS
system and Ep;TOT is the primary energy consumed by the con- costs. Taking into account that a micro-cogeneration system
ventional system for supplying the same energy output of the would require a higher investment for the user when compared
proposed system. A positive value of PES indicates that the with the conventional separate production of heating and electri-
MCHP-based system allows for a primary energy saving in com- city, three different types of incentive were adopted by the Italian
parison to the conventional system. government for MCHP units to be financially feasible [51]:
International Journal of Low-Carbon Technologies 2014, 9, 331– 346 339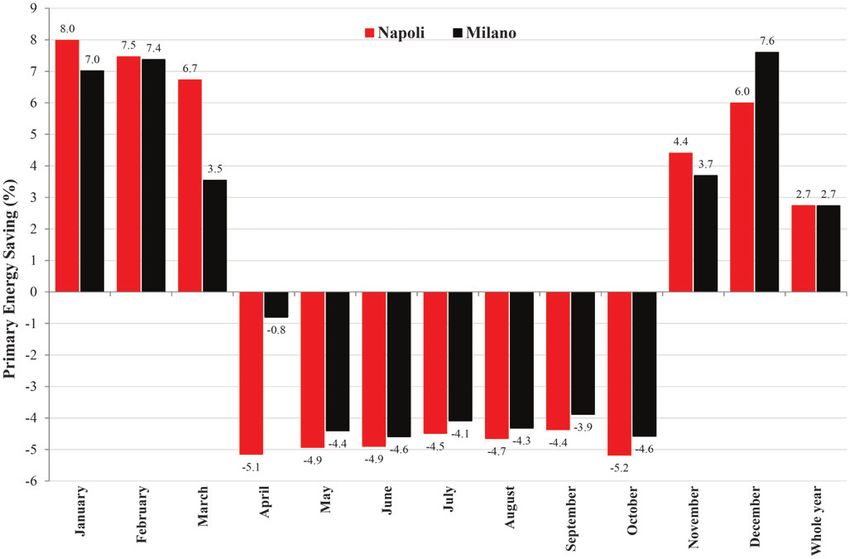
G. Ciampi et al.

                                                                                                                                                              Downloaded from https://academic.oup.com/ijlct/article-abstract/9/4/331/656004 by guest on 31 March 2020
Figure 8. Values of PES as a function of the city and the simulation period.

† Tax rebate (TR) on natural gas purchased;                                          energy consumed by the cogeneration device; Eth;B   SP
                                                                                                                                             is the thermal
† Tradable White Certificates (TWCs), which involve achieving a                      energy produced by the natural gas-fired boiler of the proposed
  mandatory energy-saving target against the ‘business-as-usual’                     system; LHVng is the lower heating value of natural gas (assumed
  scenario; each Ton of Oil Equivalent (TOE) of electric and/or                      equal to 49 599 kJ/kg [50]); rng is the density of natural gas
  thermal energy that is saved corresponds to a TWC, the value                       (assumed equal to 0.72 kg/m3 [50]); CUel,buy is the unit cost of
  of which has been set, for the purposes of simulations, at 86.98                   the electric energy purchased from the national central grid;
  Euros/TOE; the calculation of the TOE has been based on a                            SP
                                                                                     Eel;buy is the electric energy bought from the national central grid
  specific table established by the Italian Regulatory Authority                     by the proposed system; CUel,sell is the unit cost of the electric
  for Electricity and Gas [52];                                                                                                       SP
                                                                                     energy sold to the national central grid; Eel;sell     is the electric
† Government capital grants (GCG) on the purchase of the
  MCHP unit; according to the current legislation, it is equal to                    energy sold to the national central grid by the proposed system.
  the 40% of the capital cost of the cogeneration device.                                In Italy, the unit cost of natural gas CUng for residential appli-
                                                                                     cations basically depends on the region of Italy where the
First of all, the proposed and the conventional systems were                         natural gas is consumed as well as the level of cumulated natural
compared in terms of operating costs. Both the cost of purchas-                      gas consumption [53]. Table 6 shows the values of the above-
ing natural gas and the cost of purchasing electrical energy not                     mentioned terms as a function of both the cumulated level of
produced by the cogeneration system are considered; both the                         natural gas consumption and city. This table highlights that the
revenue from selling the electric energy produced by the MCHP                        excise tax for cogenerative use is lower in comparison to applica-
unit and revenue deriving from tax rebate on natural gas are                         tions other than combined heat and power production: this
consumed by the cogeneration device also taken into account.                         tax rebate is one of the incentives adopted by the Italian
   The following formula is used to define the operating costs of                    Government for MCHP systems defined as ‘high performance’
the proposed system:                                                                 [51] to be financially feasible. About this point is should be con-
                                                                                     sidered that, according to the Italian Law [53], only a portion of
                        SP
                      ðEp;MCHP     SP
                                þ Eth;B =hSP                                         natural gas consumption amounting to 0.22 Sm3/kW hel [54] is
                                          B Þ
  OCSP ¼ CUng                                              SP
                                              þ CUel;buy  Eel;buy                   liable to a tax reduction; on the gas amount not liable of tax re-
                       ð3600  LHVng  rng Þ
                                                                                     duction, the excise tax paid is 0.012498 Euros/Sm3.
                             SP
               CUel;sell  Eel;sell                                           ð8Þ       Regarding the electric energy purchased from the grid, it can
                                                                                     be highlighted that in Italy the residential consumers have
                                             SP                                      time-of-use rates for the electricity prices. According to the
where CUng is the unit cost of natural gas; Ep;MCHP is the primary

340 International Journal of Low-Carbon Technologies 2014, 9, 331– 346
Yearly operation of a building-integrated micro-cogeneration system
Table 6. Natural gas unit cost as a function of the cumulated natural gas consumption and city.
Cumulated natural gas consumption (Sm3/year)
From 0 to 120 From 121 to From 481 to From 1561 to From 5001 to From 80 001
480 1560 5000 80 000 to 200 000
Napoli
Variable rate (Euros/Sm3) 0.47988 0.65521 0.62764 0.62324 0.58612 0.53182
Regional tax (Euros/Sm3) 0.019 0.031 0.031 0.031 0.031 0.031
Excise tax for cogenerative use (Euros/Sm3) 0.0004493a
Excise tax for applications other than cogeneration 0.038 0.135 0.120 0.150 0.150 0.150
(Euros/Sm3)
VAT (%) 10 10 21 21 21 21
Yearly fixed charge (Euros/year) 91.0
Downloaded from https://academic.oup.com/ijlct/article-abstract/9/4/331/656004 by guest on 31 March 2020
Milano
Variable rate (Euros/Sm3) 0.48008 0.57724 0.55630 0.55190 0.53283 0.50493
Regional tax (Euros/Sm3) 0
Excise tax for cogenerative use (Euros/Sm3) 0.0004493a
Excise tax for applications other than cogeneration 0.044 0.175 0.17 0.186 0.186 0.186
(Euros/Sm3)
VAT (%) 10 10 21 21 21 21
Yearly fixed charge (Euros/year) 84.1
a
Only a portion of natural gas consumption amounting to 0.22 Sm3/kW hel [54] is liable to a tax reduction; on the gas amount not liable of tax reduction, the
excise tax payed is 0.012498 Euros/Sm3.
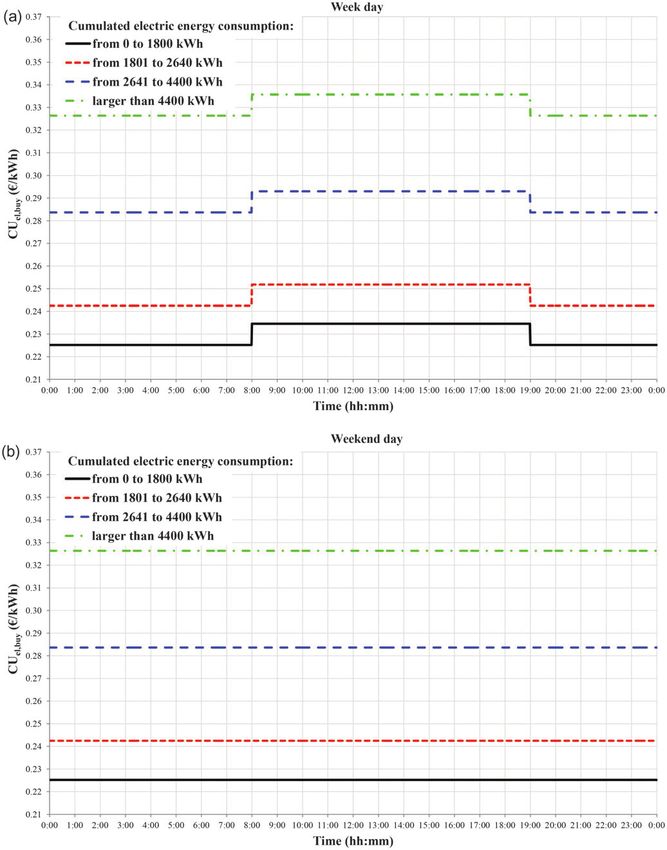
Italian scenario [55], the unit cost of purchased electric energy proposed system, and so the proposed system is more convenient
CUel,buy varies depending on: (i) the day, (ii) the hour of the day, from an economic point of view.
(iii) the level of cumulated electric energy consumption. The unit Figure 11 shows the values of DOC with reference to the
cost of electric energy purchased from the grid during a week day operation during each single month as well as the whole year.
and a weekend day is reported in Figure 9a and b, respectively, as This figure shows that:
a function of both the time and the cumulated electric energy
consumption. The values specified in these figures include both † whatever the city is, the proposed system allows a reduction
the excise tax (0.0227 Euros/kW hel ) and the VAT (10%). of operating costs in comparison to the conventional system
According to the Italian Law [56], the revenue from selling by considering the yearly operation; the saving is more pro-
the electric energy to the national central grid CUel,sell depends nounced in the case of Milano (18.6%) with respect to the
on: (i) the city, (ii) the day (week day, Saturday and Sunday are city of Napoli (11.1%);
differentiated), (iii) the hour of the day. † whatever the month is, the values of DOC associated to
Figure 10 reports the values of CUel,sell as a function of the Milano are always larger than those related to Napoli;
hour of the day during week day, Saturday and Sunday and the † whatever the city is, during the months in which only the do-
city. mestic hot water demand is to be satisfied the values of DOC
As above-mentioned, the operating costs of the proposed are much lower than those associated to the periods during
system (calculated by using Equation 8) are compared with which heating up the building is required;
those of a conventional system; this comparison is performed by † in the case of Napoli, the monthly values of DOC are negative
means of the following formula: from July up to September; during the remaining months,
they vary between 1.2% (June) and 21.0% (December); for
OCCS OCSP the building located in Milano the monthly values of DOC
DOC ¼ ð9Þ
OCCS are always not negative, ranging from 0% (August) up to
30.8% (December).
where the operating costs of the conventional system are calcu-
lated by using the following Eq. 10:
In the following, the comparison between the proposed and
SP SP
CUng ðEth;MCHP þ Eth;B Þ conventional systems is performed also in terms of SPB period;
OCCS =
3600 LHVng rng hCS
B ð10Þ this indicator represents the number of years required to recover
SP SP SP
the investment cost and it is calculated as follows:
þ CUel;buy ðEel;MCHP þ Eel;buy Eel;sell Þ
A positive value of DOC means that the conventional system is CCSP CCCS GCG
SPB ¼ SP
ð11Þ
characterized by larger operating costs in comparison to the OC þ MCSP TWC OCCS MCCS
International Journal of Low-Carbon Technologies 2014, 9, 331– 346 341G. Ciampi et al.
Downloaded from https://academic.oup.com/ijlct/article-abstract/9/4/331/656004 by guest on 31 March 2020
Figure 9. Unit cost of electric energy purchased from the grid during a week day (a) and during a weekend day (b), whatever the city is.
where CCSP is the capital cost of the MCHP unit, the boiler and The following values are assumed in this article:
the hot water storage tank of the proposed system; CCCS is the (i) capital cost of the MCHP unit [23]: 18 000.0 Euros;
capital cost of the boiler of the conventional system; MCSP is (ii) capital cost of the boiler of the proposed system [36]:
the yearly maintenance cost of the MCHP unit and the boiler of 1700.0 Euros;
the proposed system; MCCS is the yearly maintenance cost of the (iii) capital cost of hot water storage of the proposed system
boiler of the conventional system. [31]: 3000.0 Euros;
342 International Journal of Low-Carbon Technologies 2014, 9, 331– 346Yearly operation of a building-integrated micro-cogeneration system
Downloaded from https://academic.oup.com/ijlct/article-abstract/9/4/331/656004 by guest on 31 March 2020
Figure 10. Unit cost of electric energy sold to the grid as a function of the time and the city.
(iv) capital cost of the boiler of the conventional system [36]: Table 7 reports the values of SPB period (Equation 11) as a
2150.0 Euros; function of the city and the Italian incentives for supporting the
(v) unit maintenance cost of the MCHP unit [23]: 0.016 cogeneration technology. This table highlights that:
Euros/kW hel;
(i) without all support mechanisms adopted by the Italian
(vi) maintenance cost of the boiler of both proposed and con-
Government, the duration of the SPB period would not be
ventional systems [36]: 80.0 Euros/year.
reasonable;
International Journal of Low-Carbon Technologies 2014, 9, 331– 346 343G. Ciampi et al.
Downloaded from https://academic.oup.com/ijlct/article-abstract/9/4/331/656004 by guest on 31 March 2020
Figure 11. Values of DOC as a function of the city and simulation period.
Table 7. Values of SPB (years) as a function of the city and the Italian side, a simplified model of the multifamily house was built by
incentives. setting-up the thermal transmittance values for both walls and
windows suggested by Italian Law; in addition a streamlined ap-
Napoli Milano
proach was adopted in defining the electric demand profile, the
Without all Italian incentives 995.6 98.1 domestic hot water requirement, as well as the internal gains
With all Italian incentives 19.8 9.7 associated to occupants and lighting systems.
Only with TR on natural gas purchased 31.6 15.2
The performance of the proposed system was compared with
Only with TWC 465.8 86.9
Only with GCG 646.8 63.7 those of a conventional system based on separate energy produc-
tion upon varying the city (Napoli and Milano) where the build-
ing is located.
(ii) by considering all Italian incentives, the duration of the The main results can be summarized as follows:
SPB period becomes more acceptable, ranging from 9.7
† whatever the city is, the proposed system allows a reduction
years for Milano and 19.8 years for Napoli;
of primary energy consumption in comparison to the con-
(iii) among the three Italian support mechanisms, the more
ventional system with a percentage difference during the
convenient is represented by the Tax Rebate on natural gas
whole year operation equal to 2.7%; the monthly values of
purchased; the incentive associated to the TWCs is the less
PES range between 25.2% (October) and þ8.0% (January)
suitable from an economic point of view.
in the case of Napoli, while they vary from 24.6% (October)
up to7.6% (December) for Milano;
† whatever the city is, the proposed system allows also lower op-
6. CONCLUSIONS erating costs in comparison to the conventional system
during the whole year; the saving is more pronounced in the
The yearly operation of a building-integrated micro- case of Milano (18.6%) in comparison to the city of Napoli
cogeneration system was investigated by means of transient (11.1%);
simulations. The main strength of the work is especially related † by considering all Italian incentives, the SPB period ranges
to the fact that the transient nature of building and occupant from 9.7 years for Milano and 19.8 years for Napoli; among
driven loads, the interaction between the loads and the system the three Italian support mechanisms, the more economically
output as well as the part-load characteristics of the cogener- convenient is represented by the Tax Rebate on natural gas
ation unit were taken into account in great detail. On the other purchased.
344 International Journal of Low-Carbon Technologies 2014, 9, 331– 346Yearly operation of a building-integrated micro-cogeneration system
ACKNOWLEDGEMENTS [16] Pehnt M. Environmental impacts of distributed energy systems—the case of
micro cogeneration. Environ Sci Policy 2008;11:25– 37.
[17] Peacock AD, Newborough M. Impact of micro-CHP systems on domestic
The work described in this article was undertaken as part of
sector CO2 emissions. Appl Therm Eng 2005;25:2653– 76.
IEA/ECBCS Annex 54 (www.iea-annex54.org). The Annex was [18] Hawkes A, Aguiar P, Hernandez-Aramburo CA, et al. Techno-economic
an international collaborative research effort and the authors modelling of a solid oxide fuel cell stack for micro combined heat and
gratefully acknowledge the indirect or direct contributions of the power. J Power Source 2006;156:321– 33.
other Annex participants. [19] Dorer V, Weber A. Energy and CO2 emissions performance assessment of
residential micro-cogeneration systems with dynamic whole-building simu-
lation programs. Energy Convers Manage 2009;50:648 – 57.
[20] Ribberink H, Beausoleil-Morrison I. The potential for reducing energy con-
REFERENCES sumption and greenhouse gas emissions in the Ontario (Canada) housing
sector with solid-oxide fuel-cell micro-cogeneration. In: Proceedings of 1st
[1] EEA Report - No 6/2008, Energy and environment report 2008, 2008. http:// International Conference & Workshop on Micro-cogeneration & Applications,
Downloaded from https://academic.oup.com/ijlct/article-abstract/9/4/331/656004 by guest on 31 March 2020
www.eea.europa.eu/publications/eea_report_2008_6 (16 January 2013, date Ottawa, Canada, 29 April – 1 May, 2008.
last accessed). [21] Alanne K, Söderholm N, Sirén K, et al. Techno-economic assessment and
[2] Italian Decree n. 311/06. http://www.artechint.com/attestato-energetico.pdf optimization of Stirling engine micro-cogeneration systems in residential
(16 January 2013, date last accessed). buildings. Energy Convers Manage 2010;51:2635– 46.
[3] Directive 2004/8/EC of the European Parliament and of the Council of the [22] Solar Energy Laboratory. TRNSYS 16, A transient system simulation
11 February 2004 on the promotion of cogeneration based on the useful program, Technical Report, University of Wisconsin, Madison, USA, 2004.
heat demand in the internal energy market and amending Directive 92/42/ [23] AISIN, TECNOCASA CLIMATIZZAZIONE. www.tecnocasa.com/EN/Default.
EEC. Official Journal of the European Union, Luxembourg, 2004. aspx?Level0=prodotti&level1=mchp (8 July 2013, date last accessed).
[4] Pepermans G, Driesen J, Haeseldonckx D, et al. Distributed generation: def- [24] Ciampi G, Rosato A, Sibilio S. Energy analysis of a building-integrated
inition, benefits and issues. Energy Policy 2005;33:787 – 98. micro-cogeneration system for a residential application in south Italy. In:
[5] Angrisani G, Roselli C, Sasso M. Distributed microtrigeneration systems. Proceedings of The 3rd edition of the International Conference on
Prog Energy Combust Sci 2012;38:502– 21. Microgeneration and Related Technologies, Naples, Italy, April 15 – 17, 2013.
[6] EU SAVE. Micro-Map: Mini and Micro CHP-Market Assessment and [25] Decree of President of Italian Republic n.412/93. efficienzaenergetica.acs.
Development Plan: Summary Report, London, UK, 2002. enea.it/doc/dpr412-93.pdf (12 September 2013, last date accessed).
[7] Kuhn V, Klemeš J, Bulatov I. MicroCHP: Overview of selected technologies, [26] Bellia L, Mazzei P, Palombo A. Weather data for building energy cost-benefit
products and field test results. Appl Therm Eng 2008;28:2039 – 48. analysis. Int J Energy Res 1998;22:1205– 15.
[8] Frangopoulos CA. EDUCOGEN, The European Educational Tools on [27] EN12831:2003. Heating systems in buildings—method for calculation of
Cogeneration. 2001. http://www.bepita.net/materiels/cogeneration/EDUCOGEN_ the design heat load.
Tool.pdf (1 October 2013, date last accessed). [28] Rosato A, Sibilio S, Ciampi G. Dynamic performance assessment of a
[9] Final Report of Annex 42 of the International Energy Agency’s Energy building-integrated cogeneration system for an Italian residential applica-
Conservation in Buildings and Community Systems Programme, An tion. Energ Buildings 2013;64:343 –58.
Experimental and Simulation-Based Investigation of the Performance of [29] Rosato A, Sibilio S, Ciampi G. Energy, environmental and economic
Small-Scale Fuel Cell and Combustion-Based Cogeneration Devices Serving dynamic performance assessment of different micro-cogeneration systems
Residential Buildings, Government of Canada, 2008. in a residential application. Appl Therm Eng 2013;59:599– 617.
[10] Beausoleil-Morrison I. An experimental and simulation-based investigation [30] Calise F. Thermoeconomic analysis and optimization of high efficiency solar
of the performance of small-scale fuel cell and combustion-based cogener- heating and cooling systems for different Italian school buildings and cli-
ation devices serving residential buildings. A Report of FCþCOGEN-SIM: mates. Energ Buildings 2010;42:992– 1003.
The Simulation of Building-Integrated Fuel Cell and Other Cogeneration [31] CORDIVARI. www.cordivari.it/product.aspx?Id=2&gid=137&lng=0 (8 July
Systems. Annex 42 of the International Energy Agency Energy Conservation 2013, last date accessed).
in Buildings and Community Systems Programme, 2005. [32] Ferguson A, Kelly N, Weber A, et al. Modelling residential-scale
[11] Arteconi A, Bartolini CM, Brandoni C, et al. Prospects for Micro-CHP tech- combustion-based cogeneration in building simulation. J Build Perform
nology in the residential sector. In: Proceedings of ASME-ATI-UIT 2010 Simul 2009;2:1– 14.
Conference on Thermal and Environmental Issues in Energy Systems, [33] Kelly N, Beausoleil-Morrison I. Specifications for modelling fuel cell and
Sorrento, Italy, 16 – 19 May, 2010. combustion-based residential cogeneration devices within whole-building
[12] Caresana F, Brandoni C, Feliciotti P, et al. Energy and economic analysis of simulation programs, IEA/ECBCS Annex 42 report, 2007.
an ICE-based variable speed-operated micro-cogenerator. Appl Energy [34] Rosato A, Sibilio S. Calibration and validation of a model for simulating
2011;88:659 – 71. thermal and electric performance of an internal combustion engine-based
[13] Cardona F, Piacentino A, Alterio V. Analysis and optimization of fuel cell co- micro-cogeneration device. Appl Therm Eng 2012;45 –46:79– 98.
generation systems for application in single-family houses. In: Proceedings of [35] Rosato A, Sibilio S. Energy performance of a micro-cogeneration device
23rd International Conference on Efficiency, Cost, Optimization Simulation during transient and steady-state operation: experiments and simulations.
and Environmental Impact of Energy Systems, Lausanne, Switzerland, June Appl Therm Eng 2013;52:478– 91.
14 – 17, 2010. [36] Vaillant. www.vaillant.co.uk/ (8 July 2013, date last accessed).
[14] Rosato A, Sibilio S. Performance assessment of a micro-cogeneration system [37] EN ISO 6946: 2007. Building components and building elements—thermal
under realistic operating conditions. Energy Convers Manage 2013;70:149–62. resistance and thermal transmittance—calculation method.
[15] De Paepe M, D’Herdt P, Mertens D. Micro-CHP systems for residential [38] UNI 10351:1994/EC. Materiali da costruzione—Conduttività termica e per-
applications. Energy Convers Manage 2006;47:3435 –46. meabilità al vapore.
International Journal of Low-Carbon Technologies 2014, 9, 331– 346 345G. Ciampi et al.
[39] EN ISO 10077 –1:2006. Thermal performance of windows, doors and [49] Commission Decision of 21 December 2006 establishing harmonised
shutters—calculation of thermal transmittance—Part 1: General. efficiency reference values for separate production of electricity and heat in
[40] Decree of President of Italian Republic n.303/56. http://prevenzione.mi.infn. application of Directive 2004/8/EC of the European Parliament and of the
it/Norme_legge/DPR_303_56.pdf (13 December 2012, date last accessed). Council, document number C(2006) 6817. Official Journal of the European
[41] ISO 7730:2005. Ergonomics of the thermal environment—analytical deter- Union, 2007.
mination and interpretation of thermal comfort using calculation of the [50] Rossi N. Manuale del Termotecnico, 2nd edn. HOEPLI, 2007 (in
PMV and PPD indices and local thermal comfort criteria. Italian).
[42] Philips Lighting Manual, 5th edn. The Netherlands, 1993. [51] Arteconi A, Brandoni C, Polonara F. Distributed generation and trigenera-
[43] EnergyPlus Simulation Software. apps1.eere.energy.gov/buildings/energyplus/ tion: Energy saving opportunities in Italian supermarket sector. Appl Therm
cfm/weather_data3.cfm/region=6_europe_wmo_region_6/country=ITA/ Eng 2009;29:1735– 43.
cname=Italy (8 July 2013, date last accessed). [52] Italian Regulatory Authority for Electricity and Gas. http://www.gse.it/it/
[44] IEA/SHC Task 26 load profiles. sel.me.wisc.edu/trnsys/trnlib/library15. Qualifiche%20e%20certificati/Certificati%20Bianchi%20e%20CAR/Pages/
htm#IEA26Load (8 July 2013, date last accessed). default.aspx (12 September 2013, date last accessed).
[45] Jordan U, Vajen K. Realistic Domestic Hot-Water Profiles in Different Time [53] Italian Regulatory Authority for Electricity and Gas. http://www.autorita.
Downloaded from https://academic.oup.com/ijlct/article-abstract/9/4/331/656004 by guest on 31 March 2020
Scales. 2001. sel.me.wisc.edu/trnsys/trnlib/iea-shc-task26/iea-shc-task26- energia.it/it/consumatori/consumatori_gas.htm (8 January 2013, date last
load-profiles-description-jordan.pdf (8 July 2013, date last accessed). accessed).
[46] Richardson I, Thomson M. Domestic electricity demand model— [54] http://www.seaitalia.it/documenti/1TUA_01gen2013.pdf (8 January 2013,
simulation example, Loughborough University’s Institutional Repository. date last accessed).
hdl.handle.net/2134/5786 (8 July 2013, date last accessed). [55] Italian Regulatory Authority for Electricity and Gas. http://www.autorita.
[47] Italian Regulatory Authority for Electricity and Gas. www.autorita.energia.it energia.it/it/consumatori/consumatori_ele.htm (8 January 2013, date last
(13 December 2012, date last accessed). accessed).
[48] Angrisani G, Rosato A, Roselli C, et al. Experimental results of a micro- [56] TERNA S.p.A. http://www.terna.it/Default.aspx?Tabid=382 (25 October
trigeneration installation. Appl Therm Eng 2012;38:78– 90. 2012, date last accessed).
346 International Journal of Low-Carbon Technologies 2014, 9, 331– 346You can also read