Manassas City Public Schools - Schools Facility Plan 2020-2030
←
→
Page content transcription
If your browser does not render page correctly, please read the page content below
Manassas City Public
      Schools
Schools Facility Plan 2020-2030

                           www.citygategis.com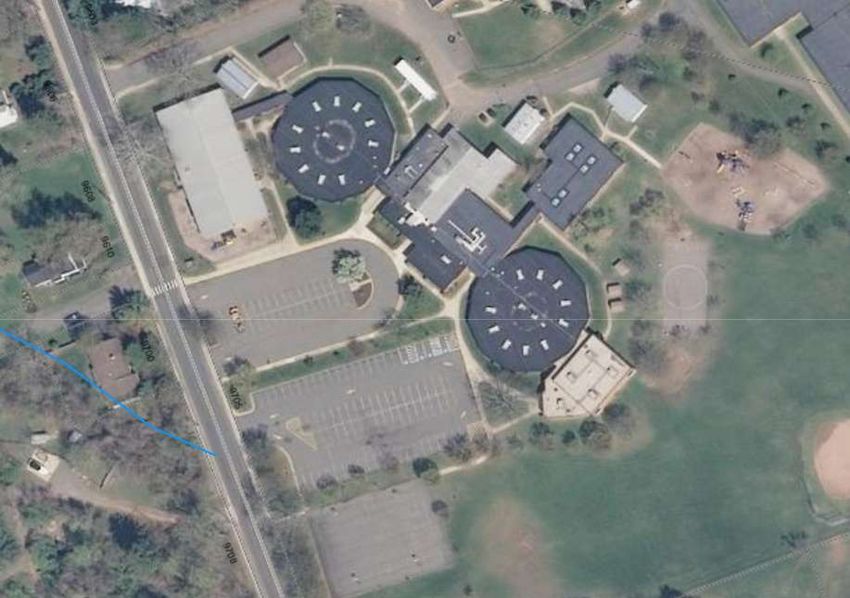
T A B L E O F C O NT E NT S
        Introduction ............................................................................................................................... 3

        Enrollment projection ................................................................................................................. 6

        Capacity Analysis ..................................................................................................................... 14

           Elementary Schools: .............................................................................................................. 15

           Intermediate Schools: ............................................................................................................ 16

           Middle Schools: ..................................................................................................................... 16

           High Schools: ........................................................................................................................ 17

           Comparison of updated capacities vs. projected enrollments ................................................ 18

        Manassas City Public Schools Grade Reconfiguration Studies ................................................... 21

           Current Conditions ................................................................................................................ 21

           Future Conditions ................................................................................................................. 22

           Grade Reconfiguration Scenarios ........................................................................................... 22

           Recommendation .................................................................................................................. 25

        FACILITIES REVIEW .................................................................................................................... 26

                  Baldwin Elementary School............................................................................................ 29

                  R. C Haydon Elementary School .................................................................................... 30

                  Jennie Dean Elementary School ..................................................................................... 36

                  George C Round Elementary School .............................................................................. 46

                  Weems Elementary School............................................................................................. 54

                  Mayfield Intermediate School ........................................................................................ 60

                  Metz Middle School ....................................................................................................... 67

                  Osbourn High School .................................................................................................... 76

                                                                                                                                      Page |2
Manassas City Public Schools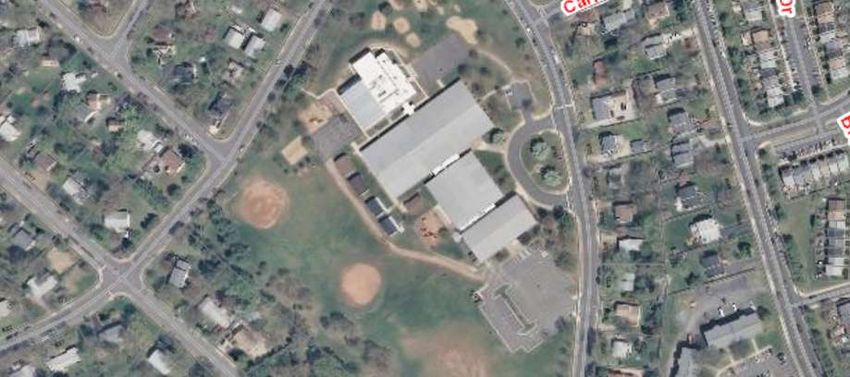
I NT R O D U C T I O N
In March of 2015 the Manassas City Public Schools contracted with Citygate GIS to update the
School Division’s facilities master plan and support the development of a Capital Improvement
Program (CIP). A previous master plan completed in 2012 resulted in the construction of a new
Baldwin Elementary School to replace the original Baldwin Elementary School that is now 54
years old. The new Baldwin facility is being constructed as a combination elementary and
intermediate school employing the “school within a school” concept to provide not only a new
elementary facility but also additional capacity to relieve overcrowding at the intermediate
school level. The previous plan also resulted in a consolidation of central administrative offices
into a leased space within the city.
Since the previous plan was adopted, significant changes have taken place that will affect the
School Division’s planning for future facilities. Enrollment, population diversity, and the
number of births to city residents have increased. A recovering economy has generated more
new residential construction and plans are being formulated for redevelopment of existing
commercial and residential areas within the city’s boundaries. There will be a need for
additional space, especially at the elementary level, as enrollment increases and more spaces
are needed for programs such as special education, early childhood education, and students
with limited English proficiency (ESOL). Since the 2010-11 school year, enrollment in the
Manassas City Public Schools has increased by over 600 students or roughly 9%, the vast
majority of this growth has been at the elementary school level. The School Division is
currently using 13 portable classrooms to help accommodate the additional students. As the
increase in elementary school enrollment progresses through the grades, enrollments will
increase at the intermediate, middle, and high school levels with a significant amount of
overcrowding projected for the high school in the later years of the facilities plan.
SCHOOL FACILITY PLAN
The Manassas City Public Schools School Facility Plan, as outlined in this document, is a 10 year
plan, which identifies capital projects and equipment purchases and provides a planning
schedule for the years 2020 to 2030. The plan will be a support document used by the school
district to develop and forecast annual budgets and communicate major projects and their
planning process with the public and city government.
BENEFITS
The Facility Plan provides many benefits including:
Allows for a systematic evaluation of all potential projects at the same time.
The ability to consolidate projects and reduce costs.
Serves as a public relations and economic development tool.
A focus on preserving a governmental entity's infrastructure while ensuring the efficient
use of public funds.
Page |3
Manassas City Public Schools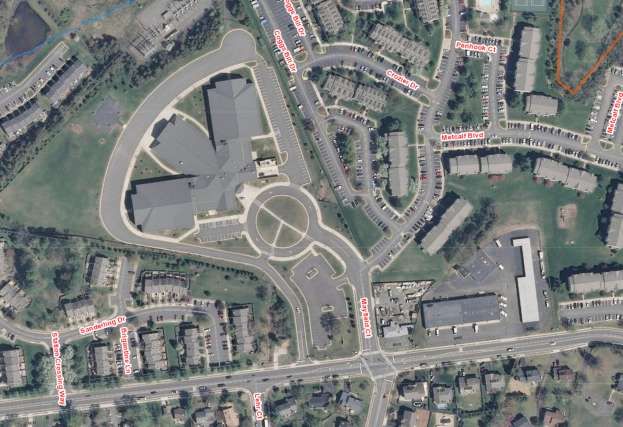
An opportunity to foster cooperation among departments and an ability to inform other
units of government of the entity's priorities.
OVERALL PROCESS
The development of the Facility Plan for the school district will involve a review of the current
plan, identification of facility impacts such as ongoing maintenance programs and
improvements, new school construction and planned renovations. The facility plan will also
include input from the enrollment projection analysis as well as a review of the school district’s
instructional plans.
SPECIFIC STEPS
1. Community Meeting April 21st, 2015
2. Evaluated Previously Approved, Unimplemented or Incomplete Projects
3. Multiple Site Visits to ALL Schools
4. Met With City Planners
5. Meetings held with Principals and Manassas City Public School Staff
6. Solicited, Compiled, and Evaluated New Project Requests
7. Updated Projections
8. Updated Capacities
9. Facilities Reviewed
10. Developed Grade Reconfiguration Scenarios
11. Updated Enrollment Projections
12. Prioritized Projects
13. Created CIP based on enrollment projection, facility needs and instructional
requirements.
14. Presented CIP to the School District
15. Adopted CIP
16. Monitored and Managed Approved Projects within the CIP
17. Updated Existing/Ongoing Capital Programs
Page |4
Manassas City Public Schools
PLANNING FOR THE FUTURE: 2020-2030

                                       Page |5
Manassas City Public Schools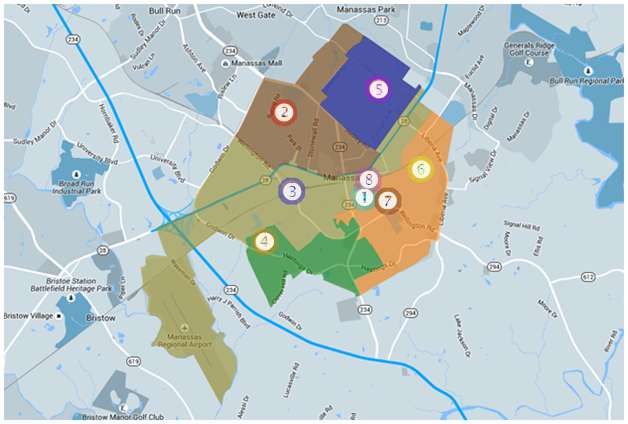
E N R O L LM E N T P R O J EC T I O N
        The process of developing the enrollment projections for Manassas City Public Schools included
        a review of historical membership trends, analyses of actual and projected population change,
        past and future residential construction, live birth data and the relationship of live births to
        Kindergarten enrollment. The projection model utilizes a cohort component methodology that
        considers not only grade progression ratios but also the impact of past and future rates of
        construction, changes in special programs, and demographic changes in the Manassas
        community.

        Enrollment in the Manassas City Public Schools has increased by 1,080 students or
        approximately 16.6% since the 2006-07 school year. Based on the projection methodology
        described above, a continued enrollment increase is expected to occur.

        The enrollment projections contained in this report are based upon the best information
        available at the time. Changes in the economy, employment, immigration and numerous other
        factors can and will affect the accuracy of these projections. The School Division is encouraged
        to pay close attention to the variables that affect public school enrollment and to update these
        projections on a regular basis.

        CITY DEMOGRAPHICS

        The United States Census Bureau estimates total population in the City of Manassas grew from
        37,821 residents in the year 2010 to 41,705 residents in 2014, an increase of 3,884 or
        approximately 10.25%. During the same time period, Hispanic population in Manassas City grew
        from 11,876 to 14,179 - an increase of 2,303 accounting for roughly 34% of the overall
        population and about 59.3% of the overall population growth. Virginia Labor Market
        Information projections indicate continued growth in the City’s population is expected with
        total population estimated to reach 42,105 by the year 2020 and 46,591 by 2030. The
        Hispanic portion of the population is projected to continue growing, accounting for 15,160
        residents or roughly 36% of total population in the year 2020 and 18,958 residents or about
        40.7% of total population 2030.

        School age population is also projected to grow, increasing from 8,856 persons in 2010 to
        9,113 in 2020 and 9,942 by the year 2030. Likewise, the population under 5 years of age is
        projected to increase from 3,194 in 2010 to 3,392 in 2020 and 3,779 in 2030.

                                                                                                  Page |6
Manassas City Public Schools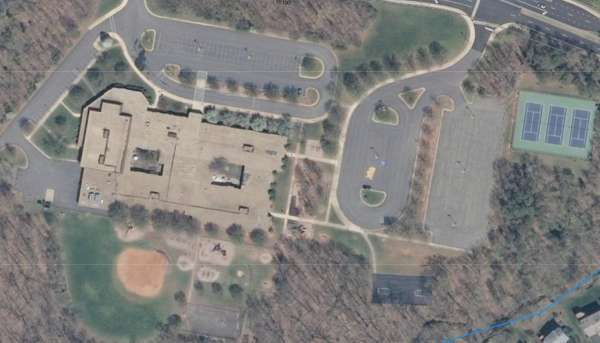
50,000

               45,000                                                                              46,591
                                                                          41,830         42,105
               40,000
                                                             37,821
               35,000                            35,135
               30,000
                                    27,754
               25,000

               20,000
                                 1990        2000         2010        2014          2020          2030
                                                                                  (projected)   (projected)

        CITY HOUSING DATA

        New housing development and potential redevelopment of existing residential and commercial
        spaces in Manassas City were reviewed with the city planning staff to determine the potential
        impact on school enrollment. The table below illustrates the number of residential building
        permits issued in the city over the past 10 years. The number of residential permits has risen
        significantly since the recession when a low of just 6 permits were issued in 2008. By 2011,
        permits issued totaled 117 and by 2014 issued permits totaled 116. Future plans indicate there
        is enough pending activity to support residential development at a rate equal to the average of
        the past 10 years. Potential redevelopment of currently low cost and affordable housing areas
        in the city could have a significant impact on school enrollment. MCPS staff should continue to
        monitor potential changes of this nature.

                                              Residential Permits
                    140
                    120
                    100
                     80
                     60
                     40
                     20
                       0
                               2004 2005 2006 2007 2008 2009 2010 2011 2012 2013 2014
                                             *10 year average = 65 permits/year

                                                                                                   Page |7
Manassas City Public Schools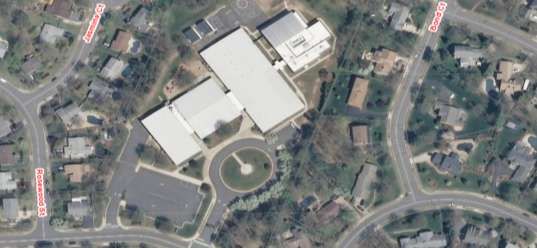
LIVE BIRTH DATA

        Live birth data is helpful in projecting future kindergarten enrollment. The data provide a look
        at overall trends and assist in planning for future enrollment changes. Live birth data is used to
        calculate the percentage of births in a specific jurisdiction that attend Kindergarten in that
        jurisdiction five years later. This birth to Kindergarten progression ratio can be applied to
        recent births to estimate future Kindergarten enrollments. Live birth data is reported by the
        residence of the mother rather than were the birth actually took place. For example if a mother
        living in Manassas City gives birth in Arlington the birth will be reported with Manassas City
        birth data. It is important to note the trend in these ratios. The most recent five years show
        significantly higher ratio’s than in the earlier years, however the ratios did decline slightly in the
        2014-15 and 2015-16 school years. The following charts depict 15 years of historical birth
        data for Manassas City and ratios of births to Kindergarten five years later for school years
        2001-02 through 2015-16.

                      YEAR      BIRTHS           YEAR            Kindergartner            RATIO
                                                                  Membership
                      2001       678             2006                 535                 0.789
                      2002       683             2007                 493                 0.722
                      2003       686             2008                 505                 0.736
                      2004       638             2009                 539                 0.845
                      2005       686             2010                 625                 0.911
                      2006       767             2011                 610                 0.795
                      2007       657             2012                 620                 0.944
                      2008       548             2013                 620                 1.131
                      2009       580             2014                 613                 1.057
                      2010       670             2015                 557                 0.831

                                                 Live Births
                800

                700

                600

                500

                400
                        2000 2001 2002 2003 2004 2005 2006 2007 2008 2009 2010 2011 2012 2013

                                                                                                   Page |8
Manassas City Public Schools
SURVIVAL RATIOS

        The following table depicts the ten-year average survival ratios for Manassas City Public
        Schools. Survival ratios indicate the percentage of students that advance from one grade level
        to the next higher grade level the following school year. A survival ratio greater than 100%
        indicates enrollment grew as the cohort advanced. A ratio less than 100% indicates a
        membership declined as the cohort progressed to the next grade level.

                         Grades                      Average            Standard Deviation
                         Birth – K                   86.70%                    13.5
                         K-1                         101.80%                   2.33
                         1-2                         97.40%                    2.57
                         2-3                         96.70%                    2.22
                         3-4                         100.10%                   3.62
                         4-5                          100.7                    4.42
                         5-6                         102.00%                   3.62
                         6-7                         98.70%                     2.2
                         7-8                         98.90%                    2.12
                         8-9                         120.20%                   4.98
                         9-10                        85.20%                    9.06
                         10-11                       95.80%                    3.76
                         11-12                       93.90%                    7.36

        Note: The unusually high percentage for grades 8-9 reflects both students being retained at the
        ninth grade level because they are lacking sufficient credits to classified as a 10 th grade
        students and entries to the public school system at the 9th grade level of students previously
        home schooled or attending private or parochial schools.

        MANASSAS CITY PUBLIC SCHOOLS HISTORICAL ENROLLMENT

        The following table depicts enrollment in Manassas City Public Schools over the past ten years.
        As mentioned previously enrollment has grown by 1,080 students or 16.6% during this time
        period. Enrollment for the 2015-16 school year was 7,575 students. Note that all historical
        and projected enrollments in this report are for the end of September of the given school year.

                                                                                                  Page |9
Manassas City Public Schools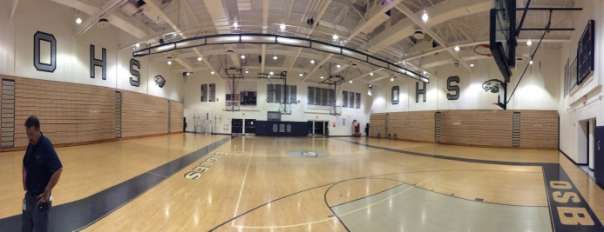
DATA CHART - Manassas City Public Schools Historical Enrollment by Grade
        GRADE          2006-   2007-   2008-    2009-   2010-   2011-   2012-   2013-   2014-       2015-
        LEVEL           07      08       09      10      11      12      13      14       15         16
          Special       80      87      129     197     191      203     215     215      213        292
         Programs
              K        535     493      516     539     625      610     620     620      613        557
              1        503     555      516     524     547      635     610     634      617        644
              2        546     483      528     513     533      524     605     602      614        600
              3        511     517      478     510     512      528     498     561      583        596
              4        476     518      512     493     505      522     509     486      577        595
              5        478     439      504     526     495      516     537     510      515        578
              6        509     483      480     523     516      499     521     530      541        532
              7        459     495      485     491     520      513     501     517      502        522
              8        495     454      501     494     490      519     498     474      512        500
              9        607     622      553     623     586      550     598     577      597        603
              10       448     476      507     480     523      533     519     543      563        518
              11       435     420      475     487     476      513     510     484      520        559
              12       413     432      382     424     417      439     479     465      475        479
          TOTAL        6495    6474     6566    6824    6936    7104    7220    7218      7442      7575

        Source: Manassas City Public Schools

        DATA CHART - Manassas City Public Schools Historical Enrollment by School Level
        SCHOOL         2006-   2007-    2008-   2009-   2010-   2011-   2012-   2013-   2014-      2015-
        LEVEL          07      08       09      10      11      12      13      14      15         16
        Special        80      87       129     197     191     203     215     215     213        292
        Programs
        Elementary     2571    2566     2550    2579    2722    2819    2842    2903    3004       2992
        K-4
        Intermediate   987     922      984     1049    1011    1015    1058    1040    1056       1110
        5-6
        Middle 7-8     954     949      986     985     1010    1032    999     991     1014       1022
        High 9-12      1903    1950     1917    2014    2002    2035    2106    2069    2155       2159
        Total          6495    6474     6566    6824    6936    7104    7220    7218    7442       7575

        Source: Manassas City Public Schools

        MANASSAS CITY PUBLIC SCHOOLS PROJECTED ENROLLMENT – MID RANGE
        Using the Mid-Range projection model, student enrollment in Manassas City Public Schools is
        projected to increase from 7,575 students in 2015-16 to 9,315 students in 2029-30, an
        increase of 1,740 students or 23.0%.

                                                                                              P a g e | 10
Manassas City Public Schools
Data Chart - Manassas City Public Schools Projected Enrollment Mid-Range
GRADE 2016 2017 2018 2019 2020 2021 2022 2023 2024 2025 2026 2027 2028 2029
-17 -18 -19 -20 -21 -22 -23 -24 -25 -26 -27 -28 -29 -30
Pre- 37 37 37 37 37 37 37 37 37 37 37 37 37 37
School
Sp/Ed 74 75 77 78 79 79 79 79 80 81 82 82 83 84
VPI 216 216 216 216 216 216 216 216 216 216 216 216 216 216
K 673 689 676 673 675 681 687 693 699 705 711 717 724 731
1 650 684 702 688 685 687 693 700 706 712 718 724 730 737
2 608 634 666 683 669 666 668 674 681 687 693 698 704 710
3 578 585 610 642 659 645 642 644 650 657 662 668 673 679
4 592 578 585 610 642 659 645 642 644 650 657 662 668 673
5 589 598 584 591 616 648 666 651 648 650 657 664 669 675
6 596 602 612 597 604 630 663 681 666 663 665 672 679 684
7 522 590 596 606 591 598 624 657 675 660 657 659 666 673
8 531 517 584 590 600 585 592 618 650 668 653 650 652 659
9 596 637 620 701 708 720 702 710 742 780 802 784 780 782
10 539 523 559 544 615 621 632 616 623 651 684 704 688 684
11 505 520 504 539 525 593 599 610 594 601 628 660 679 664
12 502 467 480 466 498 485 548 553 564 549 555 580 610 627
TOTAL 7808 7952 8108 8261 8419 8550 8693 8781 8875 8967 9077 9177 9258 9315
Data Chart - Manassas City Public Schools Projected Enrollment by School Level Mid-Range
2016 2017
LEVEL 2018 2019 2020 2021 2022 2023 2024 2025 2026 2027 2028 2029
-17 -18
-19 -20 -21 -22 -23 -24 -25 -26 -27 -28 -29 -30
Pre- 3428 3498 3569 3627 3662 3670 3667 3685 3713 3745 3776 3804 3835 3867
K-4
5-6 1185 1200 1196 1188 1220 1278 1329 1332 1314 1313 1322 1336 1348 1359
7-8 1053 1107 1180 1196 1191 1183 1216 1275 1325 1328 1310 1309 1318 1332
9-12 2142 2147 2163 2250 2346 2419 2481 2489 2523 2581 2669 2728 2757 2757
TOTAL 7808 7952 8108 8261 8419 8550 8693 8781 8875 8967 9077 9177 9258 9315
MANASSAS CITY PUBLIC SCHOOLS PROJECTED ENROLLMENT LOW-RANGE
Using the Low-Range projection model, student enrollment in Manassas City Public Schools is
projected to increase from 7,575 students in 2015-16 to 8,802 students in 2029-30, an
increase of 1,227 students or 16.2%.
Data Chart - Manassas City Public Schools Projected Enrollment Low-Range
P a g e | 11
Manassas City Public SchoolsGRADE 2016 2017 2018 2019 2020 2021 2022 2023 2024 2025 2026 2027 2028 2029
-17 -18 -19 -20 -21 -22 -23 -24 -25 -26 -27 -28 -29 -30
Pre- 37 37 37 37 37 37 37 37 37 37 37 37 37 37
School
Sp/Ed 70 70 71 72 74 76 76 77 78 78 79 80 80 81
VPI 216 216 216 216 216 216 216 216 216 216 216 216 216 216
K 611 640 644 657 659 665 671 677 683 689 695 701 707 713
1 575 619 648 652 666 668 674 680 686 692 698 704 710 716
2 602 558 600 629 632 646 648 654 660 665 671 677 683 689
3 577 581 539 579 607 610 623 625 631 637 642 648 653 659
4 587 572 576 534 574 601 604 617 619 625 631 636 642 647
5 582 591 576 580 538 578 606 609 622 624 630 636 641 647
6 588 589 598 583 587 545 585 614 617 630 632 638 644 649
7 517 583 584 593 578 582 540 580 609 612 625 627 633 638
8 527 509 573 574 583 569 572 531 570 599 602 615 617 623
9 603 643 621 700 701 712 695 698 648 696 731 735 751 753
10 520 502 535 517 583 584 593 579 581 539 579 609 612 625
11 464 485 468 499 482 544 545 553 540 542 503 540 568 571
12 497 440 460 443 473 457 515 516 524 512 514 477 512 538
Total 7573 7635 7746 7865 7990 8090 8200 8263 8321 8393 8485 8576 8706 8802
Data Chart - Manassas City Public Schools Projected Enrollment by School Level Low-Range
LEVEL 2016 2017 2018 2019 2020 2021 2022 2023 2024 2025 2026 2027 2028 2029
-17 -18 -19 -20 -21 -22 -23 -24 -25 -26 -27 -28 -29 -30
Pre-K-4 3275 3293 3331 3376 3465 3519 3549 3583 3610 3639 3669 3699 3728 3758
5-6 1170 1180 1174 1163 1125 1123 1191 1223 1239 1254 1262 1274 1285 1296
7-8 1044 1092 1157 1167 1161 1151 1112 1111 1179 1211 1227 1242 1250 1261
9-12 2084 2070 2084 2159 2239 2297 2348 2346 2293 2289 2327 2361 2443 2487
TOTAL 7573 7635 7746 7865 7990 8090 8200 8263 8321 8393 8485 8576 8706 8802
MANASSAS CITY PUBLIC SCHOOLS PROJECTED ENROLLMENT HIGH-RANGE
Using the High-Range projection model, student enrollment in Manassas City Public Schools is
projected to increase from 7,575 students in 2015-16 to 10,067 students in 2029-30, an
increase of 2,492 students or 32.9%.
Data Chart - Manassas City Public Schools Projected Enrollment High-Range
GRADE 2016- 2017- 2018- 2019- 2020- 2021- 2022- 2023- 2024- 2025- 2026- 2027- 2028- 2029-
17 18 19 20 21 22 23 24 25 26 27 28 29 30
Pre- 37 37 37 37 37 37 37 37 37 37 37 37 37 37
School
Sp/Ed 74 76 79 82 84 85 86 87 88 88 89 90 91 92
VPI 216 216 216 216 216 216 216 216 216 216 216 216 216 216
P a g e | 12
Manassas City Public SchoolsK 688 720 724 739 741 748 755 762 769 776 783 790 797 804
1 645 695 727 731 746 748 755 762 769 776 783 791 798 805
2 604 629 678 709 713 728 730 737 743 750 757 764 772 779
3 581 583 607 655 685 689 703 705 712 718 724 731 738 746
4 591 579 581 605 652 682 686 700 702 709 715 721 728 735
5 594 605 592 594 619 667 698 702 716 718 725 731 738 745
6 595 599 610 597 599 625 673 704 708 722 724 731 738 745
7 513 587 591 602 589 591 616 664 694 698 712 714 721 728
8 523 503 576 580 590 578 580 604 651 681 685 698 700 707
9 578 614 591 677 681 693 679 681 710 765 800 805 820 822
10 550 528 561 540 619 622 633 620 622 649 699 731 736 749
11 526 530 509 540 520 596 599 610 597 599 625 673 704 709
12 499 484 488 469 497 479 549 552 562 550 552 576 620 648
Total 7814 7985 8167 8373 8588 8784 8995 9143 9296 9452 9626 9799 9954 10067
Data Chart - Manassas City Public Schools Projected Enrollment by School Level High-Range
LEVEL 2015- 2016- 2017- 2018- 2019- 2020- 2021- 2022- 2023- 2024- 2025- 2026- 2027- 2028- 2029-
16 17 18 19 20 21 22 23 24 25 26 27 28 29 30
Pre- 3386 3436 3535 3649 3774 3874 3933 3968 4006 4036 4070 4104 4140 4177 4214
K-4
5-6 1132 1189 1204 1202 1191 1218 1292 1371 1406 1424 1440 1449 1462 1476 1490
7-8 1031 1036 1090 1167 1182 1179 1169 1196 1268 1345 1379 1397 1412 1421 1435
9-12 2227 2153 2156 2149 2226 2317 2390 2460 2463 2491 2563 2676 2785 2880 2928
TOTAL 7776 7814 7985 8167 8373 8588 8784 8995 9143 9296 9452 9626 9799 9954 10067
CONCLUSION
Manassas City Public Schools are expected to experience significant enrollment growth over the
study period. It is likely this growth will continue to be ethnically diverse with much of it
coming from areas of affordable multifamily housing. New residential development will also
generate additional students for the School Division. The unit type and cost of this new
development will impact the number of students it generates. Changes to the existing housing
inventory (for example, redevelopment of currently affordable housing areas) could impact
these projections significantly. The enrollment projections contained in this report are based
upon the best information available at the time. Changes in the economy, employment,
immigration and numerous other factors can and will affect the accuracy of these projections.
The School Division is encouraged to pay close attention to the variables that affect public
school enrollment and to update these projections on a regular basis.
P a g e | 13
Manassas City Public Schools10500
10000
9500
9000 Actual
8500
Proj Low
8000
7500 Proj Mid-Range
7000
6500 Proj High
6000
2025-26
2006-07
2007-08
2008-09
2009-10
2010-11
2011-12
2012-13
2013-14
2014-15
2015-16
2016-17
2017-18
2018-19
2019-20
2020-21
2021-22
2022-23
2023-24
2024-25
2026-27
2027-28
2028-29
2029-30
C A P A C I T Y A NA L Y S I S
Understanding and accurately capturing school capacity has become increasingly important as
the Manassas City Public Schools attempt to meet the challenge of increasing enrollment. An
accurate assessment of how many students a school can accommodate will allow MCPS to
quickly assess appropriate program placement and develop student accommodation solutions.
School capacity assessments help to ensure classroom spaces meet the needs of multiple
and/or changing instructional programs. In addition to current programmatic and enrollment
challenges, accurate capacity assessments are necessary to formulate long-term facility plans.
SCHOOL CAPACITY—INFORMATION AND ASSESSMENT
It is important to note that school capacity is measured differently depending upon the school
type. For instance, elementary schools are calculated based upon the number of core
classrooms and self-contained special education rooms. Intermediate schools are calculated
based on the number of core classrooms including support areas such as gyms, art rooms and
music rooms and include an appropriate utilization factor. Middle and high school capacity is
far more complex than that in elementary and intermediate schools. The capacity of these
schools is based upon the required core programs, the various elective options available and
appropriate utilization factors for both core and elective areas.
The additional temporary capacity provided by classroom trailers is not included in the school
capacity calculations.
ELEMENTARY SCHOOL (PREK-4) CAPACITY
The elementary school capacity model attempts to standardize the support space available in
each school. One classroom or instructional area has been allocated for each of the following
uses: art, computer lab, music, and a science/STEM lab. The use of laptop computer carts
P a g e | 14
Manassas City Public Schoolsallows technology to be brought to the
ELEMENTARY SCHOOLS:
classroom thus reducing the need for
classrooms to be dedicated to computer Standard number of rooms for computer
labs. Rooms previously used as computer labs, STEM, music and art
labs are now included in the inventory of Utilized less than full size rooms for
available classrooms and assigned a speech, reading and special education
capacity. The requirements for resource where appropriate
space for intervention teachers, ESOL, Included space for expansion of VPI
speech, reading, counseling, and various program
other small group activities were reviewed Assigned appropriate capacity to VPI and
at each school to make sure appropriate Special Education classrooms
space was provided. These resource areas Used an “average” staffing ratio of 23
were not assigned a capacity. The remaining classrooms were assigned a capacity based upon
the typical staffing ratio of 23:1 for grades K-3 (It is noted that 4th grade classes have a slightly
higher staffing ratio and some schools have a slightly lower K-3 ratio. After reviewing these
situations, it was determined that an overall ratio of 23:1 would provide a reasonable average
for the capacity calculation.). Likewise, classrooms used for special education were assigned a
capacity appropriate to the specific self-contained special education program(s) accommodated
in the building. Multiplying the number of classrooms by the appropriate pupil/teacher ratio
provides the capacity for each facility.
The Manassas City Public Schools also offers Pre-Kindergarten and VPI services to
approximately 200 students. The capacity of classrooms (at the appropriate pupil/teacher ratio)
used for these programs is included in the elementary school capacities.
DATA CHART - Manassas City Public Schools Comparison of Updated and Old Elementary
Capacities
SCHOOL UPDATED OLD CAPACITY CHANGE
CAPACITY
New Baldwin 706 585 121
Dean 727 653 74
Haydon 667 585 82
Round 669 585 84
Weems 713 585 128
Total 3482 2993 489
P a g e | 15
Manassas City Public SchoolsINTERMEDIATE SCHOOL (5-6) CAPACITY
Like the elementary capacity model, the intermediate school model standardizes the number of
classrooms allocated for computer labs. In this case, one lab is allowed for each grade level (or
two labs total). The intermediate program
INTERMEDIATE SCHOOLS:
scheduling is somewhat different than that
of an elementary school in that Standard number of rooms for computer
intermediate level students change classes, labs, STEM, music and art.
on a limited basis, for special programs Utilized less than full size rooms for speech,
and electives. The intermediate capacity reading, and special education where
model assigns capacity to all teaching appropriate.
stations including the music rooms, art Used a staffing ratio of 28
rooms, and gym. The total number of Applied a utilization factor of 75%
regular teaching stations is then multiplied
by the current staffing ratio of 28:1 to calculate the gross capacity. A utilization factor that
recognizes the scheduling inefficiency of students changing classes is applied to the gross
capacity to calculate the net capacity of the building. At the intermediate school level the
utilization factor is 75% for all regular classes. The capacity of classrooms used for self-
contained special education programs is calculated based upon the appropriate pupil/teacher
ratio for the specific special education program (with no utilization reduction) and added to the
net capacity to attain the total program capacity for the intermediate school building.
DATA CHART - Manassas City Public Schools Comparison of Updated and Old Intermediate
Capacity
SCHOOL UPDATED OLD CAPACITY CHANGE
CAPACITY
Mayfield 1104 1043 61
Note: An additional 336 student intermediate capacity will be available at Baldwin when the new
building opens in 2016-17
MIDDLE SCHOOL (7-8) CAPACITY MIDDLE SCHOOLS:
Typically there are two approaches to Standard number of rooms for computer labs.
calculating middle school capacity. For Included capacity for “Johnson Wing” at H/S
those middle schools that are organized with Used a staffing ratio of 28 except for H/S
a family structure where the same students English and Science, which used 25.
attend their core classes together then Applied a utilization ratio of 75% to academic
branch off to their unique electives, the areas
capacity model would be based on the Assigned capacity to elective areas (gym,
number of core classrooms available. Where music CTE) with a utilization factor of 60%.
middle schools operate more like a junior
P a g e | 16
Manassas City Public Schoolshigh school, with students attending both core and elective classes based on their own unique
schedule, the capacity model is more like one used for a high school were all teaching areas are
given a capacity. Middle school scheduling in Manassas City Public Schools more closely
resembles that of a junior high school. In calculating the middle school capacity classrooms
were divided into three categories: core classrooms, elective classrooms, and special education
classrooms. Core and elective classrooms were assigned a class load based upon a
pupil/teacher ratio of 28:1. The class load for self-contained special education classrooms was
based upon the appropriate pupil/teacher ratio for the program. Likewise, three different
utilization factors were applied: core classrooms received a utilization factor of 75%, elective
classrooms 60%, and special education classrooms 100%. The number of classrooms in each
category was multiplied by the appropriate class load and utilization factor and the outcomes
were summed to generate the program capacity for the middle school building.
DATA CHART - Manassas City Public Schools Comparison of Updated and Old Middle School
Capacity
SCHOOL UPDATED OLD CAPACITY CHANGE
CAPACITY
Metz 1543 1337 206
HIGH SCHOOL (9-12) CAPACITY
High school students typically follow a schedule that is unique to each student and they change
classes every period. The high school capacity model aggregates classrooms into four
categories: core classrooms, English and science classrooms, elective classrooms, and special
education classrooms. Core and elective classrooms were assigned a class load based upon a
pupil/teacher ratio of 28:1, English and
science classrooms were assigned a class load HIGH SCHOOLS:
of 25:1 (based upon the state Department of
Standard number of rooms for computer
Education class size cap for English and the
labs.
square footage and design of the science
Included capacity for “Johnson Wing” at H/S
classrooms), the class load for self-contained
Used a staffing ratio of 28 except for H/S
special education classrooms was based upon
English and science, which used 25.
the appropriate pupil/teacher ratio for the
Applied a utilization ratio of 75% to academic
program. Likewise, three different utilization
areas
factors were applied: core, English and science
Assigned capacity to elective areas (gym,
classrooms received a utilization factor of 75%
music CTE) with a utilization factor of 60%.
(again reflecting difficulty in scheduling and
teachers holding classes 6 out of 8 available
blocks), elective classrooms 60%, and special education classrooms 100%. The number of
classrooms in each category was multiplied by the appropriate class load and utilization factor
and the outcomes were summed to generate the program capacity for the middle school
P a g e | 17
Manassas City Public Schoolsbuilding. It should be noted that providing work areas for teachers outside of their assigned
classrooms would allow those classrooms to be used for instruction for more periods (blocks)
each day, effectively increasing the utilization factor and the resulting building capacity of both
the high school and middle school.
DATA CHART - Manassas City Public Schools Comparison of Updated and Old High School
Capacity
SCHOOL UPDATED OLD CAPACITY CHANGE
CAPACITY
Osbourn 2428 2011 417
Note: Updated capacity includes build-out of the Johnson Wing, which was not included in the
old capacity
COMPARISON OF UPDATED CAPACITIES VS. PROJECTED ENROLLMENTS
The following charts compare the updated capacities with projected enrollments through the
2029-30 schools year.
DATA CHART - Manassas City Public Schools Comparison of Elementary Capacity and Projected
Enrollment
Elementary School (Grades PreK-4) Capacity vs. Projections
Mid-Range Low High
Year Capacity Projection Difference Projection Difference Projection Difference
2016-17 3482 3428 54 3275 207 3436 46
2017-18 3482 3498 -16 3293 189 3535 -53
2018-19 3482 3569 -87 3331 151 3649 -167
2019-20 3482 3627 -145 3376 106 3774 -292
2020-21 3482 3662 -180 3465 17 3874 -392
2021-22 3482 3670 -188 3519 -37 3933 -451
2022-23 3482 3667 -185 3549 -67 3968 -486
2023-24 3482 3685 -203 3583 -101 4006 -524
2024-25 3482 3713 -231 3610 -128 4036 -554
2025-26 3482 3745 -263 3639 -157 4070 -588
2026-27 3482 3776 -294 3669 -187 4104 -622
2027-28 3482 3804 -322 3699 -217 4140 -658
2028-29 3482 3835 -353 3728 -246 4177 -695
2029-30 3482 3867 -385 3758 -276 4214 -732
Note: Includes capacity of new Baldwin (706) beginning in the 2016-17 school year
P a g e | 18
Manassas City Public SchoolsDATA CHART - Manassas City Public Schools Comparison of Intermediate Capacity and
Projected Enrollment
Intermediate School (Grades 5-6) Capacity vs. Projections
Mid-Range Low High
Year Capacity Projection Difference Projection Difference Projection Difference
2016-17 1440 1185 255 1170 270 1189 251
2017-18 1440 1200 240 1180 260 1204 236
2018-19 1440 1196 244 1174 266 1202 238
2019-20 1440 1188 252 1163 277 1191 249
2020-21 1440 1220 220 1125 315 1218 222
2021-22 1440 1278 162 1123 317 1292 148
2022-23 1440 1329 111 1191 249 1371 69
2023-24 1440 1332 108 1223 217 1406 34
2024-25 1440 1314 126 1239 201 1424 16
2025-26 1440 1313 127 1254 186 1440 0
2026-27 1440 1322 118 1262 178 1449 -9
2027-28 1440 1336 104 1274 166 1462 -22
2028-29 1440 1348 92 1285 155 1476 -36
2029-30 1440 1359 81 1296 144 1490 -50
Note: Includes capacity of new Baldwin Intermediate beginning in the 2016-17 school-year
DATA CHART - Manassas City Public Schools Comparison of Middle School Capacity and
Projected Enrollment
Middle School (Grades 7-8) Capacity vs. Projections
Mid-Range Low High
Year Capacity Projection Difference Projection Difference Projection Difference
2016-17 1543 1053 490 1044 499 1036 507
2017-18 1543 1107 436 1092 451 1090 453
2018-19 1543 1180 363 1157 386 1167 376
2019-20 1543 1196 347 1167 376 1182 361
2020-21 1543 1191 352 1161 382 1179 364
2021-22 1543 1183 360 1151 392 1169 374
2022-23 1543 1216 327 1112 431 1196 347
2023-24 1543 1275 268 1111 432 1268 275
2024-25 1543 1325 218 1179 364 1345 198
2025-26 1543 1328 215 1211 332 1379 164
2026-27 1543 1310 233 1227 316 1397 146
2027-28 1543 1309 234 1242 301 1412 131
2028-29 1543 1318 225 1250 293 1421 122
2029-30 1543 1332 211 1261 282 1435 108
P a g e | 19
Manassas City Public SchoolsDATA CHART - Manassas City Public Schools Comparison of High School Capacity and Projected
Enrollment
High School (Grades 9-12) Capacity vs. Projections
Mid-Range Low High
Year Capacity Projection Difference Projection Difference Projection Difference
2016-17 2428 2142 286 2084 344 2153 275
2017-18 2428 2147 281 2070 358 2156 272
2018-19 2428 2163 265 2084 344 2149 279
2019-20 2428 2250 178 2159 269 2226 202
2020-21 2428 2346 82 2239 189 2317 111
2021-22 2428 2419 9 2297 131 2390 38
2022-23 2428 2481 -53 2348 80 2460 -32
2023-24 2428 2489 -61 2346 82 2463 -35
2024-25 2428 2523 -95 2293 135 2491 -63
2025-26 2428 2581 -153 2289 139 2563 -135
2026-27 2428 2669 -241 2327 101 2676 -248
2027-28 2428 2728 -300 2361 67 2785 -357
2028-29 2428 2757 -329 2443 -15 2880 -452
2029-30 2428 2757 -329 2487 -59 2928 -500
P a g e | 20
Manassas City Public SchoolsM A NA S S A S C I T Y P U B LI C S C H O O LS G R A D E
R EC O NF I G U R A T I O N S T U D I ES
The programs and grade levels assigned to a specific school facility significantly impact the
number of students that facility can accommodate. For example, at the elementary level, pupil
teacher ratios tend to be somewhat lower for the primary grades than for upper elementary
grades, thus a school housing only students in grades K-3 could be expected to have a lower
capacity than a school housing students in grades K-5. Reviewing the current grade
configuration of Manassas City Public Schools (MCPS) and looking at various grade
reconfiguration opportunities will allow the MCPS to identify the most desirable and efficient
grade configuration for their facilities and programs.
CURRENT CONDITIONS
MCPS are currently organized to accommodate Pre-Kindergarten through fourth grades
students in five elementary schools (Baldwin, Dean, Haydon, Round and Weems). Students in
grades five and six attend Mayfield Intermediate School, students in grades seven and eight
attend Metz Middle School and students in grades nine through twelve attend Osbourn High
School. Special Education students are accommodated by the assigned schools for their
program/grade level. System wide enrollments are at or somewhat below capacity,
however; there are imbalances at individual schools most notably at the elementary level where
enrollment exceeds capacity at both Baldwin and Weems (based on the revised capacities
contained in this report). Enrollment at Mayfield Intermediate School is also slightly above
capacity while both Metz Middle and Osbourn High School have capacity
surpluses. Opening the new Baldwin Elementary/Intermediate School (designed as a school
within a school housing an elementary and intermediate program) in the 2016-17 school year
will provide a net capacity increase of about 120 student spaces at the elementary school level
and roughly 300 student spaces at the intermediate school level. The additional capacity
provided by the new Baldwin facility along with some redistricting will provide an opportunity to
bring all MCPS school enrollments within capacity for the near term.
MCPS school buildings are generally in good condition although a number of the facilities are
reaching the age where significant renovations should be planned for. The existing Baldwin
Elementary School is in poor condition but will be replaced in the 2016-17 school year with the
new Baldwin facility discussed above. Dean Elementary School, built in the late 1950’s is the
district’s oldest elementary school building and has been recommended for replacement rather
than renovation. Planned replacement of this building provides an opportunity for MCPS to
consider different grade configurations to help accommodate projected enrollment growth
and future program requirements.
P a g e | 21
Manassas City Public SchoolsFUTURE CONDITIONS
Enrollment growth is projected for MCPS through the 2029-30 school year. System-wide
enrollment in the 2029-30 school year is expected to exceed 9,300 students creating a need
for additional elementary and high school capacity. MCPS will need to consider building
additional capacity and reorganizing some existing space to accommodate this projected
growth, reconfiguration of current grade level assignments may also provide an efficient way to
address both capacity and program requirements.
GRADE RECONFIGURATION SCENARIOS
During the course of the MCPS Facilities Study numerous grade level reconfiguration scenarios
were discussed including;
Maintain the current grade configuration including the new Baldwin
Elementary/Intermediate School
Replace Dean Elementary with a new intermediate school, reconfigure to Pre K-3
elementary and grades 4-6 intermediates
Replace Dean Elementary with a new intermediate school, reconfigure to K-3 elementary
and grades 4-6 intermediates, create a VPI Center at Metz Middle School
Replace Dean Elementary with a new intermediate school containing a space for a VPI
Center, reconfigure to K-3 elementary and grades 4-6 intermediates, create a satellite
CTE space at Metz
After much discussion and review two scenarios emerged as the most likely and cost effective
ways to address future space and program requirements, these scenarios are described below.
SCENARIO 1
This scenario maintains the current grade configuration of PreK-4, 5-6, 7-8 and 9-12. The
new Baldwin facility would continue to house approximately 300 intermediate school
students. Capacity deficits at the elementary school level would be addressed by construction
of two new 600 student capacity elementary schools. The first new elementary school would be
a replacement for the current Dean Elementary School and would be built on the Dean site, this
facility would open in the 2021-22 school year. The second new elementary school would also
have capacity for 600 students and would be a site adaptation of the Dean replacement
school. This facility would open for the 2022-23 school year at a site to be determined. It
should be noted that a site for the second school is not currently available and would have to
be acquired through dedication or purchase. Additional high school capacity would be created
by providing teacher work areas outside of the classroom. Providing these work areas will
allow utilization of existing academic classrooms to increase from approximately 70% to 90%
which will result in a capacity increase sufficient to accommodate future high school
enrollment. The cost associated with providing the work rooms is relatively small and could be
P a g e | 22
Manassas City Public Schoolstreated as an operating cost rather than a capital improvement expenditure. To meet capacity
requirements the work rooms should be available by the 2021-22 school year but could be
done sooner if so desired.
The anticipated total construction cost for this scenario is approximately $53,849,000 plus the
cost for acquisition of a second elementary school site if one cannot be obtained through
dedication.
Membership and capacity comparisons for this scenario are as follows:
SCENARIO 2
This scenario changes the current grade configuration to K-3, 4-6, 7-8 and 9-12. The current
Dean Elementary School would be replaced with a new 1,000 student capacity intermediate
school. Capacity at the new Baldwin facility used for intermediate students would be converted
P a g e | 23
Manassas City Public Schoolsto a district-wide Pre-Kindergarten center. Creating the Pre-K center at Baldwin will allow Pre-
K classrooms at the other elementary schools to revert to K-3 general education classrooms
which will provide a slight capacity increase capacity at those facilities. An elementary capacity
deficit in the out-years of the scenario would be addressed by construction of a six classroom
addition at one of the existing elementary schools.
The new intermediate school on the Dean site would open in the 2021-22 school year, at that
time fourth grade students would be transferred from the elementary schools to the
intermediate schools and the Pre-K programs would move to Baldwin. The six classroom
elementary school addition would be completed for the 2027-28 school year. As in Scenario #1
additional high school capacity would be created by providing teacher work areas outside of the
classroom. Providing these work areas will allow utilization of existing academic classrooms to
increase from approximately 70% to 90% which will result in a capacity increase sufficient to
accommodate future high school enrollment.
The cost associated with providing the work rooms is relatively small and could be treated as an
operating cost rather than a capital improvement expenditure. To meet capacity requirements
the work rooms should be available by the 2021-22 school year but could be done sooner if so
desired.
The anticipated total construction cost for this scenario is approximately $49,050,000.
Membership and capacity comparisons for this scenario are as follows:
P a g e | 24
Manassas City Public SchoolsRECOMMENDATION
After reviewing both scenarios it appears that Scenario #2 provides the best long term solution
for addressing MCPS facilities requirements. The advantages of Scenario #2 include lower
capital costs, provision of similarly sized intermediate schools, no requirement for additional
school sites, less redistricting disruption at the elementary level and provision of a unified
center for Pre-K programs. The K-3 configuration will allow for a concentration of Kindergarten
and primary grade level materials and instruction at the elementary schools. Construction of
the new intermediate school at the Dean site could take place while Dean Elementary school is
still in operation. Possible joint use of facilities could be explored as Manassas City begins
plans for development of the park land adjacent to the Dean site.
P a g e | 25
Manassas City Public SchoolsF A C I L I T I ES R E VI EW
On May 27th and 28th of 2015, walkthroughs of 8 Manassas City Public Schools (MCPS) where
done by Citygate and MCPS representatives. The purpose of the walkthrough was to become
familiar with the various school buildings in the MCPS system. Photographs (540 in total) of
various interior and exterior spaces were taken. The walkthroughs were followed up with later
visits on August 5th and September 16th, 2015.
EVALUATION PROCESS
In order to evaluate a building’s conditions accurately, proper weights were given to the various
elements under review in order to create an accurate matrix. As building components are not
of the same weight, determination of the weights are based on past experience and work
performed at other school districts. Condensed versions of the major headings are provided
below:
No System Weights Remarks
1 Enclosure System 0.25 High due to size of system
2 Structural System 0.25 High due to size and cost
3 Mechanical System 0.15 Medium due to cost
4 Electrical System 0.15 Medium due to cost
5 Fire Safety System 0.05 The weight of existing adequately functional
systems may be low while new required systems
would be high
6 Finishes System 0.05 Low due to priority
7 Conveyor System 0.05 Low due to 1 or 2 story nature of buildings/ADA
8 Site-work System 0.05 Low due to nature of being exterior
It is understandable and generally accepted that larger surface areas of a building contribute to
mechanical system’s inefficiencies. If a building is designed to spread out in a single story
layout it may be difficult to reimagine the building in a vertical or more compact design with
less surface area (by contracting the wings of a building to expand vertically). However, careful
analysis may provide alternative options of adapting the curriculum, which is more flexible to
accommodate the physical realities of a building, then to implement architectural treatments for
better place making by identifying the characters that are sought after in an appropriate school
facility.
P a g e | 26
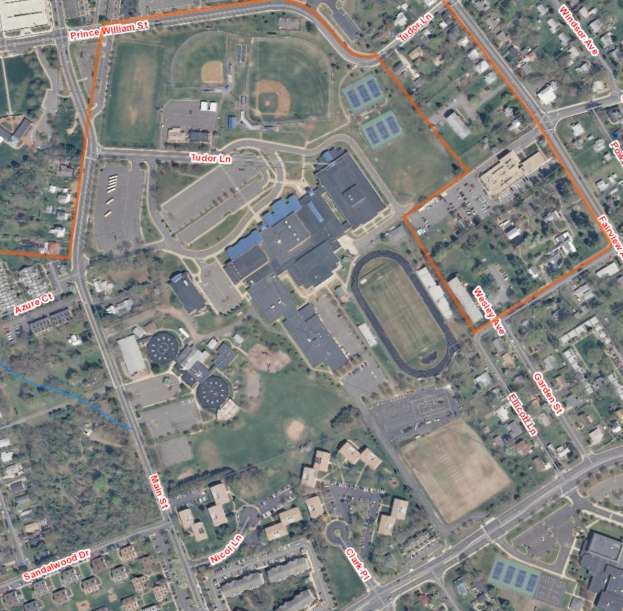
Manassas City Public SchoolsLOCATION MAP
1- Baldwin Elementary School (new building planned)
2- R. C. Haydon Elementary School
3- Jennie Dean Elementary School
4- George C Round Elementary School
5- Weems Elementary School
6- Mayfield Intermediate School
7- Metz Middle School
8- Osbourn High School
P a g e | 27
Manassas City Public SchoolsSCHOOL AVAILABLE DATA
The following table was developed by reviewing the engineering drawings for each facility then
making field measurements of the interior and exterior spaces at each school. For each school,
the exterior areas were also verified by making measurements using the GIS data from the City
of Manassas.
Schools Year of First Acreage Sq. Ft. # Portable Sq. Ft. Sq. Ft
Construction Schools Units Portables Total
w/portables
Baldwin Elementary 1961 14.13 60,087 5 (4dw-1 SW) 4,152 64,239
Haydon Elementary 1978 27.25 73,704 3 2,664 76,368
Dean Elementary 1958 24.30 89,317 0 n/a 89,317
Round Elementary 1985 20.45 76,557 0 n/a 76,557
Weems Elementary 1977 15.30 74,244 5 (dw) 4,440 78,684
Mayfield Intermediate 2005 13.15 149,911 0 na 149,911
Grace E. Metz Middle 1990 37.08 209,124 0 n/a 209,124
Osbourn High 1953 50.56 338,876* 0 n/a 338,876
All Totals (Ed space) 187.67 1,071,880 13 11,256 1,083,136
P a g e | 28
Manassas City Public SchoolsB A LD W I N E L EM E N T A R Y S C H O O L
9705 MAIN ST., MANASSAS, VA 20110
SITE FROM SATELLITE
This school is planned to be replaced
P a g e | 29
Manassas City Public SchoolsR . C H A Y D O N E L EM E NT A R Y S C H O O L
9075 PARK AVE., MANASSAS, VA 20110
Figure 1 - Panoramic View of Haydon Cafeteria - Source: Citygate
OBSERVATIONS
Well maintained but due for a full renovation including finishes and adding space for small work
groups etc. as in the new Baldwin replacement. Note: the interior classrooms near the addition
have no windows or other source of natural light - should be addressed during a renovation.
Some of the issues include changing of windows and the building automation system.
SITE
Opened: 1979
Addition: 2007
Age in 2030: 52 Years
Parking lot: Some improvements are needed to the walkways. Past repairs have already been
made in some areas and additional repairs to the sidewalks are required in the next few years.
There are also areas where the pavement has cracks, which should be repaired.
P a g e | 30
Manassas City Public SchoolsOn-site bus queuing is not adequate. Although a large circular drive makes a good loop for bus
queuing, morning backups occur at times and require staff intervention. The School was
opened in 1979 and although it has 27.25 acres of land, which is fairly large for a school,
parking, kiss-n-ride, and other facilities are not well designed.
SITE FROM AERIAL MAP:
The athletic areas and associated grandstands are limited at this school. The school also has
limited play areas.
P a g e | 31
Manassas City Public SchoolsBUILDING ENVELOPE
The building is concrete with masonry veneer. The building exterior is in good condition with
no recommended improvements.
Exposed structural steel: None
The windows and doors at this school are maintained and appear to be in good condition.
However, over the 2020-2030 period some may need to be replaced due to age.
ROOF AND SIDING:
The school building has 2 roof types: flat rubber roof and metal. Plan for an addition, which is
outlined in red, was completed in 2006 and executed in 2007. The addition and portable units
(2664 sq. ft.) make the total area of the school 76,368 sq. ft. The main roof is 37 years old and
has already passed its life span. The flat roof over the mechanical room was changed in 2011-
12. The remaining flat roof was installed as a part of the construction in 2006-07. It is
recommended that the main roof be replaced before 2020. The roof on the addition is good for
the next 25 years. The metal roof is planned for replacement in 2016-2017 school year.
The gutters and downspouts were replaced and are in good condition.
P a g e | 32
Manassas City Public SchoolsINTERIOR
The interior of the school is well maintained with no observable issues with the doors, windows,
and/or their glazing. The floors, walls, and ceilings are also in good condition. The toilet
partitions and some of the sinks were replaced in 2010. They are generally in good condition.
The circulation plan and the instructional areas for this school are 37 years old and spaces do
not lend themselves to 21st century learning environment.
Chalkboards/tack boards: good condition
P a g e | 33
Manassas City Public SchoolsMECHANICAL PLUMBING
Majority of HVAC equipment is original. HVAC Control was replaced in 1999 and the cooling
tower was replaced in 2009. Boilers were replaced in 2013. Boiler life expectancy depends
upon the type of boiler purchased. The average expectancy of a traditional gas boiler is
between 10 and 15 years, if well maintained and serviced annually. The boilers should be
planned for replacement in 2027.
Air conditioning control unit was replaced in 1999, should be planned for replacement in 2019.
Cooling tower was replaced in 2009. It will require replacement in 2029-2039. Heating
system/pumps: Water Heater: Main water heater was replaced in 2000. Other water heaters
replaced in 2012 and 2014. Water source heat pumps are scheduled to be replace in school
year 2016-2017.
ELECTRICAL
All electrical panel boxes are in order and breakers are working properly.
Receptacles: Adequate and in good condition
Interior Light: Adequate and in good condition
Generator: All electrical panel boxes are in good order and breakers properly working. This
school has a backup generator, which appears to be in good condition.
P a g e | 34
Manassas City Public SchoolsSite Lighting/Field Lighting: Needs improvement. Installation of more efficient lighting systems
is recommended.
R. C HAYDON: FACILITY GRADE
No. System Weights Score in percentage Weighted Score
1 Enclosure System 0.25 85 21.25
2 Structural System 0.25 85 21.25
3 Mechanical System 0.15 85 12.75
4 Electrical System 0.15 95 14.25
5 Fire Safety System 0.05 90 4.5
6 Finishes System 0.05 80 4
7 Conveyor System 0.05 100 5
8 Site work System 0.05 80 4
1 Total Possible Points 100 87
RECOMMENDATION
This is a well maintained school but due for a full renovation including finishes and adding
space for small work groups etc. as in the new Baldwin replacement. It is recommended that a
major renovation be planned around 2024 when a refurbishment of the HVAC may be required.
P a g e | 35
Manassas City Public SchoolsJ E N NI E D EA N EL E M E N T A R Y S C H O O L
9601 PRINCE WILLIAM ST, MANASSAS, VA 20110
Figure 2 - Panoramic View of entrance - Source Citygate
OBSERVATIONS
Although well maintained, Jennie Dean Elementary School is the oldest school in the system.
The school could be renovated, however, the cost would be high and the building doesn't lend
itself to an energy efficient design. The building has a one level design with extension arms
resulting in large exterior and roof surfaces
SITE
Opened: 1959
Addition: 1977
Addition: 1990
Age in 2030 72 Years
Parking lot: The parking lot has sufficient parking
spaces. The parking surface will likely require
maintenance over the next few years. If the school is not
replaced, a complete resurfacing is recommended.
Side Walk/Stairs/Railing: Some concrete steps are
deteriorating due to age.
P a g e | 36
Manassas City Public SchoolsOn-site bus queuing: Although there are plenty of parking spaces and adequate space for bus
queuing there are occasional flow issues which require intervention.
Kiss n Ride: The kiss-n-ride is not adequate for this school. There are flow issues that require
intervention to keep the flow going during morning drop off.
Athletic/play Area/ Grandstands: Well kept indoor gymnasium.
Site Landscaping: Sufficient athletic play area with generally good landscaping.
SITE FROM AERIAL MAP:
School was opened in 1959 on 28.78 acres of land. Total building area is 89,317 sq ft.
BUILDING ENVELOPE
Concrete/Masonry Veneer/Sills: Masonry and concrete façade is in good condition.
Exposed Structural Steel: None
P a g e | 37
Manassas City Public SchoolsWindow/Door/Skylight: Solid core wood doors and windows in good shape
Ongoing maintenance has been performed on the exterior brick. However, repointing is
needed in areas where maintenance has not been performed. This area is approximately 1/3 of
the exterior brick. Current leaks into the interior areas exist because of the need for this
maintenance. Windows were replaced in 2004. Some have single panes such as the windows in
the gymnasium and auditorium.
ROOF/SIDING:
Roof was replaced in 1991 and then replaced in 2004 after 13 years. Roof is 12 years old. A
new roof will be required in another 4-5 years (2020). However, it is important to have roof
maintained and clear of any debris (drains clear).
Some downspouts appear to have a problem with drainage.
INTERIOR
The circulation plan and the instructional areas for this school are 57 years old and spaces do
not lend themselves to a 21st century learning environment.
Floor/Ceilings/Walls: Floors, ceilings, and walls are in good shape but will not meet new codes
and standards.
P a g e | 38
Manassas City Public SchoolsChalkboards/tack boards: Fairly good, windows were replaced in 2004
Toilet partitions/accessories: Toilet partition and accessories meet the requirement.
Auditorium seats/curtains: good condition
P a g e | 39
Manassas City Public SchoolsMECHANICAL PLUMBING
New HVAC was installed in 2004 and is still in good condition. The HVAC system will need to be
changed in 2024.
Chillers/Cooling Tower/Air Handling/Roof Equipment: This equipment was installed new in
2004. The life span is about 20 years, so predicted replacement in the year 2025.
Boiler/Pumps: The boilers and pumps were replaced in 2014 and appear to be in good
condition.
P a g e | 40
Manassas City Public SchoolsYou can also read