2020-2021 Winter Reliability Assessment - November 2020 - NERC
←
→
Page content transcription
If your browser does not render page correctly, please read the page content below
2020–2021 Winter Reliability Assessment
November 2020
Winter Reliability Assessment                                                              2

Table of Contents
Preface .............................................................................................................................................. 3   Regional Assessment Dashboards .................................................................................................. 13
About this Assessment ..................................................................................................................... 4              MISO ............................................................................................................................................... 14
Key Findings ...................................................................................................................................... 5      MRO-Manitoba Hydro .................................................................................................................... 15
Resource Adequacy .......................................................................................................................... 7             MRO-SaskPower ............................................................................................................................. 16
Changes from Year-to-Year .............................................................................................................. 8                 NPCC-Maritimes ............................................................................................................................. 17
Risk Highlights for Winter 2020–2021 .............................................................................................. 9                      NPCC-New England ........................................................................................................................ 18
                                                                                                                                                           NPCC-New York .............................................................................................................................. 19
                                                                                                                                                           NPCC-Ontario ................................................................................................................................. 20
                                                                                                                                                           NPCC-Québec ................................................................................................................................. 21
                                                                                                                                                           PJM ................................................................................................................................................. 22
                                                                                                                                                           SERC ................................................................................................................................................ 23
                                                                                                                                                           SPP .................................................................................................................................................. 26
                                                                                                                                                           Texas RE-ERCOT.............................................................................................................................. 27
                                                                                                                                                           WECC .............................................................................................................................................. 28
                                                                                                                                                           Data Concepts and Assumptions.................................................................................................... 31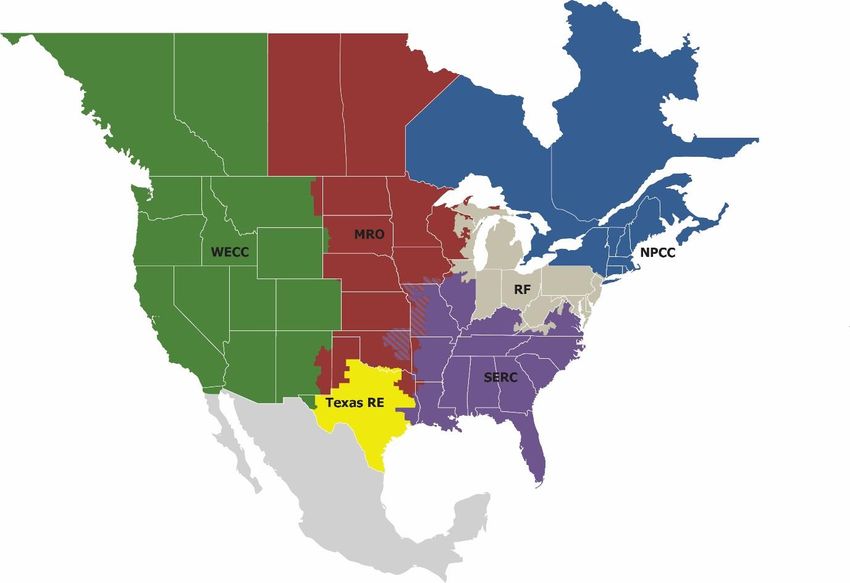
Winter Reliability Assessment 3
Preface
Electricity is a key component of the fabric of modern society and the Electric Reliability Organization (ERO) Enterprise serves to strengthen that fabric. The vision for the ERO Enterprise, which is comprised
of the North American Electric Reliability Corporation (NERC) and the six Regional Entities (REs), is a highly reliable and secure North American bulk power system (BPS). Our mission is to assure the effective
and efficient reduction of risks to the reliability and security of the grid.
Reliability | Resilience | Security
Because nearly 400 million citizens in North America are counting on us
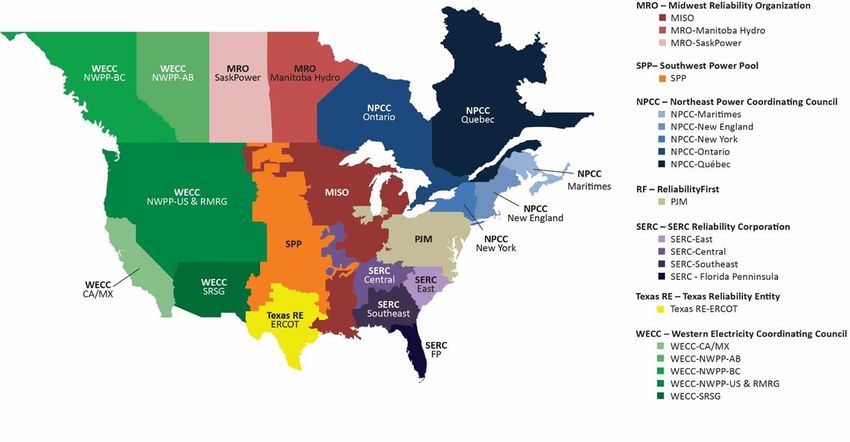
The North American BPS is made up of six RE boundaries as shown in the map and corresponding table below. The multicolored area denotes overlap as some load-serving entities participate in one RE
while associated Transmission Owners/Operators participate in another.
MRO Midwest Reliability Organization
NPCC Northeast Power Coordinating Council
RF ReliabilityFirst
SERC SERC Reliability Corporation
Texas RE Texas Reliability Entity
WECC WECC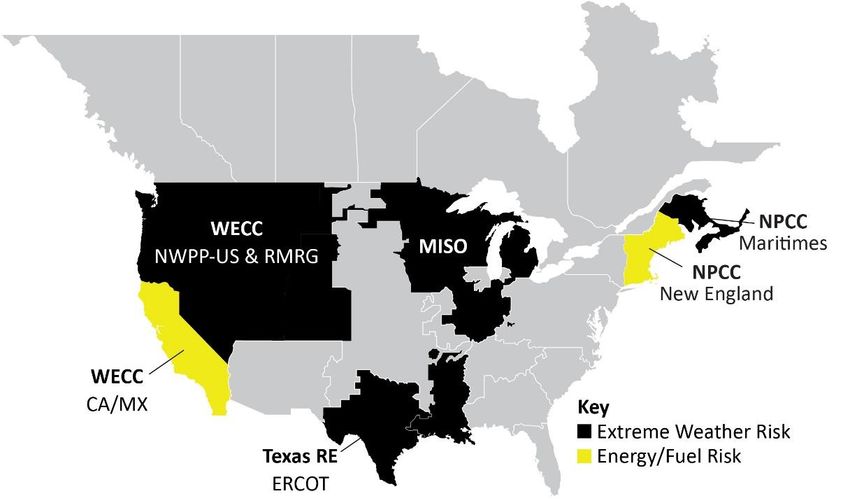
Winter Reliability Assessment                            4

About this Assessment
NERC’s 2020–2021 Winter Reliability Assessment (WRA) identifies, assesses, and reports on areas of concern regarding the reliability of the North American BPS for the upcoming winter season. In addition,
the WRA presents peak electricity demand and supply changes as well as highlights any unique regional challenges or expected conditions that might impact the BPS. The reliability assessment process is
a coordinated reliability evaluation between the Reliability Assessment Subcommittee (RAS), the Regional Entities, and NERC staff. This assessment reflects NERC’s independent assessment and is intended
to inform industry leaders, planners, operators, and regulatory bodies so they are better prepared to take necessary actions to ensure BPS reliability. The assessment also provides an opportunity for the
industry to discuss their plans and preparations to ensure reliability for the upcoming winter period.
Winter Reliability Assessment 5
Key Findings processes in support of fuel assurance that it began in 2018. Activities include routine
NERC’s annual WRA covers the upcoming three-month (December–February) 2020–2021 winter generator fuel surveys and a 21-Day Energy Assessment Forecast and Report to provide
period. This assessment provides an evaluation of generation resource and transmission system market participants with early indications of potential fuel scarcity conditions and inform
adequacy necessary to meet projected winter peak demands and operating reserves. This fuel procurement decisions.4 Enhanced coordination with the regional natural gas sector
assessment identifies potential reliability issues of interest and regional topics of concern. The continues as necessary.
following key findings represent NERC’s independent evaluation of electricity generation and California and the southwest area in the Western Interconnection rely on natural-gas-
transmission capacity and potential operational concerns that may need to be addressed for the fired generation capacity for over 60% of their on-peak demand. However, the area has
upcoming winter: limited natural gas storage and lacks redundancy in supply infrastructure. As a result,
Sufficient capacity resources are expected to be in-service for the upcoming winter: In all areas, electric generators face risk of fuel supply curtailment or disruption from extreme events
the Anticipated Reserve Margin meets or surpasses the Reference Margin Level,1 indicating that that impact natural gas supplies. Examples include natural gas pipeline disruption or
existing and planned resources in these areas are adequate to manage risk of a capacity freezing temperatures at natural gas production well-heads that reduce the flow of
deficiency under normal conditions (i.e., normal demand forecasts2). natural gas into the area. Because most on-peak demand is served by natural-gas-fired
generation, impacts to fuel supplies can result in energy emergencies on the BPS with a
Fuel supply and energy assurance risk remains a reliability concern in New England and
potential for load impacts.5
California: While Anticipated Reserve Margins indicate adequate resources are in service
throughout North American, fuel assurance risk remains a reliability concern in some assessment Extreme weather continues to pose risk to BPS reliability during the winter season: Extreme
areas. For natural gas, demand is growing as a generator fuel source and for traditional winter winter weather can challenge system operators and limit the availability of resources (e.g., wind
space heating needs. However, generating units that lack alternate fuel sources and/or firm generation blade icing, frozen coal piles, curtailment of natural gas pipelines). Harsh conditions
contracts for natural gas supply and transportation may not be able to deliver their dispatched characterized by extreme or prolonged cold temperatures over a large area of North America,
energy production profiles. such as those experienced during the cold snaps in January 2018 and 2019, create special
challenges in maintaining grid reliability in many parts of the North American BPS.6 Increased
New England generation continues to be limited by the availability of natural gas. While
demand caused by frigid temperatures, higher generator forced outage rates, and derated
even under abnormally cold conditions that can limit the delivery of natural gas to output of some generation resources in susceptible areas could create conditions that lead
electric power generators, the operational risk scenarios in this assessment show firm system operators to take emergency operating actions that may result in energy emergencies.
load can still be served. However, under a more severe and prolonged winter event— NERC’s operational risk assessment, which is presented in detail in the Risk Highlights for Winter
similar to what was observed in January 20183—limited oil inventories can lead to the 2020–2021 section, identifies BPS resource deficiencies in parts of North America that could
eventual loss of generation and firm load shed. ISO-New England continues to enhance occur during extreme winter weather. An operational risk assessment for each assessment area
is located in the Regional Assessment Dashboards:
1 4
The Reference Margin Level is typically based on load, generation, and transmission characteristics for each assessment ISO-New England posts the 21-Day Energy Assessment Forecast and Report on their Operations Reports web page:
area. In some cases, the Reference Margin Level is a requirement implemented by the respective state(s), provincial https://www.iso-ne.com/isoexpress/web/reports/operations/-/tree/21-Day-Energy-Assessment-Forecast-and-Report-
authorities, ISO/RTO, or other regulatory bodies. See Data Concepts and Assumptions section. Results
2 5 Western Interconnection Gas – Electric Interface Study:
Electricity demand projections, or load forecasts, are provided by each assessment area. Demand projections are based
on normal weather (50/50 distribution) and are provided on a coincident basis; this means that there is a 50% probability https://www.wecc.org/Reliability/Western%20Interconnection%20Gas-
that actual demand will be higher and a 50% probability that actual demand will be lower than the value provided for a Electric%20Interface%20Study%20Public%20Report.pdf
6 See the FERC and NERC staff report: January 2018 South Central United States Cold Weather Bulk Electric System Event
given season/year.
3
ISO-New England Winter 2017/2018 Recap: Historic cold snap reinforces findings in Operational Fuel-Security Analysis: FERC NERC Report: https://www.nerc.com/pa/rrm/ea/Documents/South_Central_Cold_Weather_Event_FERC-NERC-
Report_20190718.pdf
https://isonewswire.com/2018/04/25/winter-2017-2018-recap-historic-cold-snap-reinforces-findings-in-operational-fuel-
security-analysis/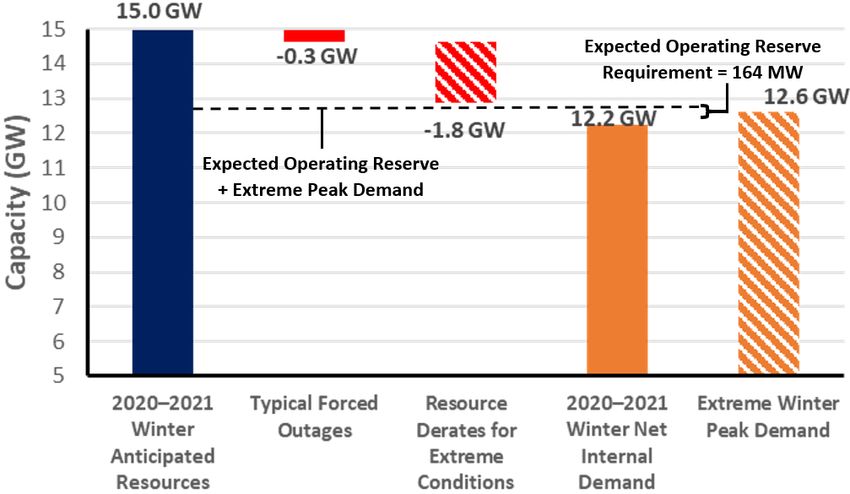
Winter Reliability Assessment 6
Under studied conditions, grid operators would need to employ operating mitigations or Post 2020 hurricane season restoration efforts may continue into the winter season: The active
energy emergency alerts (EEAs) to obtain resources necessary to meet extreme peak 2020 hurricane season could have lasting impacts into the winter season. Restoration in
demands. Potential extreme generation resource outages and peak loads that can Arkansas, Texas, and North Louisiana is complete. Restoration activities continue to focus on the
accompany extreme winter weather may result in reliability risks in MISO, Maritimes, Southwest Louisiana area, primarily in and around the city of Lake Charles.
ERCOT, and WECC-NWPP & RMRG. Furthermore, limitations with the energy
infrastructure that supports generator fuel supplies in WECC-CA/MX and NPCC New
England could pose risk to BPS reliability during extreme events (see Figure 1). More
extreme weather than the studied scenarios, though rare, can cause EEAs in other areas.
Widespread and prolonged periods of cold temperatures can reduce the availability of
capacity/energy transfers that can lead to operating risk in areas experiencing internal
resource shortfalls. NPCC-Maritimes and NPCC-Québec anticipate that electricity
imports would be needed to meet extreme peak demands, as does a portion of SERC-
East. Furthermore, any of the assessment areas that are identified in Figure 1 may need
resource assistance in the form of transfers during EEAs. Wide-area winter weather
extending over multiple assessment areas carries risk that additional emergency imports
may not be available. Reliability risk may also arise when areas reach transmission
transfer capacity limitations. Transfer agreements generally include provisions that allow
the exporting entity to prioritize serving native load; therefore, even firm transfers may
be recalled in some extreme conditions. In January 2018, extreme winter weather in the
South Central United States resulted in season-high loads and increased generator
outages over a nine-state area. MISO required transfer assistance using neighboring
systems to assist with generation shortages in portions of its system. Detailed analysis
on transfer affecting operations is shown in the Transfers in a Wide-Area Cold Snap
section.
Figure 1: Areas with Reliability Risks during Extreme Weather Events and/or
Impacts from the ongoing pandemic: The ongoing pandemic is causing increased uncertainty in
Fuel Supply Disruptions
electricity demand projections and presents cybersecurity and operating risks. No specific
threats or degradation to the reliable operation of the BPS are identified for this assessment
period. Protecting system and power-plant operators as well as field crews and mitigating
heightened cyber risks will continue to be the areas of focus. BPS owners are managing the
backlog in generator and transmission maintenance impacted by pandemic in addition to normal
winter preparations. Generator maintenance scheduling and outage coordination in the
beginning of the winter season must be closely monitored. If maintenance is not able to be
performed, forced outages may escalate. Pandemic impacts can affect the accuracy of demand
projections in the near term and have the potential to either exacerbate or alleviate planning
reserve shortfalls in areas that are below or near Reference Margin levels.
Winter Reliability Assessment                                         7

Resource Adequacy
The Anticipated Reserve Margin, which is based on available resource capacity, is a metric used to evaluate resource adequacy by comparing the projected capability of anticipated resources to serve
forecast peak demand.7 Large year-to-year changes in anticipated resources or forecast peak demand (net internal demand) can greatly impact Planning Reserve Margin calculations. All assessment areas
have sufficient Anticipated Reserve Margins to meet or exceed their Reference Margin Level for the 2020–2021 winter as shown in Figure 2. Variable energy resources, such as wind and solar, often
contribute significantly less of their installed capability at the period of peak demand in winter. Winter peaks occur in early morning hours or other times of darkness in many areas, resulting in little or no
electrical resource output. Consequently, the capacity contribution of variable energy resources to an area’s anticipated resources may be a fraction of installed capability in winter.
                                                                            78% | 78%                                                                 50% | 51%
                                     49% | 56%                        75% | 76%                                                                 59% | 59%                                        75% | 75%

                                         Figure 2: Winter 2020–2021 Anticipated/Prospective Reserve Margins Compared to Reference Margin Level
7 Generally, anticipated resources include generators and firm capacity transfers that are expected to be available to serve load during electrical peak loads for the season. Prospective resources are those that could be available but do not meet
criteria to be counted as anticipated resources. Refer to the Data Concepts and Assumptions section for additional information on Anticipated/Prospective Reserve Margins, anticipated/prospective resources, and Reference Margin Levels.
Winter Reliability Assessment 8
Changes from Year-to-Year
Figure 3 provides the relative change in the forecast Anticipated Reserve Margins from the 2019–2020 winter to the 2020–2021 winter. A significant decline can indicate potential operational issues that
emerge between reporting years. The areas of MRO-Manitoba and SERC-Call had noticeable reductions in Anticipated Reserve Margins between the 2019–2020 winter and the 2020–2021 winter. The
lower Anticipated Reserve Margins for MRO-Manitoba and SERC-C result from increased exports on peak for this upcoming winter. No comparison is provided for the assessment area of WECC-NWPP &
RMRG as the two areas merged since the 2019-2020 Winter Reliability Assessment. Additional details are provided in the Data Concepts and Assumptions section.
71% | 75% 83% | 78% 59% | 59% 88% | 75%
Figure 3: Winter 2019–2020 and Winter 2020–2021 Anticipated Reserve Margins Year-to-Year Change8
8
WECC-NWPP and WECC-RMRG merged in 2020, so an Anticipated Reserve Margin or a Reference Margin Level was not produced for the 2019 assessment year for comparison.Winter Reliability Assessment 9
Risk Highlights for Winter 2020–2021
About the Seasonal Risk Assessment
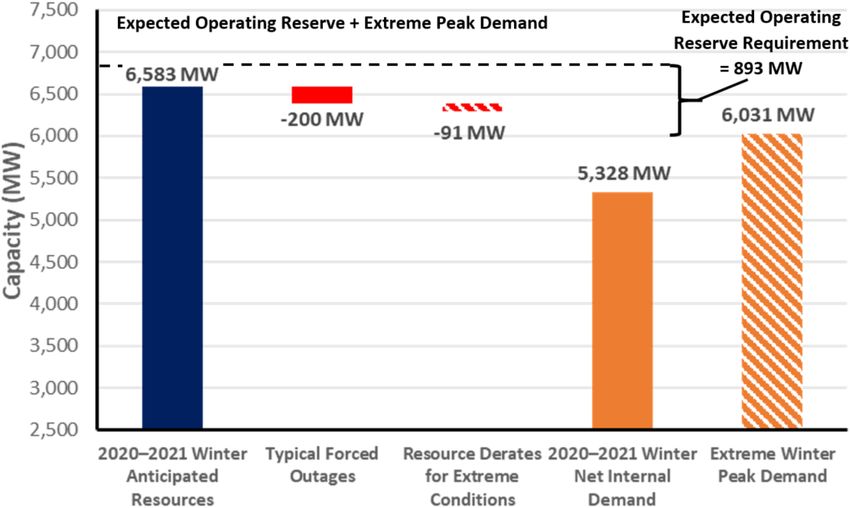
The operational risk analysis shown in Figure 4 provides a deterministic scenario for understanding how various factors that affect resources and demand can combine to impact overall resource
adequacy. Adjustments are applied cumulatively to anticipated capacity, such as reductions for typical generation outages (maintenance and forced not already accounted for in anticipated resources)
and additions that represent the quantified capacity from operational tools, if any, that are available during scarcity conditions but have not been accounted for in the winter reserve margins.
Resources throughout the scenario are compared against expected operating reserve requirements that are based on peak load and normal weather. The effects from low-probability, extreme events
are also factored in through additional resource derates or extreme resource scenarios and extreme winter peak load conditions. Because the seasonal risk scenario shows the cumulative impact
resulting from the occurrence of multiple low-probability events, the overall likelihood of the scenario is very low. An analysis similar to the ISO-NE seasonal risk scenario in Figure 4 can be found for
each assessment area in the
Regional Assessment Dashboards section.
Seasonal Risk Assessments of Area Resource and Demand Scenarios
Areas can face energy shortfalls despite having Planning Reserve Margins that exceed Reference Margin Levels. Operating resources may be insufficient during periods of peak demand for reasons that
could include generator scheduled maintenance, forced outages due to normal and more extreme weather conditions and loads, and low-likelihood conditions that affect generation resource performance
or unit availability, including constrained fuel supplies. The Regional Assessment Dashboards section in this report includes a seasonal risk scenario for each area that illustrates variables in resources and
load and the potential effects that operating actions can have to mitigate shortfalls in operating reserves. Figure 4 shows an example seasonal risk assessment for the ISO-New England area that was
developed using data from NPCC and ISO-New England. A description of resource and demand variables for Figure 4 is found in Table 1.
Figure 4: ISO-NE Area Seasonal Risk Assessment at Extreme Peak DemandWinter Reliability Assessment 10
The seasonal risk assessment for ISO-New England shows that resources are available to meet extreme conditions; however, energy security challenges remain a concern. Based on the assumptions in
Table 1, resources are available to meet expected operating reserve requirements for the normal and extreme demand and outage scenarios analyzed. By examining various maintenance and forced
outage scenarios and seasonal derated resource conditions, the seasonal risk assessment analysis provides insights into operational challenges that can occur as a result of prolonged and extreme cold
temperatures. However, the seasonal risk assessment may not account for all of the unique energy assurance risks associated with the area. Long-duration cold spells and disruptions to primary and back-
up fuel supply chains are not explicitly considered in the New England seasonal risk scenario and can cause unique risks to the area’s operations.
Table 1: Resource and Demand Variables in the ISO-NE Seasonal Risk Assessment
Resource Scenarios
Typical Maintenance Planned Typical maintenance outages refer to all planned outages for the period, including any known long-term outages, generation outages, reductions due to transmission
Outages work, and external outages that would affect ISO-NE imports. The value is a snapshot of these considerations that is produced monthly and forecast out two years.
Typical forced outages refer to an estimate of generation resources that will experience forced outage during peak load conditions. ISO-NE calculated this capacity
Typical Forced Outages
value from historical forced outages in previous winters.
Resource Derates for Extreme A low-likelihood, high forced outage scenario is used to analyze the effect of extreme weather-driven generation outages. The assumed forced outage for this
Conditions (Low-likelihood) scenario is based on the sum of the unplanned outages plus the natural-gas-fired generation at risk of not having fuel during 90/10 peak load conditions.
ISO-NE depends on a large fleet of natural-gas-fired generation that may be at risk due to unavailability of natural gas during colder temperatures. ISO-NE calculates
Extreme Natural Gas Fuel Risk the amount of generator natural gas at risk due to lack of natural gas during cold weather based on dry-bulb peak hour temperature. This assumes no generator
Scenario (Low-likelihood) natural gas at risk for temperatures at or above 30°F and a reduction curve for temperatures below 30°F. The electric generating capacity depicted as at-risk in Figure
4 is the maximum.
An estimated combination of load relief achieved through operating procedure actions (e.g., requesting voluntary load curtailment of market participants, the
purchase of available emergency capacity and energy from market participants or neighboring RC or Balancing Authority (BA) areas, request for generators and
Operational Mitigations
demand response resources not subject to market obligations to voluntarily provide energy for reliability, requesting voluntary load curtailment by large industrial
and commercial customers, and radio and television appeals for voluntary load curtailment).
Demand Scenarios
This is the forecast 50/50 net winter peak load that integrates state historical demand, economic and weather data, and the impacts of utility-sponsored conservation
2020–2021 Winter Net Internal
and peak-load management programs. Energy efficiency is included in this demand forecast and assumes that behind-the-meter solar generation will be off-line or
Demand
unable to generate for the peak winter hours.
Extreme Winter Peak Load A seasonal load adjustment is added to the 2020–2021 net internal demand based on a 90/10 statistical extreme load forecast.
Seasonal Risk Assessments for Other Areas
Seasonal risk scenarios for each assessment area are presented in the Regional Assessment Dashboards section. The resource adequacy data table and seasonal risk scenario chart in each dashboard
provide potential winter peak demand and resource condition information. The table on the right side of the dashboard page presents a standard seasonal assessment and comparison to the previous
year’s assessment. The seasonal risk scenario chart presents deterministic scenarios for further analysis of different demand and resource levels with adjustments for normal and extreme conditions. The
assessment areas determined the adjustments to capacity and peak demand based on methods or assumptions that are summarized below the seasonal risk scenario chart. See the Data Concepts and
Assumptions for more information about this chart. Potential extreme generation resource outages and peak loads that can accompany extreme winter weather may result in reliability risks in MISO,
ERCOT, and WECC-NWPP & RMRG areas as well as the Canadian Maritime provinces. Some parts of the system within the WECC area could also experience resource shortfalls in low-likelihood resourceWinter Reliability Assessment 11
derate scenarios. Under studied conditions for these areas, grid operators would need to employ operating mitigations or EEAs to obtain resources necessary to meet extreme peak demands. Table 2
describes the various EEA levels and the circumstances for each.
Table 2: Energy Emergency Alert Levels
EEA Level Description Circumstances
The BA is experiencing conditions where all available generation resources are committed to meet firm load, firm transactions,
EEA 1 All available generation resources in use and reserve commitments, and is concerned about sustaining its required contingency reserves.
Non-firm wholesale energy sales (other than those that are recallable to meet reserve requirements) have been curtailed.
The BA is no longer able to provide its expected energy requirements and is an energy deficient BA.
EEA 2 Load management procedures in effect An energy deficient BA has implemented its operating plan(s) to mitigate emergencies.
An energy deficient BA is still able to maintain minimum contingency reserve requirements.
EEA 3 Firm Load interruption is imminent or in progress The energy deficient BA is unable to meet minimum contingency reserve requirements.
Transfers in a Wide-Area Cold Snap
When extreme weather extends over a wide area, resources can be strained in multiple assessment areas simultaneously, increasing the risk of shortfalls. Some assessment areas expect imports from
other areas to be available to meet periods of peak demand and have contracted for firm transfer commitments. A summary of area firm on-peak imports and exports is shown in Table 3. Firm resource
transactions, such as these, are accounted for in all assessment area anticipated resources and reserve margins. Areas with net imports show a positive transfer amount, and areas with net exports show
a negative transfer amount. Only areas that contained transfers for the previous or upcoming winter seasons are shown in Table 3. NOTE: The Table 3 data is sourced from the data adequacy tables in the
Regional Assessment Dashboards.
Table 3: 2019–2020 and 2020–2021 Transfers
2019–2020 2020–2021
Assessment Area Winter Transfers Winter Transfers Year-to-Year
(MW) (MW) Change
MISO -383 1,405 N/A
MRO-Manitoba -108 -270 149.9%
MRO-SaskPower 25 125 400%
NPCC-Maritimes -110 42 N/A
NPCC-New England 1,017 1,025 1%
NPCC-New York 678 496 -27%
NPCC-Ontario -500 -500 0%
NPCC-Quebec 202 -541 N/A
PJM 830 -687 N/A
SERC-C 355 -938 N/A
SERC-E 530 266 -50%Winter Reliability Assessment 12
Table 3: 2019–2020 and 2020–2021 Transfers
2019–2020 2020–2021
Assessment Area Winter Transfers Winter Transfers Year-to-Year
(MW) (MW) Change
SERC-FP 1,257 1,071 -15%
SERC-SE -1,905 -895 -53%
SPP -378 -36 -90%
TRE-ERCOT 50 210 320%
WECC-NWPP-US and RMRG 700 0 -100%
In the unlikely event that multiple assessment areas are experiencing energy emergencies as could occur in a wide-area cold snap, some transfers may be at risk of not being fulfilled. Transfer agreements
may include provisions that allow the exporting entity to prioritize serving native load. Loss of transfers could exacerbate resource shortages that occur from outages and derates. Below are operational
risk scenarios showing how a loss of transfers during periods of extreme peak demand and high outage rates could affect the areas of ISO-NE and SERC-E. These areas are selected because capacity
transfers can be an important resource contribution toward meeting operating reserves shown in Figure 5 and Figure 6.
Figure 5: ISO-NE Transfer Curtailment Extreme Scenario Figure 6: SERC-E Transfer Curtailment Extreme ScenarioWinter Reliability Assessment 13 Regional Assessment Dashboards The following assessment area dashboards and summaries were developed based on data and narrative information collected by NERC from the REs on an assessment area basis. Seasonal risk scenarios for each assessment area are presented in following pages of this section. The resource adequacy data table and seasonal risk scenario chart in each dashboard provide potential winter peak demand and resource condition information. The table on the right side of the dashboard page presents a standard seasonal assessment and comparison to the previous year’s assessment. The seasonal risk scenario chart presents deterministic scenarios for further analysis of different demand and resource levels with adjustments for normal and extreme conditions. The assessment areas determined the adjustments to capacity and peak demand based on methods or assumptions that are summarized below the seasonal risk scenario chart; see the Data Concepts and Assumptions section for more information about this chart. Fuel mix charts for each assessment area show the on-peak capacity of each resource type. For variable energy resources, such as wind and solar, this may be significantly less than the installed capability.
Winter Reliability Assessment 14
MISO Resource Adequacy Data
Seasonal Risk Scenario Demand, Resource, and 2019–2020 2020–2021 2019–2020 vs.
Reserve Margins WRA WRA 2020–2021 WRA
Megawatts Megawatts
Demand Projections Net Change (%)
(MW) (MW)
Total Internal Demand (50/50) 103,841 103,167 -0.6%
Demand Response: Available 3,822 4,536 18.7%
Net Internal Demand 100,019 98,631 -1.4%
Megawatts Megawatts
Resource Projections Net Change (%)
(MW) (MW)
MISO Existing-Certain Capacity 139,555 144,736 3.7%
The Midcontinent Independent System Tier 1 Planned Capacity 778 574 -26.2%
Operator, Inc. (MISO) is a not-for-profit, Net Firm Capacity Transfers -383 1,405 N/A
member-based organization administering Anticipated Resources 139,951 146,715 4.8%
wholesale electricity markets that provide Existing-Other Capacity 535 6,390 1,094.3%
customers with valued service; reliable, cost- Prospective Resources 140,486 153,557 9.3%
effective systems and operations; Reserve Margins Percent (%) Percent (%) Annual Difference
dependable and transparent prices; open Anticipated Reserve Margin 39.9% 48.8% 8.9
access to markets; and planning for long- Prospective Reserve Margin 40.5% 55.7% 15.2
term efficiency. Reference Margin Level 16.8% 18.0% 1.2
MISO manages energy, reliability, and Risk Scenario Summary Highlights
operating reserve markets that consist of 36 Operating mitigations or EEAs may be needed under extreme peak demand and
MISO does not anticipate resource availability issues for the upcoming
local Balancing Authorities and 394 market outage scenarios studied.
2020–2021 winter season. Based on prior winter readiness and fuel
participants, serving approximately 42 Scenario Assumptions deliverability surveys, appropriate measures have been taken, making
million customers. Although parts of MISO readying units for potential severe winter weather, and fuel deliverability
fall in 3 NERC Regional Entities, MRO is Extreme Peak Load: 90/10 forecast
is robust.
responsible for coordinating data and Outages: Average from highest peak hour over the past five winters
information submitted for NERC’s reliability Generator maintenance outages that were deferred from spring of this
assessments. Extreme Generation Scenario: Additional outages corresponding to maximum year due to the pandemic look to be on track for completion in fall. Extreme
generation outages observed at highest peak hour in past five years warm fall weather may impact scheduled maintenance outages, but there
is no indication that these will be pushed into the peak of the winter
Operational Mitigations: Derived from required deployable contingency season.
reserves.
Coal
Petroleum
Natural Gas
Wind
Geothermal
Conventional Hydro
Pumped Storage
Nuclear
On-Peak Generation Fuel MixWinter Reliability Assessment 15
Seasonal Risk Scenario MRO-Manitoba Hydro Resource Adequacy Data
Demand, Resource, and 2019–2020 2020–2021 2019–2020 vs.
Reserve Margins WRA WRA 2020–2021 WRA
Demand Projections MW MW Net Change (%)
Total Internal Demand (50/50) 4,505 4,582 1.7%
Demand Response: Available 0 0 0.0%
Net Internal Demand 4,505 4,582 1.7%
Resource Projections MW MW Net Change (%)
MRO-Manitoba Hydro
Existing-Certain Capacity 5,469 5,422 -0.9%
Tier 1 Planned Capacity 0 180 0.0%
Manitoba Hydro is a provincial crown
Net Firm Capacity Transfers -108 -270 149.9%
corporation that provides electricity to
about 580,000 customers throughout Anticipated Resources 5,361 5,226 -2.5%
Manitoba and natural gas service to about Existing-Other Capacity 53 38 -28.3%
282,000 customers in various communities Prospective Resources 5,414 5,146 -4.9%
throughout Southern Manitoba. The Reserve Margins Percent (%) Percent (%) Annual Difference
Province of Manitoba has a population of Anticipated Reserve Margin 19.0% 14.1% -4.9
about 1.3 million in an area of 250,946
Prospective Reserve Margin 20.2% 12.3% -7.9
square miles.
Reference Margin Level 12.0% 12.0% 0.0
Manitoba Hydro is winter-peaking. No Risk Scenario Summary Highlights
change in the footprint area is expected Resources meet operating reserve requirements under studied scenarios.
during the assessment period. Manitoba The winter Anticipated Reserve Margin does not fall below the Reference
Hydro is its own Planning Coordinator and Scenario Assumptions Margin Level of 12%.
Balancing Authority. Manitoba Hydro is a Extreme Peak Demand: Exceeded only 1 hour in 10 years, considering historical The effect of the pandemic on the winter peak demand cannot be reliably
coordinating member of MISO. MISO is the hourly weather and load analysis and internal demand resources assessed. Using the load forecast that was prepared prior the pandemic is
Reliability Coordinator for Manitoba Hydro. considered a reasonable, conservative assumption.
Maintenance Outages: Removal of the largest hydro unit
Two of the seven Keeyask hydro station generating units (90 MW per unit)
Forced Outages: Based on historical operating experience are expected to be operational by December. Work continues to proceed
as scheduled.
The status of the 126 MW winter capacity Selkirk natural gas generating
station will be changed from an unconfirmed retirement to a confirmed
retirement once the Keeyask units come on-line.
Natural Gas
The newly operational Manitoba–Minnesota 500 kV transmission line
Wind
provides additional reliability for the Manitoba Hydro system through
Conventional Hydro increased firm import capacity.
Run of River Hydro
On-Peak Generation Fuel MixWinter Reliability Assessment 16
Seasonal Risk Scenario MRO-SaskPower Resource Adequacy Data
Demand, Resource, and 2019–2020 2020–2021 2019–2020 vs.
Reserve Margins WRA WRA 2020–2021 WRA
Demand Projections MW MW Net Change (%)
Total Internal Demand (50/50) 3,803 3,618 -4.9%
Demand Response: Available 85 60 -29.4%
Net Internal Demand 3,718 3,558 -4.3%
Resource Projections MW MW Net Change (%)
Existing-Certain Capacity 4,222 4,348 3.0%
MRO-SaskPower Tier 1 Planned Capacity 353 0 0.0%
Saskatchewan is a province of Canada and Net Firm Capacity Transfers 25 125 400.0%
comprises a geographic area of 651,900 Anticipated Resources 4,600 4,473 -2.8%
square kilometers (251,700 square miles) Existing-Other Capacity 0 0 0.0%
with approximately 1.1 million people. Peak Prospective Resources 4,600 4,473 -2.8%
demand is experienced in the winter. The Reserve Margins Percent (%) Percent (%) Annual Difference
Saskatchewan Power Corporation Anticipated Reserve Margin 23.7% 25.7% 2.0
(SaskPower) is the Planning Coordinator Prospective Reserve Margin 23.7% 25.7% 2.0
and Reliability Coordinator for the province
Reference Margin Level 11.0% 11.0% 0.0
of Saskatchewan and is the principal
supplier of electricity in the province. Risk Scenario Summary Highlights
SaskPower is a provincial crown corporation Resources meet operating reserve requirements under studied scenarios.
Saskatchewan experiences peak load in winter as a result of extreme cold
and, under provincial legislation, is
Scenario Assumptions weather.
responsible for the reliability oversight of
the Saskatchewan Bulk Electric System and Extreme Peak Load: Peak demand with lighting and all large consumer loads SaskPower conducts an annual winter joint operating study with Manitoba
its interconnections. Hydro with inputs from Basin Electric (North Dakota) and prepares
Maintenance Outages: Estimated based on the difference between average
maintenance outages for past three winters and average of estimation for operating guidelines for any identified issues.
outages for upcoming 2020–2021 winter The risk of an operating reserve shortage or EEA during peak load times
Forced Outages: Estimated using SaskPower forced outage model could increase if a large generation forced outage occurs during peak load
times combined with planned transmission line maintenance work
Extreme Derates: None applied; all derates are included in winter anticipated scheduled during peak winter months.
capacity
In cases of extreme winter conditions combined with large generation
Operational Mitigations: Estimated average based on import capability forced outages, SaskPower would use available demand response
Coal programs, short-term power transfers from neighboring utilities, and
Natural Gas short-term load interruptions.
Biomass
Wind
Conventional Hydro
Other
On-Peak Generation Fuel MixWinter Reliability Assessment 17
NPCC-Maritimes Resource Adequacy Data
Seasonal Risk Scenario
Demand, Resource, and 2019–2020 2020–2021 2019–2020 vs.
Reserve Margins WRA WRA 2020–2021 WRA
Demand Projections MW MW Net Change (%)
Total Internal Demand (50/50) 5,528 5,621 1.7%
Demand Response: Available 243 293 20.6%
Net Internal Demand 5,285 5,328 0.8%
Resource Projections MW MW Net Change (%)
Existing-Certain Capacity 6,663 6,541 -1.8%
NPCC-Maritimes Tier 1 Planned Capacity 0 0 0.0%
The Maritimes assessment area is a winter- Net Firm Capacity Transfers -110 42 N/A
peaking NPCC area that contains two Anticipated Resources 6,553 6,583 0.5%
Balancing Authorities. It is comprised of the Existing-Other Capacity 0 0 0.0%
Canadian provinces of New Brunswick, Nova Prospective Resources 6,553 6,583 0.5%
Scotia, and Prince Edward Island, and the Reserve Margins Percent (%) Percent (%) Annual Difference
northern portion of Maine, which is radially Anticipated Reserve Margin 20.5% 23.6% 3.1
connected to the New Brunswick power Prospective Reserve Margin 20.5% 23.6% 3.1
system. The area covers 58,000 square miles Reference Margin Level 20.0% 20.0% 0.0
with a total population of 1.9 million.
Risk Scenario Summary Highlights
Operating mitigations or EEAs may be needed in an extreme peak demand scenario.
The Maritimes area has not identified any operational issues that are
Scenario Assumptions expected to impact system reliability. If an event were to occur, there are
emergency operations and planning procedures in place. All of the area’s
Extreme Peak Load: 90/10 forecast
declared firm capacity is expected to be operational for winter.
Outages: Based on historical operating experience
The Maritimes area is a winter-peaking system.
Extreme Derates: Based on ambient temperature thermal unit reduced
capacity and extreme case involving total loss of wind capacity As part of the planning process, dual-fueled units will have sufficient
supplies of heavy fuel oil on-site to enable sustained operation in the event
of natural gas supply interruptions.
The effects of the pandemic on load patterns, energy usage, and peak
demand will continue to be evaluated as the pandemic evolves.
Coal
Petroleum
Natural Gas
Biomass
Wind
Conventional Hydro
Run of River Hydro
Nuclear
Other
On-Peak Generation Fuel MixWinter Reliability Assessment 18
Seasonal Risk Scenario NPCC-New England Resource Adequacy Data
Demand, Resource, and 2019–2020 2020–2021 2019–2020 vs.
Reserve Margins WRA WRA 2020–2021 WRA
Demand Projections MW MW Net Change (%)
Total Internal Demand (50/50) 20,476 20,166 -1.5%
Demand Response: Available 497 579 16.7%
Net Internal Demand 19,979 19,587 -2.0%
Resource Projections MW MW Net Change (%)
Existing-Certain Capacity 33,120 33,166 0.1%
NPCC-New England Tier 1 Planned Capacity 12 0 -100.0%
ISO New England (ISO-NE) Inc. is a regional Net Firm Capacity Transfers 1,017 1,025 0.7%
transmission organization that serves the six Anticipated Resources 34,149 34,191 0.1%
New England states of Connecticut, Maine, Existing-Other Capacity 189 215 13.8%
Massachusetts, New Hampshire, Rhode Prospective Resources 34,338 34,422 0.2%
Island, and Vermont. It is responsible for the Reserve Margins Percent (%) Percent (%) Annual Difference
reliable day-to-day operation of New Anticipated Reserve Margin 70.9% 74.6% 3.7
England’s bulk power generation and Prospective Reserve Margin 71.9% 75.7% 3.8
transmission system, administers the area’s Reference Margin Level 18.4% 13.6% -4.8
wholesale electricity markets, and manages
the comprehensive planning of the regional Risk Scenario Summary Highlights
bulk power system (BPS). The New England Resources meet operating reserve requirements under studied scenarios. While ISO New England (ISO-NE) expects to meet its regional resource
BPS serves approximately 14.5 million Scenario Assumptions adequacy requirements during the 2020–2021 winter, a standing concern
customers over 68,000 square miles. is whether there will be sufficient electrical energy available to satisfy
Extreme Peak Load: 90/10 Forecast electricity demand while satisfying operating reserves during an extended
Outages: Based on weekly averages cold spell given the existing resource mix and seasonally-constrained, fuel
delivery infrastructure.
Extreme Derates: A low-likelihood, high forced outage scenario used to
analyze the effect of extreme weather-driven generation outages ISO-NE continues to stay in contact with system operators in other parts of
North America and the world to share pandemic operating experience and
Extreme Natural Gas Fuel Risk Scenario: ISO-NE calculates the amount of hear how it might apply in New England.
generation at risk due to lack of natural gas during cold weather. No natural gas
ISO-NE is producing a weekly analysis of the impact the response to the
generation at risk above 30°F and a reduction curve for temperatures below
pandemic is having on system demand; it is posted every Tuesday on its
Coal 30°F
external web site. ISO-NE first observed an impact on system demand
Petroleum Operating Mitigations: Based on ISO-NE operating procedures during the third week of March 2020 when a regional response to the
Natural Gas pandemic began. Overall, loads are trending lower than normally would be
Biomass expected.
Wind ISO-NE expects to have sufficient resources to meet the 2020–2021
Conventional Hydro extreme winter peak demand forecast of 20,806 MW for the weeks
Pumped Storage
beginning January 3, January 10, and January 17, 2021.
Nuclear
On-Peak Generation Fuel MixWinter Reliability Assessment 19
Seasonal Risk Scenario NPCC-New York Resource Adequacy Data
Demand, Resource, and 2019–2020 2020–2021 2019–2020 vs.
Reserve Margins WRA WRA 2020–2021 WRA
Demand Projections MW MW Net Change (%)
Total Internal Demand (50/50) 24,123 24,130 0.0%
Demand Response: Available 853 839 -1.7%
Net Internal Demand 23,270 23,292 0.1%
Resource Projections MW MW Net Change (%)
Existing-Certain Capacity 41,815 40,943 -2.1%
NPCC-New York Tier 1 Planned Capacity 0 0 0.0%
The New York Independent System Operator
Net Firm Capacity Transfers 678 496 -26.9%
(NYISO) is responsible for operating New York’s
BPS, administering wholesale electricity Anticipated Resources 42,493 41,439 -2.5%
markets, and conducting system planning. The Existing-Other Capacity 0 0 0.0%
New York Independent System Operator Prospective Resources 42,493 41,439 -2.5%
(NYISO) is the only Balancing Authority within Reserve Margins Percent (%) Percent (%) Annual Difference
the state of New York. The BPS encompasses
Anticipated Reserve Margin 82.6% 77.9% -4.7
approximately 11,000 miles of transmission
lines, 760 power generation units, and serves Prospective Reserve Margin 82.6% 77.9% -4.7
19.5 million customers. New York experienced Reference Margin Level 17.0% 18.2% 1.2
its all-time peak demand of 33,956 MW in
Summer 2013. The NERC Reference Margin Risk Scenario Summary Highlights
Resources meet operating reserve requirements under studied scenarios.
Level is 15%. Wind, grid-connected solar, and New York is a summer-peaking area and no emerging reliability issues are
run-of-river totals were derated for this Scenario Assumptions anticipated during the 2020–2021 winter assessment period. Surplus
calculation. However, New York requires load capacity margins above the NYISO’s operating reserve requirements are
serving entities to procure capacity for their Extreme Peak Demand: 90/10 load forecast with demand response adjustments
projected.
loads equal to their peak demand plus an
Maintenance Outages: based on scheduled maintenance
Installed Reserve Margin (IRM). The IRM
requirement represents a percentage of Forced Outages: based on 5-year averages from the Generator Availability Data
capacity above peak load forecast and is System
approved annually by the New York State
Reliability Council (NYSRC). NYSRC approved the Natural Gas Fuel Risk Scenario: Extreme scenario assumes all nonfirm supply is
2020–2021 IRM at 18.2%.” unavailable in a period of extended cold weather
Operational Mitigation: 3.3 GW of effects from emergency operating procedure
Petroleum
Natural Gas
Biomass
Wind
Conventional Hydro
Run of River Hydro
Pumped Storage
Nuclear
On-Peak Generation Fuel MixWinter Reliability Assessment 20
Seasonal Risk Scenario NPCC-Ontario Resource Adequacy Data
Demand, Resource, and 2019–2020 2020–2021 2019–2020 vs.
Reserve Margins WRA WRA 2020–2021 WRA
Demand Projections MW MW Net Change (%)
Total Internal Demand (50/50) 21,115 20,837 -1.3%
Demand Response: Available 924 688 -25.6%
Net Internal Demand 20,191 20,150 -0.2%
Resource Projections MW MW Net Change (%)
Existing-Certain Capacity 24,298 26,695 9.9%
NPCC-Ontario Tier 1 Planned Capacity 0 145 0.0%
The Independent Electricity System Operator
Net Firm Capacity Transfers -500 -500 0.0%
(IESO) is the Balancing Authority for the
Anticipated Resources 23,798 26,340 10.7%
province of Ontario. The province of Ontario
covers more than 1 million square kilometers Existing-Other Capacity 0 0 0.0%
(415,000 square miles) and has a population Prospective Resources 23,798 26,340 10.7%
of more than 14 million. Ontario is Reserve Margins Percent (%) Percent (%) Annual Difference
interconnected electrically with Québec, Anticipated Reserve Margin 17.9% 30.7% 12.8
MRO-Manitoba, states in MISO (Minnesota
Prospective Reserve Margin 17.9% 30.7% 12.8
and Michigan), and NPCC-New York.
Reference Margin Level 14.4% 14.3% -0.1
Risk Scenario Summary Highlights
Resources meet operating reserve requirements under studied scenarios.
IESO anticipates that it will maintain reliability on its system through Winter
Scenario Assumptions 2020–2021.
Extreme Peak Load: Determined from the most severe historical weather Nuclear refurbishment schedules and other nuclear and hydroelectric
planned outages will reduce generation capacity for the coming winter
Outages: Accounted for in anticipated resources. No additional outages due to
season; however, IESO expects to have sufficient generation supply to
extreme conditions anticipated.
meet demand.
Extreme Derates: None applied based on operating experience
Imports and exports between New York and Ontario continue to be
Operational Mitigation: 2,000 MW imports assessed as available from impacted due to an ongoing interconnection equipment outage at St.
neighbors Lawrence TS. This has required enhanced coordination with affected
Petroleum
parties and more focused management of St. Lawrence area resources in
Natural Gas real-time. Careful coordination of transmission and generation outages will
Biomass continue to be required in the area.
Wind
Conventional Hydro
Pumped Storage
Nuclear
On-Peak Generation Fuel MixWinter Reliability Assessment 21
Seasonal Risk Scenario NPCC- Québec Resource Adequacy Data
Demand, Resource, and 2019–2020 2020–2021 2019–2020 vs.
Reserve Margins WRA WRA 2020–2021 WRA
Demand Projections MW MW Net Change (%)
Total Internal Demand (50/50) 38,665 38,694 0.1%
Demand Response: Available 2,284 2,592 13.5%
Net Internal Demand 36,382 36,102 -0.8%
Resource Projections MW MW Net Change (%)
Existing-Certain Capacity 41,917 41,695 -0.5%
NPCC-Québec Tier 1 Planned Capacity 0 24 0.0%
The Québec assessment area (Province of Net Firm Capacity Transfers 202 -541 N/A
Québec) is a winter-peaking NPCC area that Anticipated Resources 42,119 41,178 -2.2%
covers 595,391 square miles with a
Existing-Other Capacity 1,100 0 0.0%
population of 8 million.
Prospective Resources 43,219 42,278 -2.2%
Québec is one of the 4 NERC Interconnections Reserve Margins Percent (%) Percent (%) Annual Difference
in North America; with ties to Ontario, New Anticipated Reserve Margin 15.8% 14.1% -1.7
York, New England, and the Maritimes; Prospective Reserve Margin 18.8% 17.1% -1.7
consisting of either HVDC ties, radial Reference Margin Level 12.8% 10.1% -2.7
generation, or load to and from neighboring
systems. Risk Scenario Summary Highlights
Resources meet operating reserve requirements under studied scenarios.
Québec predicts that it will maintain system resource adequacy this winter.
Scenario Assumptions
The Québec area is a winter-peaking system with predominately
Extreme Peak Load: based on 50/50 load forecast with two standard deviations hydroelectric generation resources. Adequate capacity margins above its
reference reserve requirements are projected for the 2020–2021 winter.
Forced Outages: Hydro resources operating in extreme conditions without
increased outage rates No changes have been made to the assessment area’s winter preparedness
Operational Mitigations: 1,100 MW of non-firm imports anticipated to be programs.
available in short-term capacity purchases
Petroleum
Biomass
Wind
Conventional Hydro
On-Peak Generation Fuel MixWinter Reliability Assessment 22
Seasonal Risk Scenario PJM Resource Adequacy Data
Demand, Resource, and 2019–2020 2020–2021 2019–2020 vs.
Reserve Margins WRA WRA 2020–2021 WRA
Demand Projections MW MW Net Change (%)
Total Internal Demand (50/50) 131,148 132,175 0.8%
Demand Response: Available 965 8,047 733.9%
Net Internal Demand 130,183 124,128 -4.7%
Resource Projections MW MW Net Change (%)
Existing-Certain Capacity 186,070 184,212 -1.0%
PJM Tier 1 Planned Capacity 0 0 0.0%
PJM Interconnection is a regional Net Firm Capacity Transfers 830 -687 N/A
transmission organization that coordinates Anticipated Resources 186,899 183,526 -1.8%
the movement of wholesale electricity in all Existing-Other Capacity 0 0 0.0%
or parts of Delaware, Illinois, Indiana,
Prospective Resources 186,899 183,526 -1.8%
Kentucky, Maryland, Michigan, New Jersey,
Reserve Margins Percent (%) Percent (%) Annual Difference
North Carolina, Ohio, Pennsylvania,
Tennessee, Virginia, West Virginia, and the Anticipated Reserve Margin 43.6% 47.9% 4.3
District of Columbia. Prospective Reserve Margin 43.6% 47.9% 4.3
Reference Margin Level 16.0% 16.0% 0.0
PJM serves 65 million people and covers
369,089 square miles. PJM is a Balancing Risk Scenario Summary Highlights
Authority, Planning Coordinator, Resources meet operating reserve requirements under studied scenarios.
PJM is expected to serve load and meet its installed reserve requirement
Transmission Planner, Resource Planner, Scenario Assumptions through the 2020–2021 winter peak period.
Interchange Authority, Transmission
Operator, Transmission Service Provider, and Extreme Peak Load: 90/10 Forecast PJM’s Capacity Performance program continues to incent excellent
Reliability Coordinator. performance of generation and demand-side resources.
Outages and Derates: Estimated from analysis of previous winter peak periods
Coal
Petroleum
Natural Gas
Biomass
Wind
Conventional Hydro
Pumped Storage
Nuclear
On-Peak Generation Fuel MixWinter Reliability Assessment 23
SERC Resource Adequacy Data
Demand, Resource, and Reserve 2019–2020 WRA 2020–2021 WRA 2019–2020 vs. 2020–2021
SERC-C SERC-E SERC-FP SERC-SE
Margins SERC Total SERC Total WRA
Demand Projections MW MW MW MW MW MW Net Change (%)
Total Internal Demand (50/50) 41,170 45,606 44,625 46,889 176,066 178,290 1.3%
Demand Response: Available 1,869 893 2,709 2,157 8,141 7,628 -6.3%
Net Internal Demand 39,301 44,713 41,916 44,732 167,925 170,662 1.6%
Resource Projections MW MW MW MW MW MW Net Change (%)
Existing-Certain Capacity 51,782 54,281 57,259 62,330 227,325 225,653 -0.7%
Tier 1 Planned Capacity 0 122 125 2 2,516 249 -90.1%
SERC Net Firm Capacity Transfers
Anticipated Resources
-938
50,843
266
54,670
1,071
58,455
-895
61,437
237
230,078
-496
225,405
N/A
-2.0%
On April 30, 2019, the Federal Energy
Existing-Other Capacity 2,174 104 508 2,049 4,361 4,834 10.8%
Regulatory Commission issued an order Prospective Resources 53,017 54,773 58,963 63,486 234,439 230,239 -1.8%
formally approving the transfer of all Planning Reserve Margins Percent Percent Percent Percent Percent Percent Annual Difference
registered entities in the Florida Reliability Anticipated Reserve Margin 29.4% 22.3% 39.5% 37.3% 37.0% 32.1% 4.9
Coordinating Council (FRCC) Regional Entity Prospective Reserve Margin 34.9% 22.5% 40.7% 41.9% 39.6% 34.9% 4.7
to SERC by July 1, 2019. The integration of Reference Margin Level 15.0% 15.0% 15.0% 15.0% 15.0% 15.0% 0.0
FRCC entities resulted in an additional SERC
area and SERC assessment area for inclusion Highlights
in NERC’s reliability assessments. SERC entities have not identified any emerging or potential reliability issues for the upcoming winter season.
SERC is a summer-peaking assessment area SERC entities do not anticipate any significant reliability issues because of fuel supply, inventory, or transportation.
that covers approximately 308,900 square
Many entities in SERC reported they have an extensive weatherization process; this includes developed procedures specific to freezing events.
miles and serves a population estimated at
39.4 million. SERC is divided into 4 A force majeure was declared on a pipeline in Kentucky affecting natural gas supplied into SERC-Central assessment area. However, firm delivery supply
assessment areas: SERC- E, SERC-N, SERC-SE, contracts are in place for the potentially impacted power-plants.
and SERC-FL Peninsula. The SERC Regional
SERC-East states some entities have identified several significant generator outages are possible for the early winter period. The entities will rely on import
Entity includes 36 Balancing Authorities, 21
capabilities to meet the expected winter peak load, should outages occur.
Planning Authorities, and 4 Reliability
Coordinators.Winter Reliability Assessment 24
SERC-Central SERC-East
Seasonal Risk Scenario Seasonal Risk Scenario
Risk Scenario Summary Risk Scenario Summary
Resources meet operating reserve requirements under studied scenarios. Resources meet operating reserve requirements under studied scenarios.
Scenario Assumptions Scenario Assumptions
Extreme Peak Load: Determined by SERC to equal or exceed 90/10 statistical level Extreme Peak Load: Determined by SERC to equal or exceed 90/10 statistical level
Outages: Based on historical data Outages: Based on historical data
Extreme Derates: Determined by SERC to equal or exceed 90/10 statistical level Extreme Derates: Determined by SERC to equal or exceed 90/10 statistical level
Coal
Coal Petroleum
Natural Gas Natural Gas
Biomass
Wind
Solar
Conventional Hydro
Conventional Hydro
Pumped Storage Pumped Storage
Nuclear Nuclear
On-Peak Generation Fuel Mix On-Peak Generation Fuel MixYou can also read