ELECTRIFIED AFRICA - ASSOCIATED INVESTMENTS AND COSTS - DIVA
←
→
Page content transcription
If your browser does not render page correctly, please read the page content below
Electrified Africa - Associated
 investments and costs

 Author:

 Ioannis Pappis

 pappis@kth.se

 MSc Sustainable Energy Engineering

 Supervisor:

 Mark Howells

 Director and Professor: Division of Energy Systems
 Analysis

 Royal Institute of Technology, Sweden (KTH-dESA)

 EGI_2016:089 MSC
 Master of Science Thesis
 KTH School of Industrial Engineering and Management
 Division of Energy Systems Analysis
 SE-100 44 Stockholm
Master of Science Thesis EGI 2016:089

 Electrified Africa – Associated investments and costs

 Ioannis Pappis
Approved Examiner Supervisor

11 October 2016 Mark Howells Mark Howells
 Commissioner Contact person

 pappis@kth.se

 2

Abstract
Africa is a resource rich continent in both fossil fuels and renewable energy sources. Nevertheless,
its significantly underdeveloped electricity infrastructure and un-deployed power generation
potential lead to more than 620 million people to lack electricity access and the rest to face
shortages and high prices. Africa’s rapidly increasing electricity demand, from 621 TWh in 2012 to
about 1870 TWh in 2040, as well as rapid population growth, make urgent the necessity for national
and regional investments which will lead on reliable and affordable energy widely available and
achieve social and economic development. This thesis examines the national associated costs and
investments which are needed to electrify the current un-electrified population of the continent by
2030 and provide them to have an electricity consumption of 696kWh/household (TIER 3) that
year and 2195kWh/household (TIER 5) in 2050, as well as the continent to cover its electricity
demands for the period 2010-2050. To conduct this study, The Electricity Model Base for Africa
(TEMBA) [1] developed in the Open Source energy Modelling SYstem (OSeMOSYS) [2] is used,
with the initial modeling platform to remain the same but several parameters to be updated to the
latest up-to date source and the objective of the TEMBA study to differentiate. The parameters
which have been updated in this study for each country include: electricity demands (2010-2050),
existing and planned power plant capacities, technology costs, fuel availability and prices, national
fuel reserves, local transmission and distribution losses, and renewable resources potential.
Moreover, emission factors have been added into the model to estimate greenhouse gas emissions.
Different trade scenarios have been implemented to investigate the power generation potential and
the financial requirements which are needed by the continent to cover its electricity demands. An
expanded electricity trading scheme in Africa, as is being indicated in the Enhanced scenario,
exploits its country’s energy resource potential and lead to a decrease of the investment and fuel
costs as well as of the carbon dioxide emissions. The open-source nature of the model allows the
data and the model under which this study is being conducted to be publicly available for future
research.

 3

Acknowledgments
“You can make many speeches, but the real thing is when you dig a hole, plant a tree, give it water,
and make it survive. That’s what makes the difference.” Wangari Maathai (1940-2011), the first
African woman to receive the Nobel Peace Prize. This is the epitome for me, and with the outcome
of this thesis, I hope I will make a difference on more levels than just the theoretical.

First, I would like to thank the supervisor of my thesis Prof. Mark Howells, director of Energy
Systems Analysis (dESA) at the Royal Institute of Technology in Sweden, for his motivation, wide
knowledge in the energy field and with extensive experience in the energy sector of Africa,
encouragement, and valuable advices all this time.

I would also like to thank Constantinos Taliotis, PhD candidate in dESA, for his assistance and
support. His contribution and motivation to overcome the challenges of this thesis is greatly
appreciated.

Likewise, I am grateful that I have worked with Oliver Broad, Vignesh Sridharan, Abhishek
Shivakumar, Eunice Ramos, Dimitrios Mentis, Alexandros Korkovelos, Shahid Hussain Siyal,
Nicolina Lindblad, Caroline Sundin, and the rest of the dESA team. Except from their high
professional experience, their enjoyable, friendly, and goal motivated working attitude, alongside
their mortal support, is greatly appreciated.

Finally, I would like to deeply thank my parents and my sister who are always by my side and
support me in my goals, as well as my friends.

 4
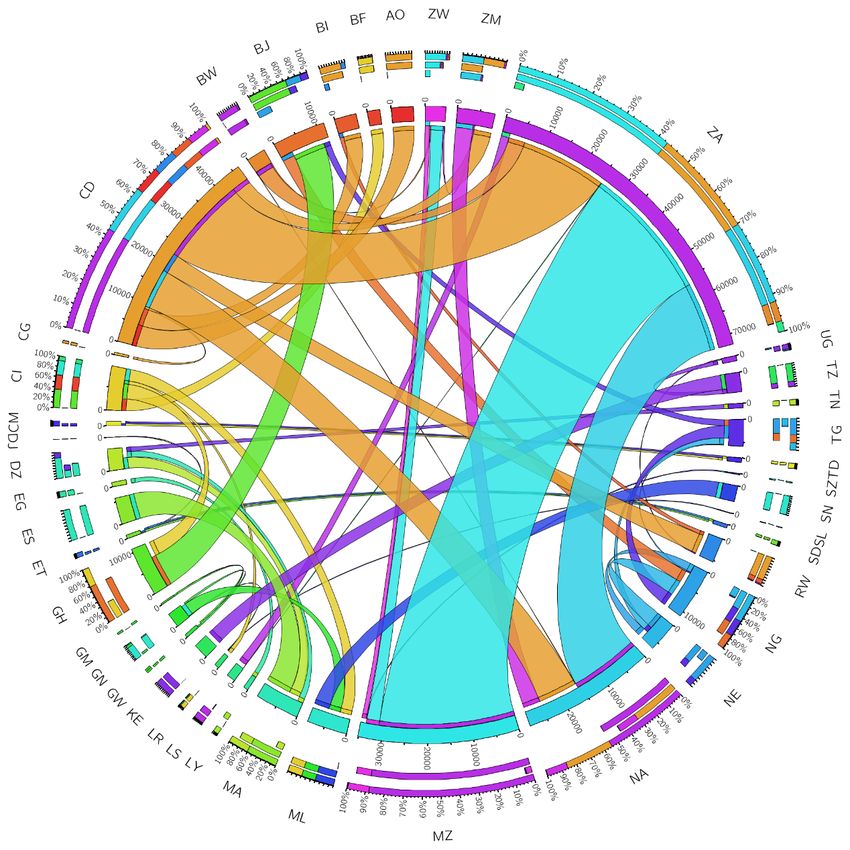
Table of Contents
Abstract ........................................................................................................................................................... 3
Acknowledgments ......................................................................................................................................... 4
List of figures ................................................................................................................................................. 6
List of tables ................................................................................................................................................... 7
1. Introduction ................................................................................................................................ 8
2. Overview of Methodology .................................................................................................. 8
 2.1 Methodology .......................................................................................................................... 8
 2.2 The Open Source Energy Modelling System (OSeMOSYS) .................... 9
 2.3 The Reference Energy System (RES) .................................................................10
3. Scenario Description ...........................................................................................................12
4. Model Assumptions ..............................................................................................................12
 4.1 Overall Assumptions.......................................................................................................12
 4.2 Electricity Demand ..........................................................................................................12
 4.3 Power generation technologies ...............................................................................15
 Generic Renewable Power Generation Technologies..................................................................15
 4.4 Technology emission factors ....................................................................................18
 4.5 Fuel Availability and Prices ........................................................................................18
 4.6 Renewable Resource Potential ................................................................................19
 4.7 Electricity generation options...................................................................................20
 Existing electricity generating capacity ...........................................................................................20
 Identified electricity generation projects.........................................................................................20
 4.8 Local transmission and distribution technologies .......................................21
 4.9 International Trade Links ............................................................................................21
5. Results..........................................................................................................................................22
 5.1 Reference scenario ..........................................................................................................22
 5.2 Enhanced scenario...........................................................................................................25
 5.3 Scenario comparison ......................................................................................................28
6. Conclusions ...............................................................................................................................33
7. Limitations-Future work ...................................................................................................34
8. Bibliography ..................................................................................................................................35
Appendix A: Detailed Demand Data ......................................................................................37
Appendix B: Africa energy resource potential ................................................................40
Appendix C: Detailed Transmission Data ...........................................................................44

 5
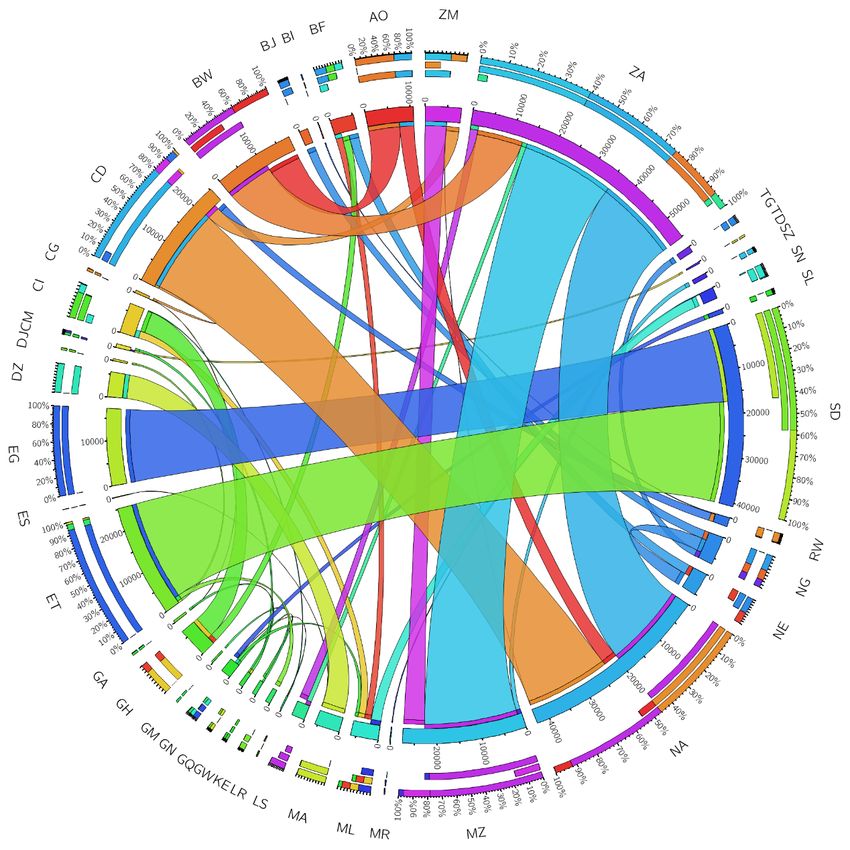
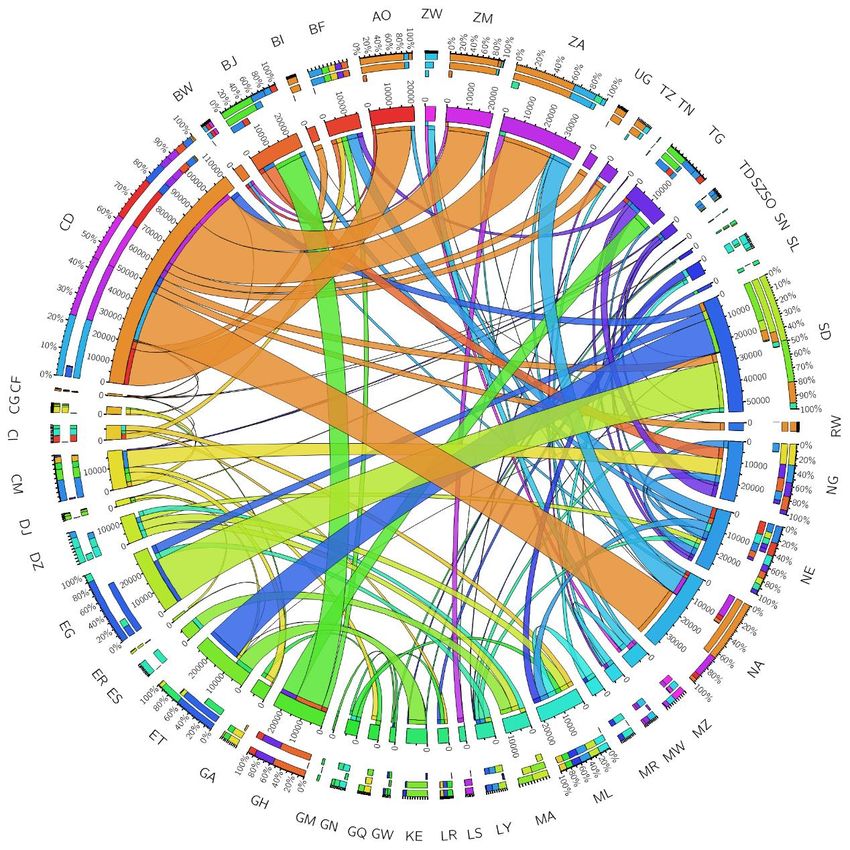
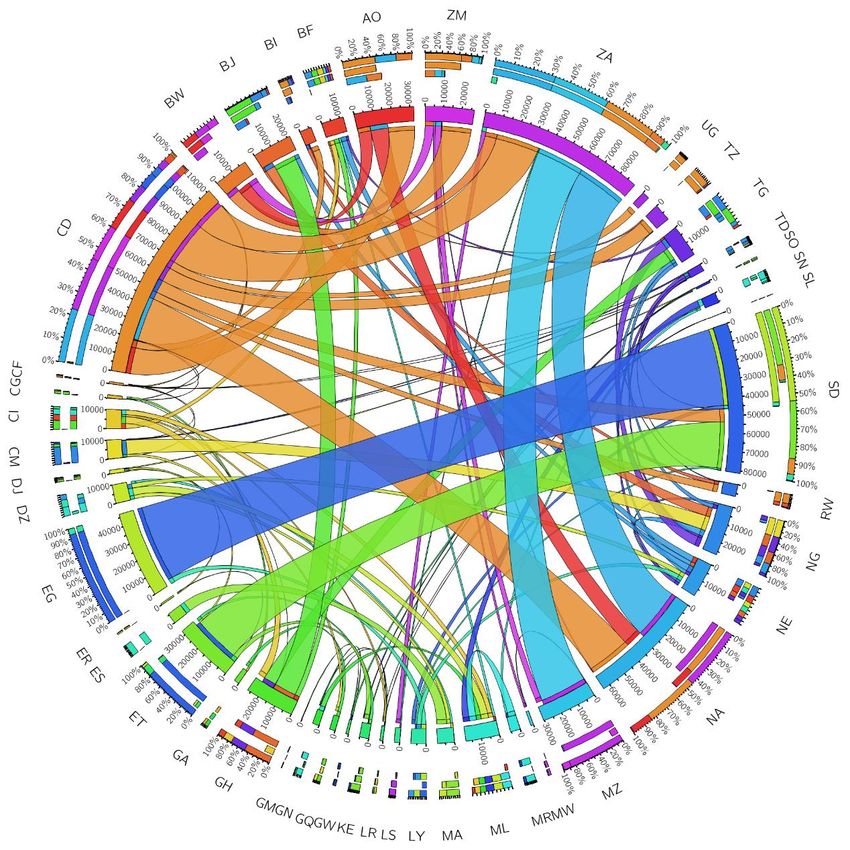
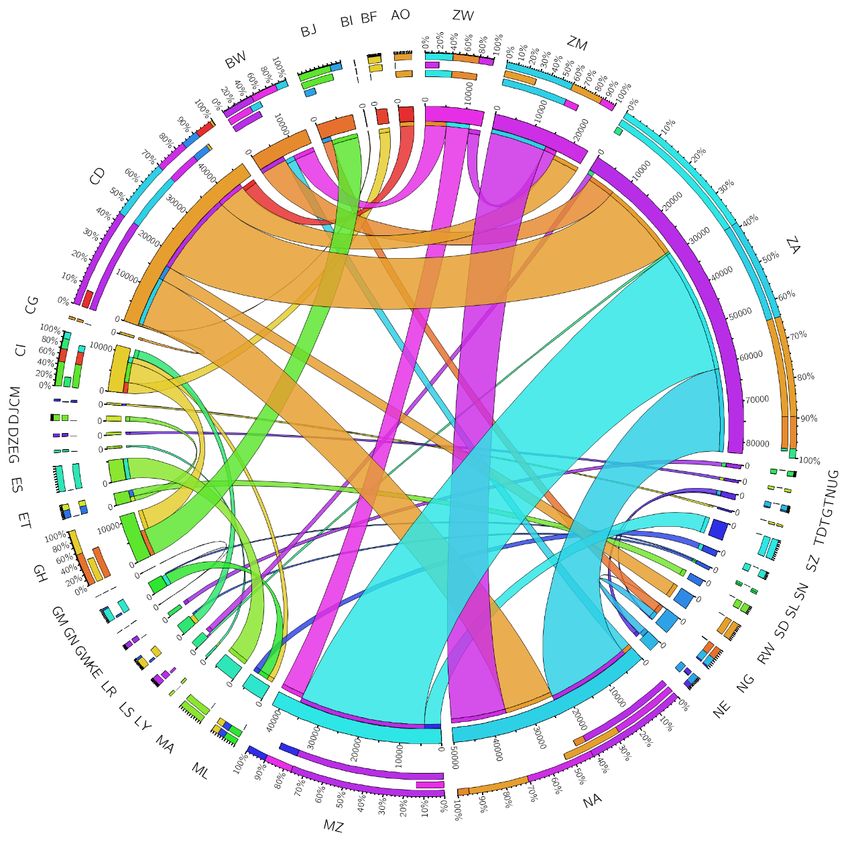
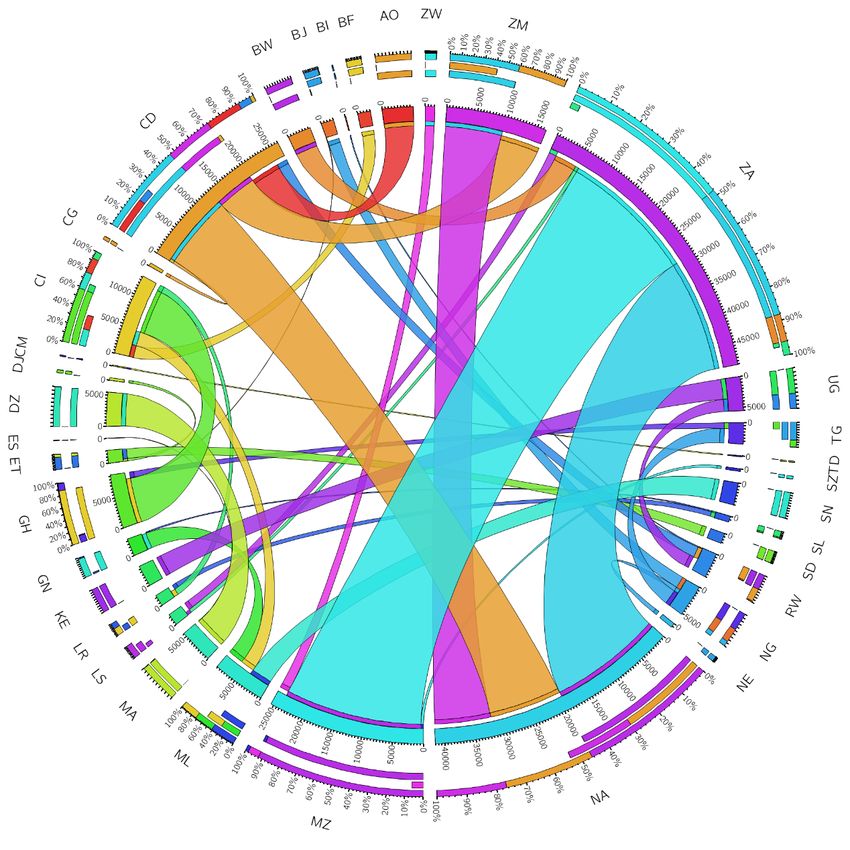
Appendix D: Electricity trades among the countries ..................................................51

List of figures
Figure 1 Countries included in the model by sub-region........................................................................ 9
Figure 2 OSeMOSYS ‘blocks’ and levels of abstraction [2]. ................................................................10
Figure 3 Country power sector model structure. ...................................................................................11
Figure 4 Number and share of population without access to electricity by country in 2016. ........13
Figure 5 Projected electricity demand in Africa and the share of those that gain access. ...............15
Figure 6 Overnight investment costs for renewable technologies. .....................................................16
Figure 7 Total installed capacity per power pool in the Reference scenario the period 2020-2050.
........................................................................................................................................................................23
Figure 8 Electricity generation mix per power pool in the Reference scenario the period 2020-
2050. ..............................................................................................................................................................24
Figure 9 Share of electricity generation mix by country in the Reference scenario in 2050. ..........25
Figure 10 Total installed capacity per power pool in the Enhanced scenario the period 2020-
2050. ..............................................................................................................................................................26
Figure 11 Electricity generation mix per power pool in the Enhanced scenario the period 2020-
2050. ..............................................................................................................................................................27
Figure 12 Share of electricity generation mix by country in the Enhanced scenario in 2050. ........28
Figure 13 Comparison of the electricity generation mix per power pool the period 2020-2050:
Enhanced – Reference. ...............................................................................................................................29
Figure 14 Comparison of the carbon dioxide emissions between the scenarios the period 2020-
2050. ..............................................................................................................................................................30
Figure 15 Comparison of the annualized average of the total fuel costs between the scenarios the
period 2016-2050. ........................................................................................................................................31
Figure 16 Comparison of the annualized average investments costs between the scenarios the
period 2016-2050. ........................................................................................................................................32
Figure 17 Comparison of the total annualized electricity price between the scenarios the period
2010-2050. ....................................................................................................................................................33
Figure 18 Electricity trades among the African countries in the Reference scenario 2020 (GWh).
........................................................................................................................................................................51
Figure 19 Electricity trades among the African countries in the Reference scenario 2030 (GWh).
........................................................................................................................................................................52
Figure 20 Electricity trades among the African countries in the Reference scenario 2040 (GWh).
........................................................................................................................................................................53
Figure 21 Electricity trades among the African countries in the Reference scenario 2050 (GWh).
........................................................................................................................................................................54
Figure 22 Electricity trades among the African countries in the Enhanced scenario 2020 (GWh).
........................................................................................................................................................................55
Figure 23 Electricity trades among the African countries in the Enhanced scenario 2030 (GWh).
........................................................................................................................................................................56
Figure 24 Electricity trades among the African countries in the Enhanced scenario 2040 (GWh).
........................................................................................................................................................................57
Figure 25 Electricity trades among the African countries in the Enhanced scenario 2050 (GWh).
........................................................................................................................................................................58

 6
List of tables
Table 1 Demand per power pool in TWh. ..............................................................................................14
Table 2 Techno-economic parameters for power generating technologies. ......................................17
Table 3 Carbon dioxide emission factors per fuel. ................................................................................18
Table 4 Fuel Price Projections...................................................................................................................19
Table 5 Existing power generating capacity by region. .........................................................................20
Table 6 Identified power generating capacity additions by region. .....................................................21
Table 7 Assumptions for Transmission and Distribution infrastructure ...........................................21
Table 8 Carbon dioxide emissions per power pool. ..............................................................................30
Table 9 Final electricity demands in each country (TWh). ...................................................................37
Table 10 Electrified population 2016-2050. ............................................................................................38
Table 11 Electricity access in Africa (2012). ...........................................................................................39
Table 12 Relative increase of the “others” electricity demand per power pool. ...............................40
Table 13 Africa oil resources and reserves. .............................................................................................40
Table 14 Renewable Energy Potential by country. ................................................................................42
Table 15 Distance coastline factors of inland countries. ......................................................................43
Table 16 Local transmission and distribution losses. ............................................................................44
Table 17 International trade links. ............................................................................................................46

 7
1. Introduction
Africa is endowed with the widest possible range of energy resources all over the world, however
its electricity generation installed capacity is almost 165 GW and only 20% comes from renewable
technologies [3]. The power generation installed capacity of the world’s second-largest and second-
most populous continent is almost the same as the one the United States of America installs in five
years with a population of approximately one quarter of Africa’s or China installs in approximately
two-three years [4]. The significantly underdeveloped electricity infrastructure and un-deployed
power generation potential of the continent leads to more than 620 million people to lack electricity
access, around 50% of Africa’s total population, and the rest to face shortages and high prices [5].
The low electrification rates, 68% in urban and 26% in rural areas, nearly 60% of Africa’s
population to live in rural areas [5], associated with Africa’s significant projected population growth
and energy demand, 1.18 billion people and 589 TWh [6] [7] in 2013, and approximately 2.01 billion
people [8] and 1869 TWh in 2040 [9], make urgent the need for investments in the energy sector
to provide reliable and affordable energy widely available and environmentally sustainable.
Towards that direction and fully aware of continent’s energy sector challenges, forty-seven African
Member States signed the Paris Agreement under the United Nations Framework Convention on
Climate Change on 22 April 2016 [10] [11]. The outcomes of this agreement, source funding,
technology transfer, climate finance and capacity development is expected to help Africa to develop
its renewable energy resources and mitigate climate change. Also, two out of six pillars, science,
technology and innovation, and environmental sustainability natural resources management; and
disaster risk management, stated in the Common African Position (CAP) on the Post-2015
Development Agenda by the African leaders, indicate the development priorities in the continent
[12]. The UN Secretary-General Ban Ki-moon’s launch of Sustainability Energy for all in
September 2011, the United States of America President Obama’s launch of Power Africa, and the
UK’s Energy Africa campaign in 2015, are some additional significant steps which have been done
to provide help in Africa to face its challenges.

The objective of this thesis is to investigate the power generation potential and the financial
requirements which are needed to electrify the currently un-electrified population of Africa,
considered future newly electrified people and their energy intensity, as well as to meet the
electricity demands during the period 2010-2050. The electricity supply system of forty-seven
African countries modelled individually (TEMBA) in an open source long-term cost-optimization
tool (OSeMOSYS) to examine the less costly generation mix of each country has been updated [1].
Moreover, two trade scenarios have been implemented to investigate the effects of the international
grid interconnections in each country’s power generation infrastructure. Investments towards that
direction, extensive grid interconnections among the countries, could exploit each country’s
potential energy resources and lead to less fuel and investment costs, lower electricity prices, and
less carbon dioxide emissions.

2. Overview of Methodology

2.1Methodology
The Electricity Model Base for Africa (TEMBA) developed in the Open Source energy MOdelling
SYstem (OSeMOSYS) [1]. TEMBA includes the electricity supply systems of forty-seven African
countries, modeled individually and linked via trade links, to develop least cost system
configurations the period 2010-2050. The “least cost” is defined for the entire system, and for the
entire modeling period - not for each country individually.

 8
In this thesis, the initial modeling platform remained the same but several parameters are updated
to the latest sources and the objective of the TEMBA study differentiated. The objective of this
thesis is to electrify Africa, except from covering each country’s electricity demands the period
2010-2050 as are included in the TEMBA study. The parameters which have been updated in this
study for each country are the following: electricity demands (2010-2050), existing and planned
power plant capacities, technology costs, fuel availability and prices, national fuel reserves, local
transmission and distribution losses, and renewable resources potential (hydro, solar, geothermal).
Moreover, emission factors have been added into the model to estimate greenhouse gas emissions.
The countries which are included in the analysis, forty-seven in total, have been divided in five
power pools, and are presented in Figure 1. South Sudan and Sudan have been included in the
model as one country, and Sao Tome and Principe, Madagascar, Mauritius, Seychelles, Cape Verde
have been excluded from the study since they are island states that do not affect trade potential
within the continent.

 Figure 1 Countries included in the model by sub-region.

2.2The Open Source Energy Modelling System
 (OSeMOSYS)
OSeMOSYS is a dynamic, bottom-up, full-fledged systems optimization model for long-run energy
planning [2]. Unlike long established energy systems (partial equilibrium) models, such as
MARKAL/TIMES (ETSAP (Energy Technology Systems Analysis Program), 2010), MESSAGE
(IAEA (International Atomic Energy Agency), 2010), PRIMES (NTUA (National Technical
University of Athens),2010), EFOM (Van der Voort,1982) and POLES (Enerdata,2010),
OSeMOSYS learning curve and time commitment to build and operate is significantly low. It builds
on an open source programming language (GNU MathProg) and uses the GNU Linear Programing
Kit (GLPK) solver, therefore, no upfront financial expenditures are needed. OSeMOSYS objective
function is to define the minimum operational cost of the system, by investigating the production

 9

mix of technologies and fuels which required to meet the given energy demand, while satisfying all
the constraints which have been setted for the modelling period. Its block structure (Figure 2) and
flexibility, as well as its open source nature, allow the energy analyst to define his/her model
complexity and to elaborate a wide range of applications.

 Figure 2 OSeMOSYS ‘blocks’ and levels of abstraction [2].

2.3 The Reference Energy System (RES)
The schematic representation of the electricity supply system of each country included in the
modelling framework is represented in Figure 3. In the RES, the technologies are being represented
by boxes and the fuels by lines. Techno-economic (power plant capacities, capacity factors,
efficiencies, lifetime, costs) and environmental (CO2 emissions) parameters are assigned to the
technologies. Each final demand, has been divided into three sectors, and is being supplied by
different energy chains based on the least cost option for the whole continent computed by the
model the timeframe 2010-2050. The extraction or imports of fuel resources accordingly to each
country’s fuel availability define the “primary” level. The fuels which are supplied to the power
plants in the “secondary” level, transformed to generate electricity which will be transmited
through the national transmission network to the “tertiary” level, in order to be distributed and
meet each sector’s final demand. De-centralized technologies, unlike centralized ones, are not
connected to the national grid but generate and supply electricity directly to end-users. Also, in the
model electricity imports/exports from one country to another have been taken into account as
are presented in the Figure 3 below.

 10
Figure 3 Country power sector model structure.
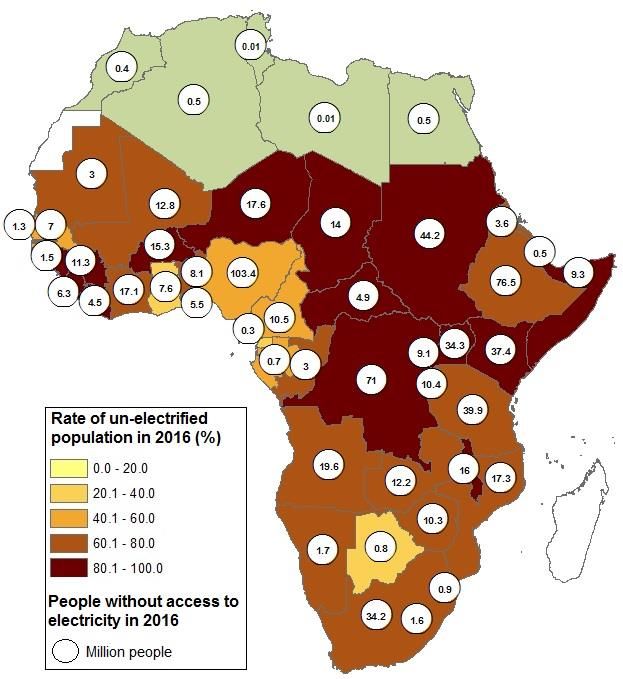
3. Scenario Description Scenario analysis is essential for energy and investment planning, financing needs, informing and formulating energy policies, strategies, debates, decisions, as well as for academic purposes. In this thesis two trade scenarios, Reference and Enhanced, are assessed to investigate the effects of the international grid interconnections in each country’s power generation infrastructure the period 2010-2050. The expansion of the currently limited grid interconnections among the African countries could exploit each country’s energy resources and lead to potential benefits for the continent. The grid interconnection projects which are included in the model and assigned in each country in each scenario are provided in Table 17 of Appendix C. The Reference scenario includes the cross-border electricity interconnections among the African countries which exist and are committed (Table 17,Appendix C). In this scenario, no future potential trades are considered in the model. The future electricity generation mix as well as the investments which are needed by the continent to cover its electricity demands are examined based on the existing energy infrastructure. The Enhanced scenario, additional to the existing and committed trades, includes the planned uncommitted grid interconnections. Potential cross-border electricity interconnections projects among neighboring countries are considered in the model after 2025 to investigate the least cost electricity generation mix of the system. 4. Model Assumptions 4.1Overall Assumptions Overall assumptions across all scenarios are as follows: The real discount rate is 5%. The monetary unit is 2010 US$. The timeframe of the model spans from 2010 to 2050, with yearly basis simulations. In order to capture the key features of electricity demand load pattern, each year has been splitted in two seasons, and each season in two blocks of equal demand, namely “day” and “night”. Transmission and distribution losses are defined on a national level. Different efficiency improvements are assumed to be achieved during the model horizon based on each country’s current status (Table 16, Appendix C). 4.2Electricity Demand The main sources used for each country’s historic electricity demand (until 2013) are the Energy Statistics and Balances of International Energy Agency [6] and the 2013 Electricity Profiles published by United Nations Statistics Division [7]. National indicators, such as urban and rural population [8], electrification rates [5], and energy intensities are used to derive the final electricity demands. The electricity demand of Africa was 540.4 TWh in 2010 and based on the assumptions of this study will be 3416 TWh in 2050. The values of each country’s electricity demand, after transmission and distribution losses, can be found in Table 9 of Appendix A. Also, the number of the un-electrified people and each country’s electricity access in 2016 considered in the model are presented in the Figure 4 below.
Figure 4 Number and share of population without access to electricity by country in 2016. The methodology which has been applied to calculate the electricity demand projections of each country remains the same in all cases. The demand has been divided into “urban un-electrified”, “rural un-electrified” and “others” categories as follows: Urban un-electrified, the urban population who is currently un-electrified and gains electricity access gradually through the period 2017-2030; Rural un-electrified, the rural population who is currently un-electrified and gains electricity access gradually through the period 2017-2030; Others, refers to all the currently electrified portions of sectors in the economy. This includes industry, transport, commercial and public services, agriculture, and residential. The demand projection of “others” sector is based on the projected relative increase among the years derived from the African Energy Outlook 2014 [5] for each power pool (Table 12, Appendix A). The timeframe of the model spans after 2040, so the growth rate of period 2030-2040 is applied for the years 2041-2050. The “urban and rural un-electrified” demands represent the urban and rural population who is currently un-electrified based on the electrification rates of 2012. It has been assumed that the electrification rate of each country will be 100% in 2030, and the energy intensity for both urban and rural population will be 696 KWh/household (TIER 3) in 2030 and 2195 KWh/household 13
(TIER 5) in 2050 [13]. Each household has been assumed to correspond to five persons. The
electrified population considered in the model for the period 2016-2050 as well as the electrification
rates of Africa in 2012 can be found in Table 10 and Table 11 of Appendix A correspondingly.

The total demand of the continent is increasing approximately six times 3416TWh in 2050,
compared to 540.4TWh in 2010 ( Table 1). All the population of Africa is electrified in 2030 and
have an electricity consumption of TIER 3. That year (2030) the total demand of the continent is
approximately two times higher than the 2010. The total demands of Central and Western African
power pool in 2030 are approximately three times higher than in 2010. This is mainly due to
Democratic Rep. of Congo and Nigeria’s low electrification rates and high population. The
electricity demands of these two countries constitute around 50% of their power pool’s total
demands in 2015. The Eastern African power pool represents the highest increase, approximately
by six times, of its total electricity demand in 2030. This is mainly due to Ethiopia, Kenya and
Sudan where these countries constitute around 60% of the power pool’s total demand.

Table 1 Demand per power pool in TWh.

 TWh 2010 2015 2020 2030 2040 2050
 CAPP 13.6 18.9 28 68.9 138.5 244.8
 EAPP 22.2 38.1 62.3 180.7 378.3 698.0
 NAPP 222.3 278.8 340.4 450 594.8 739.3
 SAPP 242.6 256.4 295.6 400.8 552.4 760.5
 WAPP 39.8 58.0 89.2 230.7 497.2 973.5
 Africa 540.4 649.8 815.4 1331.0 2143.1 3416.0

The northern African countries have almost 100% electricity access, except from Mauritania which
has 21%, consequently their urban and rural un-electrified demands are relatively low. Countries
in West and East African power pool account for most of the un-electrified demand since they
have low electrification rates and high population. Figure 5 shows the evolution of the electricity
demand by sector in Africa the period 2010-2050. The total electricity demand in 2050 will be
approximately 6 times higher than the 2013 values. The share of the population that gain electricity
access in 2020 is approximately 2% of the total demand that year, and increases to 23% in 2050.

 14
Electricity demand forecast by sector
 4500

 4000

 3500 Demand from
 those gaining
 3000 access in Urban
 areas
 2500 Demand from
TWh

 those gaining
 2000 access in Rural
 areas
 1500

 1000

 500

 0
 2010 2020 2030 2040 2050

 Figure 5 Projected electricity demand in Africa and the share of those that gain access.

4.3Power generation technologies
In an energy system, in order for the final demand to be covered, generic power generation
technologies are modeled to provide electricity through the grid. These technologies are being
categorized mainly in renewable and non-renewable, and in centralized (upstream of transmission)
and decentralized (upstream of distribution or site specific). Also, certain techno-economic
parameters are defined for each technology [9] [14] [15] [16].

Generic Renewable Power Generation Technologies
The following renewable technologies are included into the model in addition to geothermal and
nuclear. Nuclear technology is avoided to be considered as a viable energy option into the model,
is available only in South Africa (there is already 1.8 GW of installed capacity) and Egypt, while
new additions of this technology can be done only from 2026 onwards. Only the distributed or
roof-top solar PV technology is decentralized, while all the other technologies are connected
upstream of transmission.

 - Small hydro refers to the power plants which their capacity is less than 20 MW.
 - Medium hydro represents the power plants with capacity which range between 20 – 100
 MW.
 - Large hydro represents the run of river and reservoir options for power plants with
 capacity more than 100MW.
 - On-shore wind is represented by two technologies based on their capacity factors, 25%
 and 30%.
 - Biomass include the co-generation technologies.
 - Utility PV represent the PV farms which are managed by the utility. They are modeled to
 produce electricity only during the day.
 - Distributed or roof-top Solar PV are modeled to produce electricity only during the day.
 They can supply urban-rural residential, commercial, and small industries demands.

 15
- Solar CSP no storage represents medium to large scale concentrated solar power plants.
 They were modeled to produce electricity only during the day
 - Solar CSP with storage are medium to large scale concentrated solar power plants with
 thermal storage. They can produce electricity throughout the day.

The learning rates of the renewable technologies throughout the model period are anticipated to
be improved. It has been assumed that from 2035 onwards the costs remain constant. The
projection of the overnight investment costs of the renewable technologies are presented in Figure
6. Also, the techno-economic parameters of the renewables and fossil fuel power generation
technologies used in the model are presented in Table 2.

 $/kW
 8000

 7000

 6000

 5000

 4000

 3000

 2000

 1000

 0
 2010 2020 2030 2040 2050
 Nuclear Geothermal Hydro
 Small Hydro Wind onshore Biomass
 Solar PV (utility) Solar PV (rooftop) Solar thermal no storage
 Solar thermal with storage Solar thermal with gas co-firing

 Figure 6 Overnight investment costs for renewable technologies.

 16
Table 2 Techno-economic parameters for power generating technologies [9] [14] [15] [16].

 Technologies Overnight capital cost Fixed cost Variable cost Life Efficiency Load Construction time (Yrs)
 (USD/kW) ($/kW) ($/MWh) (Yrs) factor
 2010 2020 2035 2010 2050 2010 2050 2010 2020 2035
 Diesel centralized 708 708 708 8 8 2 2 25 35% 80% 2 2 2
 Diesel 100kW system 659 659 659 - - 55 55 20 35% 80% 1 1 1
 Diesel/Gasoline 1kW 692 692 692 - - 33 33 10 21% 72% 1 1 1
 system
 HFO 1350 1350 1350 - - 15 15 25 35% 80% 2 2 2
 OCGT 708 708 708 8 8 2 2 25 30% 85% 2 2 2
 CCGT 1021 1021 1021 1 1 2 2 30 48% 85% 3 3 3
 Goal 2080 2080 2080 27 27 35 37% 85% 4 4 4
 Hydro small scale 5127 5075 5025 41 40 7 7 50 N/A Varies 4 4 4
 Hydro medium scale 1777 1815 1929 26 26 5 5 50 N/A Varies 4 4 4
 Hydro large scale 1777 1815 1929 22 24 4 4 50 N/A Varies 4 4 4
 Biomass 4447 4325 4105 59 54 3 3 30 38% 50% 3 3 3
 Nuclear 4480 4480 4480 112 112 2 2 60 33% 85% 7 7 7
 Geothermal 4898 4769 4356 49 44 - - 25 100% 85% 4 4 4
 Wind onshore 1940 1829 1743 37 33 - - 25 N/A Varies 2.5 2 1.5
 Solar PV (utility) 1562 1158 935 25 22 - - 25 N/A 25% 1.5 1.5 1.5
 Solar PV (rooftop) 1977 1461 1175 33 29 - - 25 N/A 20% 1 1 1
 Solar CSP no storage 4988 3677 2860 200 114 - - 25 N/A 35% 3 2.8 2.5
 Solar CSP with storage 6777 4074 3083 61 42 4 2 25 N/A 63% 3 2.8 2.5
 Solar CSP with gas co- 1374 1374 1374 - - 16.4 16.4 25 53% 85% 3 2.8 2.5
 firing
4.4Technology emission factors
Fossil fuel technologies based on the fuel which are using to generate electricity emit different
levels of greenhouse gases which are harmful to the environment. In the model, different carbon
dioxide emission factors have been linked to each fuel, on the output of import and extraction
technologies in each country, and are presented in Table 3 [17]. These linkages help to identify the
total amount of carbon dioxide emissions being produced by each country.

Table 3 Carbon dioxide emission factors per fuel [17].

 Fuel Mton/PJ
 Diesel 0.0693
 HFO 0.0747
 Gas 0.0503
 Coal 0.0893

4.5Fuel Availability and Prices
The categorization of the fuel prices has been done based on the location of each country (inland,
coastal), as well as their availability on fuels (domestic reserves, imports). The prices of the imported
fuels for the inland countries, compare to their domestic ones, were calculated based on their
distance from the closest coastal capital. The distance coastline factors of each country can be
found in Table 15 of Appendix B. Each country’s proven reserves in coal (bituminous, lignite),
crude oil and natural gas, which were added in the model can be found in Table 13 of Appendix B
[4].

Coal was/is distinguished based on its different energy content, in bituminous 27-30 GJ/ton, and
lignite 10-19 GJ/ton. Therefore, different prices are assumed for each country’s identified domestic
reserves. Morocco and Nigeria which have bituminous and lignite reserves, a weighted average
price was calculated for the coal domestic price.

Two types of crude oil products (heavy fuel oil, diesel) are assumed available for domestic use or
imports.

As far as it concerns the natural gas supply, the inland countries which don’t have imports, don’t
have a pipeline infrastructure, and don’t have domestic reserves, are not allowed to have any gas
imports at any point during the model horizon. The inland countries which have domestic reserves
but no future committed natural gas projects can have gas imports from 2025 onwards. Coastal
countries which currently don’t import natural gas can be supplied after 2025.

The fuel prices for coal, oil products, and gas are based on the World Bank Commodity Markets
Outlook [18] [19] [20] and World Energy Outlook 2015 [9]. It is assumed that all countries have
the same price as the South Africa’s coal (6,000 kcal/kg) until 2015. The period 2016-2025, the
price projections of coal are based on the projected growth rates of Australian coal (6,700 kcal/kg).
The period 2026-2040, the price projections of coal are based on the growth rates of coal price
projections of the World Energy Outlook 2015 for the Low Oil Price Scenario. The crude oil
prices, the period 2010-2025, are based on the World Bank Commodity Markets Outlook and are
assumed as import prices. The growth rates of crude oil price projections of the World Energy
Outlook 2015 for the Low Oil Price Scenario are implemented the period 2026 onwards. The crude
oil domestic prices are assumed to be 5% less than the imported ones the period 2010-2050. For
gas import prices, the period 2010-2025 the prices of Europe’s natural gas derived from World
Bank are assumed, and from 2026 onwards the growth rates of Europe’s natural gas imports price
projections of the World Energy Outlook 2015 for the Low Oil Price Scenario. The gas domestic
prices are assumed to be 5% less than the imported ones the period 2010-2050. As to biomass, it
is assumed to be scarce and its prices defined accordingly [21]. The assumed price evolutions for
fuels are summarized in Table 4.

Table 4 Fuel Price Projections [9] [18] [19] [20] [21].

 USD/GJ (2010 real prices) 2015 2020 2030 2040
 Crude oil (USD/bbl) 48 51.2 74.26 90.17
 Coal (bituminous,domestic) 1.25 1.17 1.36 1.43
 Coal (bituminous,imported,coastal) 1.88 1.75 2.03 2.14
 Coal (lignite,domestic) 1.49 1.39 1.62 1.70
 Diesel (domestic) 9.99 10.65 15.45 18.76
 Diesel (imported,coastal) 10.51 11.21 16.26 19.75
 HFO (domestic) 5.89 6.28 9.11 11.06
 HFO (imported,coastal) 6.20 6.61 9.59 11.64
 Gas (domestic) 6.92 5.91 7.72 9.88
 Gas (imported) 7.28 6.22 8.12 10.40
 Biomass (scarce) 1.50 1.50 1.50 1.50

4.6Renewable Resource Potential
Even though Africa has a substantial solar potential, only South Africa (1.5GW) and Algeria
(375MW) have done investments towards that direction. The same applies for wind potential,
where except the Northern African countries (1,5 GW) and South Africa (1GW), in the rest of the
continent this energy source remains unexploited [22]. Especially in countries, such as Somalia,
Kenya, Chad, Sudan, with wind speeds more than 9 m/s, wind investments are relatively low [23].
The continent’s technically exploitable resource potential from geothermal is about 18 GW and is
much smaller than any of the other primary fuel sources. Kenya and Ethiopia are the dominant
countries representing 83% of the total capacity [24].

Over the next decades, in order for Africa’s rapidly growing electricity demand to get covered, this
significantly renewable resource potential should be utilized. Estimates about each country’s
renewable resource potential: solar, wind, [22] and geothermal [24] [25] can be found in Table 14
of Appendix B. Hydro potential identified in country’s reports and other sources [25] [26].

 19
4.7Electricity generation options
Existing electricity generating capacity
Africa is significantly rich in renewable energy resources, nevertheless the power sector depends
on non-renewable power generation options and only around 19% comes from renewables.
Although in Central and Eastern Africa the renewable technology shares in the power sector are
65% and 63% in Northern and Southern Africa which are the dominant markets of Africa’s
electricity demand, their renewable shares are almost around 9% and 18%. The existing power
generating capacities by energy source and region until 2015 are summarized in Table 5 [3].

Table 5 Existing power generating capacity by region [3].

 Region Coal Diesel/HFO Gas Hydro Solar Wind Geothermal Biomass
 (MW)
 Central 0 658 873 2,886 5 0 0 3
 Africa
 Eastern 26 3,210 766 5,930 33 242 691 22
 Africa
 Northern 2,585 4,786 56,330 4,543 411 1,503 0 0
 Africa
 Southern 41,289 2,963 1,375 7,624 1,585 1,010 0 7
 Africa
 Western 68 3,242 13,292 5,025 55 12 0 10
 Africa

Identified electricity generation projects
The penetration of renewable energy technologies in Africa’s future power sector are being
highlighted in the identified future power generation projects. The future renewable capacities
account for 53% of the total additions, and this is mainly due to hydro in Central (98%), and
Eastern (84%) Africa. Northern African countries are expanding significantly their gas industries,
only Egypt invests in coal power plants. Southern African countries are mainly investing in coal
and gas power plants, especially South Africa (coal - 9740MW, gas - 4009MW) and Zimbabwe (coal
- 5100MW), but their investments especially in hydro and wind represent 47% of the planned
addition.

The summary of future power generation projects, committed or under consideration, by energy
source and region are summarized in Table 6 [3]. Only the projects which are committed are forced
to be used into the future energy system in the model, those which are under consideration are
selected by the optimization process.

 20
Table 6 Identified power generating capacity additions by region [3].

 Region Coal Diesel/HFO Gas Hydro Solar Wind Geothermal Biomass
 (MW)
 Central 500 6 471 48,034 212 0 0 0
 Africa
 Eastern 3,176 757 2,312 30,361 561 1,086 1,310 64
 Africa
 Northern 6,270 20 41,395 281 976 757 0 0
 Africa
 Southern 21,064 868 7,047 21,231 2,167 2,359 0 72
 Africa
 Western 7,390 106 17,524 10,971 839 420 0 45
 Africa

4.8 Local transmission and distribution technologies
Most African countries have unreliable grid networks with high losses, almost double than the
world average, and high electricity tariffs [5]. Each country’s national grid is represented in the
model by transmission and distribution technologies, defined by losses based on country’s
historical data. The off-grid technologies, since they don’t require transmission and distribution
infrastructure, they don’t have any losses and costs. In this study the transmission losses remain
constant over time. Different distribution losses and costs are assigned in each country and in each
of the three demand categories (Table 16, Appendix C). In distribution technologies efficiency
improvements are being made through the years. Table 7 shows the costs of transmission and
distribution infrastructure [16].

Table 7 Assumptions for Transmission and Distribution infrastructure [16].

 Trans. & Dist. Cost
 USD/KW
 Transmission (all sectors) 364.97
 Others 840.4
 Urban 2433.3
 Rural 4233.6

4.9International Trade Links
A cross-border interconnected grid is one of the main driving factors that positively affect the
development process among the trading countries. It promotes security of electricity supply, in
case the country faces generation shortages, and gives incentives for lower electricity tariffs.
Countries which have low costs of generating electricity can provide low electricity prices to their
customers and concurrently export to other countries to increase their profits. Additionally, the
costs for the importing countries will be lower, rather than generating more expensive electricity
to cover their energy needs. However, the current grid infrastructure among the African countries

 21
is limited and thus can’t support extensive trade. The following categories of international trade technologies are considered in the model for the different scenarios (Table 17, Appendix C)[1]. Existing capacities: interconnections which are available from the base year of the model or before, and operate throughout the model period. They are included in the Reference scenario. Future capacities: - Committed: interconnections which are or will be constructed throughout the model period and their operation year has been identified. They are included in the Reference scenario. - Planned: interconnections which will be constructed. Their operation year has been identified, but uncertainties in the implementation process in some of the infrastructure projects exclude their total capacities to be taken into account in the Reference scenario. If the interconnections have been granted financing, they are included in the Reference scenario. Otherwise they are only considered in the Enhanced scenario. - Assumed: future uncommitted interconnections projects which allow trade links among neighboring countries from 2025 onwards, and not included in the existing and committed projects. These capacities are included only in the Enhanced scenario. 5. Results 5.1Reference scenario The significant increase of population, and electricity access of Africa in the future increase on a large scale the energy needs of the continent and thus investments required. The total installed capacity of the African countries was 170GW in 2015, doubles to 364GW in 2030, at which point the electricity access in the continent is 100%, and further increases to 785GW in 2050 (Figure 7). In order for Sub-Saharan Africa to be electrified, its total installed capacity needs to be increased from 96GW in 2015, to 238GW in 2030, and 595GW in 2050. In 2015, the Northern African power pool (74GW) and Southern African power pool (58GW) had the biggest share of the continent’s installed capacity. The Central African power pool (5GW), Eastern African power pool (11GW), and Western African power pool (22GW) increase their installed capacities in 2030 approximately four times compared to 2015 levels, and twelve times by 2050 to cover their energy needs. The Western African power pool’s (228GW) installed capacity, followed by Northern African power pool (189GW), represent most of the continent’s installed capacity in 2050. The enormous increase in the total capacity of Western African power pool is due to the low electrification rates and high population which identify the power pool. This is also reflected by the increase of Nigeria’s installed capacity from 14GW in 2015 to 109GW in 2050. In Northern African power pool, the total installed capacity of Egypt 33GW in 2015, and 112GW in 2050, corresponds to most of power pool’s investments. Eastern African power pool followed by Central African power pool have the biggest increase in their installed capacity, from 11GW, and 5GW in 2015, to 151GW, and 61GW in 2050, correspondingly. The installed capacities of Ethiopia, 22
and Sudan, 2.32GW, and 2.6GW in 2015, and 35.56GW, and 37GW in 2050, represent the biggest
shares of the installed capacities in the Eastern African power pool.

 In 2050, hydro and CSP with storage technologies represent approximately 70% of the continent’s
total installed capacity. In Central African power pool, the investments in hydro represent around
75% of each year’s total installed capacity with the share of CSP with storage technologies to be
increased at the future. Also, several countries, like Egypt, Morocco, Kenya, and South Africa, have
started to harness their wind resources, and continent’s wind capacity increases from 7GW in 2020
to 42GW in 2050. Investments in geothermal technology are only held in Eastern African power
pool, and mainly by Kenya and Ethiopia, 8.2GW, and 2.5GW in 2040. Nuclear technology
investments held in Northern African power pool and Southern African power pool only by South
Africa and Egypt.

In the continent, gas investments are mainly in Northern African power pool, with Algeria, and
Egypt, 17GW, and 30GW, out of 57GW in total in 2030, to be responsible for most of this share.
In 2030, Western African power pool, and mainly Nigeria (11.6GW) constitutes most of the
continents gas installed capacity. The installed capacity of coal in Southern African power pool
decreases throughout the years, from 42GW in 2015 to 7GW in 2050, since South Africa’s coal
capacity decreases from approximately 39GW in 2015 to 3GW in 2050. Western African power
pool increases its coal capacity from 0.07GW in 2015 to 19GW in 2050, mainly due to Nigeria’s
high energy needs 510TWh in 2050. Nigeria shift its investments apart from renewable energy
technologies to coal as well, with country’s coal installed capacity to reach 11GW in 2050.

 250 BASE

 200
 Capacity (GW)

 150

 100

 50

 0

 CAPP EAPP NAPP SAPP WAPP
 Coal Diesel HFO Gas
 Wind Solar PV Solar Thermal Hydro
 Geothermal Nuclear Biomass Dist. PV

Figure 7 Total installed capacity per power pool in the Reference scenario the period
2020-2050.

The electricity generation in the continent increases from 734TWh in 2015 to 1498TWh in 2030,
and to 3854TWh in 2050 (Figure 8). The Northern (382TWh) and Southern (318TWh) African
power pools constitute most of the continent’s electricity generation in 2020. However, the

 23
Western (1110TWh) African power pool, and the Southern (820TWh) African power pool are
responsible for most of the continent’s electricity generation in 2050. Western and Eastern African
power pools present the largest increase in production of electricity throughout the years.

The penetration of renewable energy technologies, such as hydro, solar and wind, in the electricity
generation mix of the countries increases through the years. Countries such as, South Africa and
Morocco, where coal represented 90% and 54% of their total electricity generation in 2014 [6], at
the future they exploit their renewable energy potential, and these shares shift to approximately 1%
(Figure 9). Also, the electricity generation mix of Niger in 2014 was based on fossil fuels (coal, oil)
but through the years, hydro and solar technologies substitute these sources. The electricity
generation of the Central African power pool at the future is based on hydro, representing
approximately 82% of its total generation, and the rest comes mainly from solar thermal
technologies. The implementation of the Inga III (4.8GW) and Grand Inga (39GW) hydropower
projects in Democratic Rep. of Congo the upcoming years could exploit the enormous hydro
potential of the country.

The Central African power pool constitutes most of the continent’s electricity exports the period
2020-2050, 12TWh in 2020, and 42TWh in 2050. An increase which is mainly due to Democratic
Rep. of Congo hydropower potential since the other countries like Cameroon, and Congo have a
small share of the power pool’s net imports. Democratic Rep. of Congo exports most of its
electricity to Namibia and South Africa through the years. Southern African power pool presents
most of the continent’s net imports, where Eastern and Northern African power pool display a
relative increase of their net imports through the years. The share of each country’s electricity
generation mix in 2050 is presented in Figure 9, and the trades among the African countries
(2020,2030,2040,2050) can be found in Figure 18 - Figure 21 of Appendix D.

 BASE
 1200

 1000
 Generation (TWh)

 800

 600

 400

 200

 0

 -200
 CAPP EAPP NAPP SAPP WAPP
 Coal Diesel HFO Gas Wind
 Solar PV Solar Thermal Hydro Geothermal Nuclear
 Biomass Dist. PV Dist.Diesel Net Imports

Figure 8 Electricity generation mix per power pool in the Reference scenario the period
2020-2050.

 24
BASE
 100%

 80%

 60%

 40%

 20%

 0%
 Algeria

 Djibouti
 Benin

 Kenya

 Malawi
 Mauritania
 Mozambique

 Zimbabwe
 Burkina Faso

 Ethiopia
 Gambia
 Guinea

 Liberia
 DRC

 Rwanda
 Niger
 Cameroon

 Sierra Leone

 Uganda
 Chad

 Swaziland
 Togo
 Equatorial Guinea

 South Africa
 -20%

 Coal Diesel HFO Gas Wind
 Solar PV Solar Thermal Hydro Geothermal Nuclear
 Biomass Dist. PV Dist.Diesel Net Imports

Figure 9 Share of electricity generation mix by country in the Reference scenario in 2050.

5.2Enhanced scenario
In this scenario, the total installed capacity of the African countries 170GW in 2015, increases to
361GW in 2030, and to 757GW in 2050 ( Figure 10). The potential cross-border electricity
interconnections project among neighboring countries are considered in the model after 2025. The
total installed capacity in Sub-Saharan Africa from 96GW in 2015, increases to 241GW in 2030,
and to 578GW in 2050. The total installed capacities of Central, Eastern, Southern, and Western
African power pool are 28GW, 53GW, 93GW, and 66GW in 2030, with these levels to increase to
72GW, 145GW, 141GW, and 220GW in 2050. The Central and Eastern African power pool
represent the highest increase in their installed capacities throughout the years, fifteen and thirteen
times correspondingly in 2050, compare to 2015 levels. The Western African power pool (220GW),
and Northern African power pool (179GW) in 2050 represent most of the continent’s total
installed capacity. Nigeria, and Egypt installed capacity is 100GW correspondingly in 2050,
representing approximately 26% of continent’s total capacity. The installed capacity of Democratic
Rep. of Congo 18GW in 2030, and 47GW in 2050, constitutes most of Central African power pool
power system.

The installed capacity of fossil fuels in the continent throughout the years is decreasing, 73GW in
2050 compare to 143GW in 2020. Western African power pool’s coal capacity increases from 1GW
in 2020 to 31GW in 2050, and constitutes most of the continent’s share the end year. This increase
is mainly due to the shift of Nigeria’s energy mix from gas 13GW in 2020, and 12GW in 2050, to
coal 0.3GW in 2020, and 25GW in 2050. In the continent, gas investments are decreasing, especially
in Northern African power pool, apart from Eastern African power pool, from 71GW in 2020 to
12GW in 2050, due to the shift of Egypt and Algeria to technologies such as solar, hydro, and
wind.

Hydro and CSP with storage technologies represent approximately 74% of the continent’s total
installed capacity in 2050. The installed capacity of geothermal in Eastern African power pool

 25
increases from 1GW in 2020 to 18GW in 2050. This share increases mainly due to Ethiopia, and
Kenya, 5GW, and 10GW in 2050 correspondingly, since these countries have started to harness
their geothermal resources at a higher level. The installed capacity of wind potential in the continent
increases from 7GW in 2020 to 23GW in 2050, mainly due to its harnessing by Egypt (15GW),
Algeria(3GW) and South Africa(3GW) in 2050. South Africa and Egypt constitute for continent’s
total nuclear installed capacity.

 250 EXP

 200
Capacity (GW)

 150

 100

 50

 0

 CAPP EAPP NAPP SAPP WAPP
 Coal Diesel HFO Gas
 Wind Solar PV Solar Thermal Hydro
 Geothermal Nuclear Biomass Dist. PV

Figure 10 Total installed capacity per power pool in the Enhanced scenario the period
2020-2050.

The electricity generation in the continent from 734TWh in 2015, increases to 1509TWh in 2030,
and to 3864TWh in 2050 (Figure 11). Most of the continent’s electricity generation in 2050 comes
by Western African power pool (1085GW), and Northern African power pool (852TWh).
However, Eastern, and Western African power pool represent the largest increase on their
generation, approximately eight and ten times correspondingly compare to 2020 values.

The generation from fossil fuels in 2020 constitute approximately 61% of continent’s electricity
production, with this share to drop to 9% in 2050. Only Western African power pool increases its
coal based electricity generation throughout the years. This is mainly due to Nigeria’s coal electricity
generation increase from 2TWh in 2020 to 160TWh in 2050, since Ghana’s coal electricity
generation decreases from 4TWh in 2020 to 2.5TWh in 2050. The coal electricity generation from
Nigeria throughout the model period represents approximately 86% of the power pool’s and 75%
of the continent’s coal electricity generation. Countries such as Egypt, and Morocco which
represent most of the Northern African power pool coal electricity generation in 2020, 14TWh
and 14TWh correspondingly, shift to renewable energy technologies at the future and these values
drop to 7TWh and 2TWh respectively.

 26
You can also read